Know How To Exit A Trade, Before You Get In

This may sound counterintuitive to many people, but all the successful traders out there know this:

You have to know how you’re going to get out of the trade, before you get in.

Most people call this an “Exit Strategy” and it’s something you need to really think about every time you place a trade. And it doesn’t matter if you trade stocks, or if you trade forex, or ETFs. This applies to ANY kind of trading.

So the first thing you need to figure out is where to place the protective stop. This varies greatly on your trading plan, which methods you’re utilizing, and where points of support or resistance are in the market you’re in, but just know that using stops is not an option… It’s a necessity.

Now the next step is setting your profit objectives. And this is something I want to dig a little deeper into.

As a rule of thumb, your profit objective is 1.5 times your initial stop loss.

1.5x. Write that down because it’s important. It’s not 3x or 4x, or 5x the initial stop loss. Now you often hear: even if the “amazing trading system of the day” is only 50% accurate” then with a risk / reward of say 3:1, that trader will be hauling in truck loads of money? Right?

I disagree. That trader might have a truckload of something, but it’s not going to be filled with money! Trading with those kinds of ratios equate to one thing:  A busted trading account.

The fact is, you could be using a very good system, but if you over extend yourself like that, your win to loss percentages will shrink rendering what your doing simply not profitable.

Now there are always exceptions to rules like this. One would be if you’re using multiple exit strategies you may have ONE of them set at something as high as 4:1, but that’s only if it’s carefully planned in conjunction with other more conservative exit strategies.

The reason is VERY few trades will ever meet a 4 to 1, or even a 3 to 1 ratio unless you happen to be in one of those “impossible to lose” trends that honestly, don’t come around very often.

Another thing to think about is that you should consider using a system that moves these parameters around dynamically while you’re in the trade. That way you’re constantly minimizing risk in case the trade turns on you, and at the same time maximizing profits if the trade goes in your favor.

Now I’ll talk to you more about exit strategies in the near future, but if you can take away one tidbit of information with you today: Just remember a profit objective of 1.5 times your initial stop is always a safe place to start.

Looking For Price Momentum?

Today I would like to discuss the charts for both gold and silver.  When we are looking to determine whether or not we should be buying or selling gold or silver we need to first look to identify the direction or the trend the chart is moving.

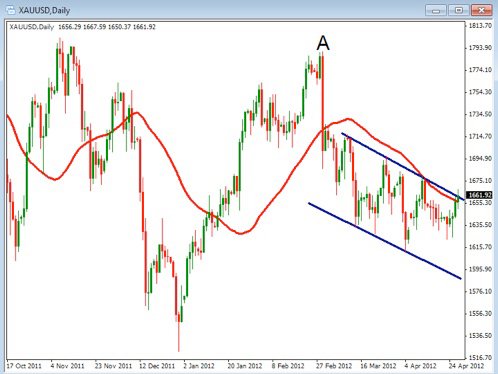
Let’s first look at the daily chart for gold.  There are a few things that we can look at to help us determine if the momentum is moving up or down.  The most important thing is to look at is what the price is doing.  If price is going up then the momentum is bullish and if the price is going down the momentum is bearish.  We can also look at moving averages or drawing trend lines to help us identify this momentum.

Notice on the far right hand side of the chart that the price has been moving down over the last couple of months.  At point A we had a high around $1790 on February 29th and if we compare that to today’s price at around $1662 you can see that the momentum or the price action has been moving lower.

You can also see the 40 period moving average (red line) at this current price is pointing down.  Finally, if you look at the trend lines (blue lines) connecting the lows and the highs you’ll notice that the channel moving lower.  What this tells us is that the momentum of gold prices have been bearish over the last couple of months.  As we take that into consideration we should look for opportunity’s to take advantage of this bearish momentum.  As with any price movement, we know that the current direction at some point will change from bearish to bullish.  Notice how the price is beginning to move back up above the moving average.  This may be a sign that the price would like to go higher.


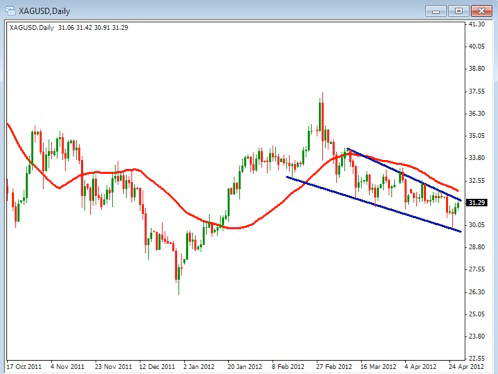
Now let’s take a look at the daily chart for silver.  Notice the similarity between the gold chart and the silver chart.  This chart also shows downward or bearish momentum with the price action.  The moving average is also pointing down and the trend lines are forming a downward channel.  With the price of silver in a bearish alignment we would also look for opportunity’s to short this.

As we look for a opportunity’s to trade gold or silver we want to first identify the trend by looking at the price action, moving averages and price channels.  Once we identify the direction it is moving we will then know whether we should be buying or selling.

Take some time to practice looking at price action, moving averages and drawing channels to help you better identify the direction to trade both gold and silver.

Managing A Roller Coaster Market

Hello everybody.  The last few weeks in the markets have left many investors nervous and unsettled.  One day we get positive economic data about the economy and the market’s rally, the next day, bad news on the European debt situation carries the day, and the markets tumble.  We have been seeing this “everything is fine”  to “the sky is falling”  over the last few weeks and the euphoria to depression cycle is really giving many investors “emotional fatigue” and a down-right fear of the markets!  We find ourselves second guessing our strategies and even questioning our methods, etc.  During these times of market swings, volatility, and uncertainty, remember the markets go through booms and busts, they have in the past and will into the future.

It was just 3 ½ years ago when we watched the equity markets crash as they contracted almost 50% in late 2008. I remember people saying the markets and investing was over as we knew them and other such nonsense.  As a student of history and on observer of the markets for over 30 years, I believe in the markets. I certainly do not have a crystal ball, but, I simply know this: bubbles occur, corrections happen and emotions tend to push the markets to “over-correct,” which then opens up opportunities to invest for those who have been patient and prudent with their Risk Management.  Wise investors will have funds available to invest in the market as those opportunities arise.  These investors are patient while they look for the right opportunities.  Just like in the housing market. There was a bubble, it corrected, and there are still many opportunities for those with the right position to capitalize on them. My experience tells me that wise investors also have this in common; If they have been patient and prudent with their Risk Management, they will have funds available to invest in the market as new opportunities arise.

In conclusion, my philosophy is not to just stop trading in volatile markets, but  to be more selective about your positions, and to lower the risk, by reducing your position sizes,  while waiting for the market to “settle down” and generate new opportunities.

The Internal Conflict That Trading Can Create

I find traders to be a very curious type of personality in several ways.  Though traders do need to be dogmatic at following their rules and minding their setup conditions, they still need to be very flexible in their thought process.  Often times these two aspects of trading put the trader in direct conflict with themselves because though they may be following their rules as unemotionally as possible they still need to have some judgment and know when their rules should be broken.

Many people believe that the markets move in a completely random way often times appearing to be chaotic though the longer you watch the markets and look at charts what you may find is that a market is actually a series of repetitive patterns that we as traders are trying to recognize as early in their development as possible.

That being said, we will not always recognize the emerging or developing pattern as early in its development as we would like,  which may largely determine if a trade is successful or not.  We also need to be flexible enough in our thinking to recognize when we are just wrong.  There is nothing bad about being wrong in this regard but forcing the issue can lead to more bad things happening.

Trading in an open market by its nature lends itself to the need for great flexibility in thinking though often times we can get so caught up in following our rules that we will let a trade go all the way to our stop loss losing the full amount that we risked on a trade because we are often times stubborn.  One thing that we all should know is that we cannot control the market nor do we need to but at the same time we do not need to let it control us.  We may consider moving our stops to a much tighter position when we know that there is an event, possibly international economic news or company earnings announcements, that will likely effect the market we are trading in or the specific issue that we are trading but often times I notice traders taking a blind eye towards these events that can really hurt the overall value of their accounts.

If we are quicker to move our stops to a tighter position, especially when a trade is in the money, and if we are quicker to exit a trade if it appears as though the price action may turn against us, these two small adjustments can be the difference between having a profitable account versus an unprofitable account.  Generally speaking winning trades are easy to manage in the respect that many of them win simply because we are on the right side of a move so there is no need for us to do anything but managing the losing trades is where we can have a huge impact on our accounts.

If we diligently manage the losing trades reducing them and possibly eliminating some of them altogether this in many ways will have a greater impact on our profitability than having more winning trades.  It is always nice to have more winning trades but what if we reduce our losses by 10% or 25% or 50%, this reduction in losses would likely have a much greater impact to the bottom line of our accounts over time than anything else we can do with virtually the same amount of work.  The odd thing about reducing our losses is that it is not really that difficult to do if we make it a priority and if we diligently manage our assets it just appears as though many traders simply don’t do it taking loss after loss and complaining about them as they happen.  We may consider being proactive in this regard and looking at asset or account protection being as important as finding the profitable trades.

How To Use Support And Resistance

Today we’re going to talk about the concept of support and resistance.  When trading in the Forex market and looking at charts the first thing that we want to do is identify the momentum of the pair. Sometimes this momentum is called the trend.  Knowing the trend gives us the direction we should be buying or selling.  Once we know the direction the price is likely to move by identifying the trend then we want to identify barriers for that price movement.  These barriers are known as support areas and resistance areas.

Support areas are like the floor in a room.  As the price approaches this floor, buying pressure comes into the market causing the price to go up or bounce up off of this support area.  The opposite is true for resistance.  Resistance is like the ceiling in a room.  As the price approaches the ceiling selling pressure begins causing the price to move down from this area of resistance.

As we learn to identify these areas they can help us know the best time to enter into a trade.  For example, if the trend is moving up and price has moved back down to a support area we want to look for an opportunity to buy as the price begins to move up off of this support in the direction of the trend.  In addition if the price is in a downtrend in has moved up to resistance we want to look for opportunities to short the pair as it begins to bounce down from resistance back in the direction of the trend.

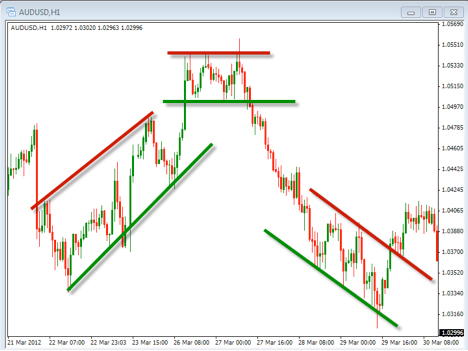
There are two primary types of support and resistance.  One type is horizontal price support or resistance.  This is usually identified by drawing a horizontal line connecting the highs or lows of the price action.  The second type is diagonal or trend support and resistance.  The difference is that this support in resistance areas on created on an angle either moving up or down.  Take a look at the chart below as we identify both horizontal and diagonal support and resistance.  In addition to identifying these areas of support and resistance you can also form channels which show the direction that the trend is moving.

Remember as we identify opportunity’s to trade in the Forex market we want to look for two things.  First the trend or the direction the price is currently moving and second barriers to the movement of that price as identified with areas of support and resistance take some time to review how to draw these lines so that you can better identify where the price may have difficulty moving beyond

Trade These ETFs Instead…

Hi everybody… now last week I went into great detail showing you they types of ETFs we should AVOID. Hopefully you had a chance to go though those example ETFs and now have a sense of what not to trade.

But now I want to show you the other side of that going. I want to show you the types of ETFs that you SHOULD be trading.

Now, again, remember that these are just examples. There are many of ETFs out there that behave in the same negative and positive ways as the examples I’m showing you here. So the key is to look at how they behave. Take that behavior and use it as a test to look at all ETFs to see if they’re worth a 2nd look as a security you’d be interested in trading or not.

So, let’s look at an ETF that is quite suitable to trade, and one that I think offers a great deal of opportunity right now.

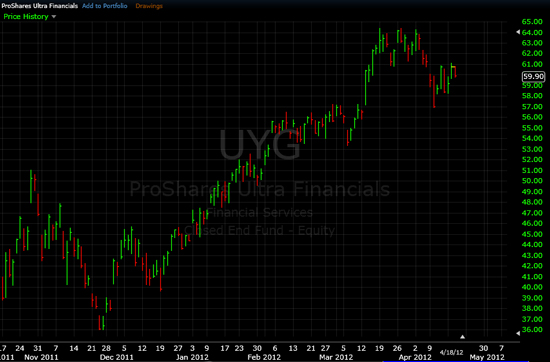
This is UYG, the Pro Shares Ultra Financials ETF. If you look at this chart, you can see that this ETF for the most part has been trading deliberately for at least the last six months. You will see a few price gaps, but not many. You don’t really see any unusually wide range bars. You also have a nicely trending market, up or down. It doesn’t always have to be going up, but even back in October, it was moving up nicely, then it moved down nicely, moved back up a little, corrected and then it was on a nice upward trend for the last three or four months. Now this is a deliberately trading market. This is the kind of ETF you want to be trading in.

In my judgment, out of the over 1,000 ETFs in the United States that are available today, less than 100 of those are trading deliberately enough like UYG to be considered tradable vehicles. I say that because you first and foremost goal has to be to manage risk. So there is no point, you can’t trade them all anyway, so you might as well trade the ones that are trading the most deliberately so that you can keep your risk to a minimum without sacrificing profit potential. This UYG is just such an ETF. You can see the dramatic increase since late October up over 60 percent, in just a few months.

Now you might think that that is great for others, but you missed that run. I don’t think so. If you look at what is going on right now, the ETFs sold off here in the recent market sell-off, right into the 50 day moving average which should provide strong support. If you look at what is going on in the banking sector here in the United States, you have the opportunity to generate some pretty impressive profits here in the next several quarters, as the long term interest rates continue to go up and the Fed continues to keep the short rates low, that spells profits for banks. Someone knew all about that, that we all know by the name of Warren Buffett when he bought a significant stake in Bank Of America last fall. Sure enough, his investment is already paying off. So I think there is a lot more to come here. I think this is a good opportunity to buy UYG right in here. Of course, depending on your trading style, if you are a short term trader, you are going to want to have some fairly tight stops in here, probably below the recent lows here. If you are more of a position trader, you might want to give it a little bit more room. It depends on your trading style.

So there is a lot of opportunity in these ETFs.  You have to trade the right ones, those that are trading deliberately. They tend to be the ones without the unusually wide range of bars, a lot of gaps, or a helter skelter pattern. Those tend to be the higher volume ETFs.

Don’t Trade These ETFs!

Hi everybody, Bill Poulos here. I’m talking about ETFs today, and let’s start by going over a few basics. ETFs have really grown in popularity over the last several years, edging out more and more mutual fund money and for good reason. ETFs trade like stocks, many of them are highly liquid, and their expense ratio is much lower as a rule than mutual funds. There is quite a variety to choose from now. So an ETF is a fund of stocks or commodities, or other tangible assets that can be from various industries, sectors, or any way you want to cut it, long ETF funds that trade only short positions, these are ETFs that go up when the market goes down. There is a growing variety of ETFs to choose from.

The ETF markets in the United States are most mature. There are less mature ETF markets developing in the UK, Australia, and Canada. Those are also growing quickly. The thing I want to point out here that is so important with these ETFs is that they are not all created equally. In the United States alone there are over 1,000 ETFs to choose from. But not all of these are tradable. In fact, most of them are downright hazardous. You should not trade these ETFs. If you do, you’re asking for trouble. You might as well just send the broker a check and call it a day. However, if you know which ETFs to trade, then you have the opportunity to do very, very well. It actually isn’t that difficult once you know the secret as to which ones are suitable for trading and which ones are not.

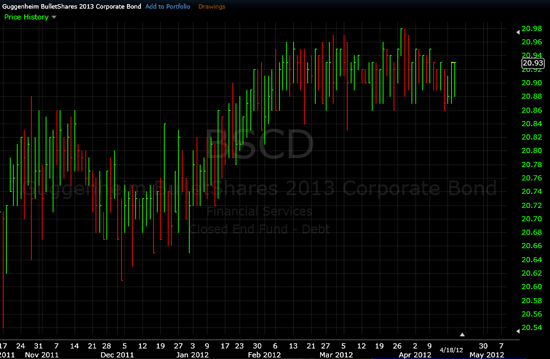
I use the term “deliberately trading” to describe the kind of market action that we want to see in ETFs before we consider trading them. I am going to give you an example of one such ETF in a moment. But before I do, I want to give you some examples of ETFs that are not trading deliberately. One would be BSCD, Guggenheim Bullet Shares.

If you look at that chart, you’ll see that it looks like an electrocardiogram where the price just jumps all about, day after day after day in a zigzag fashion. It really does not go anywhere. Yes, it is a bond fund, but it is one that you don’t want to trade. Take a look at that chart and you’ll see what I mean.

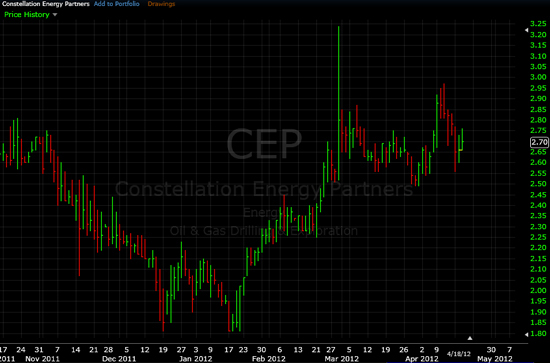
Another one is CEP, Constellation Energy Partners. That one does have some trending going on, but if you look closely, you will see some extremely wide range days, especially at the end of February. That’s not the kind of ETF you want to trade, because if you can get a very, very wide range day like they did at the end of February, that means you can get that at any time without warning, and that spells risk. So this is a market that is not trading deliberately. Any market that does exhibit these unusually wide range days, you want to stay away from them.

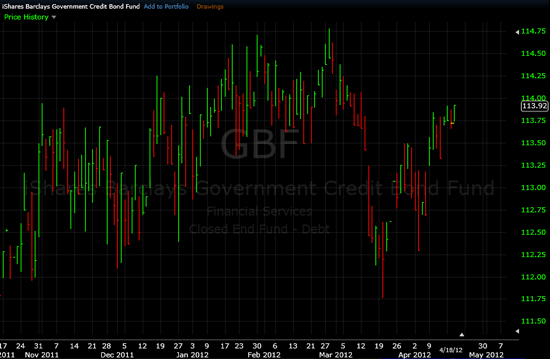
Let’s look at another one. Check out GBF. Now this one is the Ishares Barclays Government Bond Fund. It’s another bond fund. It’s fairly flat, but even so, if you look back in time toward the end of September, you will see a very crazy wide range day. With no explanation, you see another one in early to mid-October. You will see a lot of gaps in the price from day to day. It’s not going anywhere. So you have non-deliberate behavior, and you have a price trend that is basically flat. So why trade this ETF?

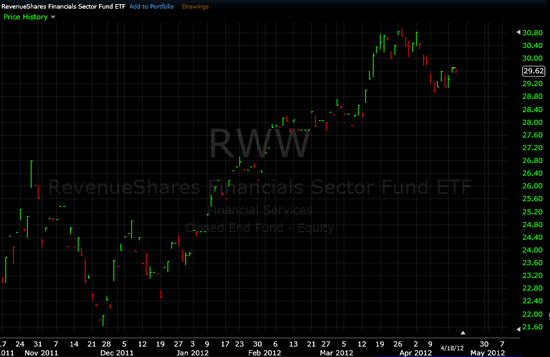
Let’s look at one more. How about RWW, Revenue Shares Financial Sector. Now this one has a nice uptrend, but look at what is going on here. Look at the gaps from day to day. You have hardly any trading going on. Some days there is very low volume ETF. Also watch for gaps in prices. A gap means that the low of today is higher than the high of yesterday. Whenever you see gaps in prices, especially a lot of those gaps, you want to stay away from that kind of ETF for trading purposes, because gaps spell higher risk. These can occur without warning and blow right on through your stops, regardless of the method you are using. So you don’t want to trade any of these ETFs that exhibit unusually wide range days, gaps, or a helter skelter kind of pattern that looks like an electrocardiogram. Those all spell high risk. Those tend to be the ETFs that are lower volume, but not always. You can have some high volume ETFs that are not trading deliberately and you want to stay away from them.

Now next week, I’ll show you an example of an ETF that you DO want to trade. And I’ll show you why, and how you can easily spot these. Till then, study what I showed you above and use it as a test to make sure you stay out of potentially hazardous trading situations.


Market Declared Obamacare Bad For Healthcare Industry

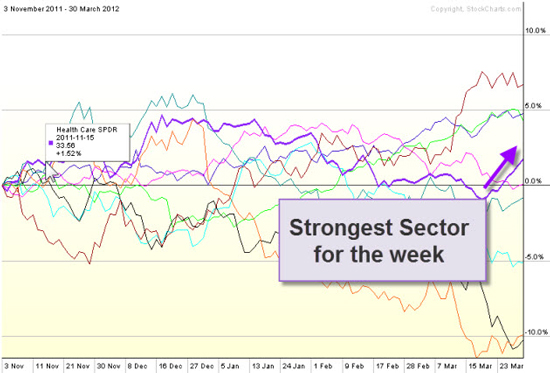
Though the major market indexes showed lackluster moves throughout the week, the price action of one sector sent a loud and clear message in response to the hearings being held by the U.S. Supreme Court. The Healthcare sector improved, as measured by the SPDR Select healthcare index fund (ticker symbol XLV). In doing so it outperformed all other sectors as shown in the following chart.


The healthy 3.5 percent gain capped off a week’s price action that opened near its low and closed near its high for the week. Considering that the rest of the market’s performance was so muted, it is hard to miss the significance of this sector’s action in connection with the Supreme Court hearings on the Affordable Healthcare Act. The message from the markets is clear: without this legislation, companies in the healthcare sector stand a much better chance of making money.

How much better that sector’s chances are remain to be seen. A lot may hinge on just what the Court decides to do along the spectrum of its options. Will the justices settle for rejecting the so-called mandate of the law or fully rejecting the law altogether? The greater the rejection, the greater the likely gains you could expect for XLV in the coming days ahead.

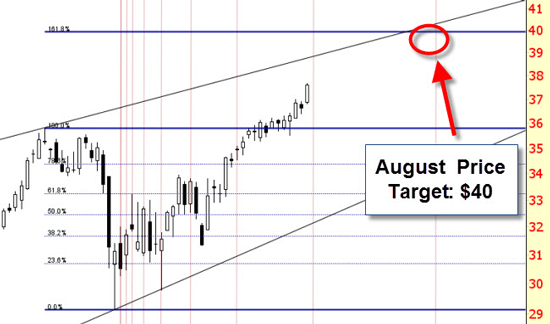
In this next figure XLV is shown to be moving within a large rising wedge that spans back over two years. Using a Fibonacci projection based on the most recent pullback within this pattern shows a particular price target that aligns with both the upper resistance of the channel and a Fibonacci time series (see below).


Based on these combined projections, XLV could easily rise another seven percent between now and August. But this technical projection may underestimate the potential for this sector. Considering that XLV rose three percent merely on the early indications of these hearings, how might the price change if every component of the law were stripped away?

An additional question to ask is that if investors believe the healthcare sector is likely to do well from reduced legislation, might other sectors also be seen to benefit likewise? The healthcare industry’s bounce higher, if the move should continue, may well translate into greater euphoria for business prospects across a much broader spectrum of market sectors.

Since major market indexes have not included a response to the Supreme Court’s leanings, one can only assume that more distinct decisions by the Court will unlock analyst calculations of value for the broader indexes. Further action and definition over the next couple of weeks, coinciding with the advent of earnings season, could allow the market’s more bullish participants to surprise many of those worried about a coming correction. But either way the healthcare sector is likely to be an outperformer over the coming quarter.

Which ETF is right for me?

Within the ETF world there are a huge range of choices, I often get the question:  “Where do I start; which ETF’s are right for me?

There is such a broad range of ETF’s, investors new to them have a hard time understanding where to begin:  My suggestion is to always start with things you are familiar with understand and then branch out to other things as your portfolio warrants it.  So the best way to get started is to become aware of what is available. Generally, I separate the ETF market into broad categories:

Equity Index ETF’s

Bond ETF’s

Commodity ETF’s

Now within each broad category there is no shortage of creativity on the part of the issuers.  We have Bull market ETF’s that follow the uptrend of the market. We have Bear market ETF’s that are constructed to follow the downtrend of the market. We have ETF’s that are leveraged x2 and x3 to double or triple the market’s average move.  In Index ETF, you have large caps, med caps, small caps, international index funds and emerging market funds, the choices seem almost limitless and just when you think you have it all down, more ETF’s pop up. Especially on the international scene, while the US ETF market is fairly mature, the international markets are just getting started.

My best advice to those getting started in ETF trading is first, start with something you know and are familiar with.  If you are involved and have knowledge of certain industries, say “high tech” look at one of the Technology Sector ETF’s.  If you follow macro economic factors, a good index fund could be the place to start.  If you are looking for international growth, look to one of the established international equity index funds.  Secondly, make sure you know the “true” objectives and goals of the fund.  With so many ETF’s now available, be sure to check out the funds holdings with a little bit of research.  Sometimes the official title of the fund can be a bit generic  or the funds can alter their course from their original objectives.  One can find out much about a fund with a 1-2 minute search on the internet and can save a lot a second guessing and stress down the road.  Also, a word of CAUTION concerning “Leveraged” ETF’s.  Some have performed fabulously in the most recent market run up, but as always, what goes up quickly can come down just as fast when the market reverses and  all your profits  can quickly turn to losses, so beware!

So like any investment, first identify you investment objectives.  Make sure your objectives are clear and practical.  Secondly, do you homework to make sure what you are investing in will meet your clear objectives!  Thirdly,  don’t put all you “eggs in one basket,” in other words, even in the ETF world, spread you risk around by diversifying, as best you can, so that you are not putting all you money on one or two ETF’s.   Portfolio Risk Allocation rules should be used when investing in any market including ETF’s.  And forth, have Fun with the huge variety of choices,  ETF investing can become enjoyable as well as profitable.  Remember; enjoy the journey as well as the destination and ETF’s are a good place to start.

Should Traders Look For Instant Profits?

One thing that seems to be a very common trait among traders, regardless of the time duration they trade on, is that we all seem to want immediate gratification. If we are trying a new trading method or a new trading idea it is very common for us to want it to work and to work right now. If the idea does not immediately produce results it seems we are very quick about throwing the idea away or making major changes to the plan which often times gets us away from the original reason that we created the method or plan.

If we create a trading plan for ourselves typically it will conform to our own personal thought process and attitudes that we may have about trading. Traders are just like anyone else in another profession or discipline, we all have our likes and dislikes and personal believes about it. When we create a trading plan it will typically come from looking at the charts for a very long time and noticing recurring events. My opinion is that trading really is recognizing recurring patterns as early in their development as possible so we can take advantage of the movement. When we develop a way to see the prevailing pattern early on the methods will not always work largely because the pattern may change or we may be recognizing something that really isn’t there. Regardless of the reason we really should consider giving our ideas a good amount of time to see if they are really going to work out or not before we begin to make changes. Once we do decide that changes are necessary making slow gradual changes or adjustments and testing the effect of each one on the overall method seems to be the most effective way to proceed in most cases.

I regularly see traders, and I have been guilty of this in the past myself, going from one trading idea to another never really giving any of them a real opportunity to work or fail on their own. We tend to get sidetracked very easily by what our trading buddy’s tell us they are trying or what we may see on the internet. I can’t tell you how many times I talk to traders that finally have recognized this when several months later or even a few years later they come full circle back to their original idea and all of the sudden realize all the time they have wasted chasing other ideas that didn’t work any better than the first idea.

Taking a businesslike approach to trading rather than a spastic or sporadic approach, making slow and methodical changes to our ideas with a great amount of documentation so we remember what works and what effect each change had on our results seems to be what most successful traders I have talked to have done to become successful. Trading is not a get rich quick scheme; there is no substitute for our own personal experience, we all have our own learning curve and unfortunately we do need to be patient until we succeed at it.