This Week In Gold

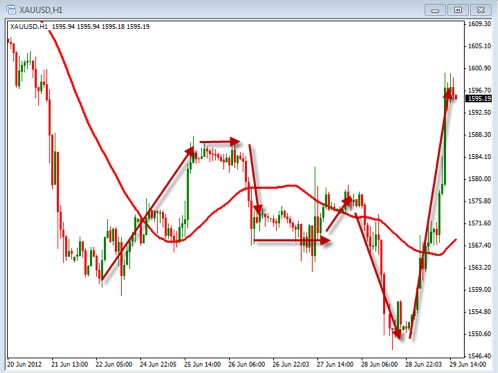
Gold, Gold, Gold, what to say about gold? This week has been a bit of a challenge with gold as we have seen it move up, down and sideways through most of the week. In the end, with the news from the EU Summit, we saw the price jump up sharply to close near the $1600 level. Right now, as with many of the other markets, we are seeing much volatility and non-deliberate movements. This can make things a bit more difficult with knowing when to enter a trade. Overall, if things are hard to read it is often times best to stand aside and wait. At some point things will begin to become more deliberate and that is when we want to look for our trading opportunities.

Take a look at the hourly chart above and notice the arrows the have been drawn.  This is a good example of how this week traded.  You can see the up, down and sideways moves that have occurred, followed by the end of week move up.  Ideally, we want to see a nice consistent and deliberate moving price action in order to look for good trading opportunities.  Keep that in mind when looking for entries.  In addition, holding positions over this weekend may be a bit more risky as any new that may come out could push the price of Gold up or down quickly and cause the charts to gap up or down.

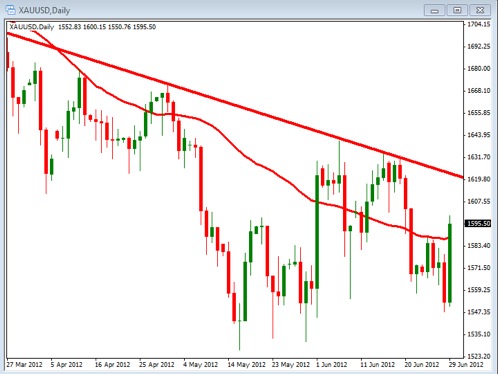
Now take a moment to evaluate the daily chart shown above.  Notice two things – the trend and support/resistance.  Here we have drawn a downward trend line that has been acting as an area of resistance and may continue to do so in the near term.  This resistance is currently sitting around the 1619 level.  We also have the 40 period SMA that is currently moving down.  Both these things point to a bearish Gold trend.  In order for this bearish trend to change we will need to see the Moving Average point higher and the price breaking above this resistance line.   If that happens we will change our stance to bullish from bearish and look for opportunities to buy Gold.  Until then we need to look for shorting opportunities with this chart.  You should also notice that the volatility is similar to what we saw on the hourly chart above in that there is very little deliberate movements occurring.

In the end Gold continues to be volatile and non-deliberate in its moves so exercise caution when placing your trades and use good solid risk management rules in those trades.  It’s not all about trading, it’s about trading well.  Look for the trend to become deliberate prior to placing your trades.

How can you sleep at night in these market conditions?

For the last several months the markets have been more volatile and especially over the last couple of weeks, with the Greek elections, a wider spreading European debt crisis, talk of global recession, and an uncertain U.S. economy many traders don’t know what to do next.  Every trader would just like to find that “holy grail” of trading systems so that all of the risk in the market could be eliminated.  That desire starts with the wrong headed notion that investing can ever be easy or risk free.  Most successful investors, at one time or another in their investing career have spent time and money searching for the “perfect” system. The truth is there is no perfect system. There are many good systems out there and even some really good systems; however, there is NO perfect system, period!

This brings me to the topic of trading robots.  If I get one more email claiming to have the SECRET to success by trading their new “never before revealed fully automatic no loss trading robot,” or some other such nonsense, I would like to scream.  If there was a robot that was so great, why are they now revealing the “goose that is laying the golden egg” to the world?   If I had such a trading advantage, I would surely use it to make a whole lot of money trading.  The hard reality is that there is no effortless way to make money in the market no matter the claims on radio, or infomercials or unsolicited emails.

The truth really is, and any longtime successful trader will tell you that there is one main key to trading success.  Certainly a good system or trading method is important, and investor education is also essential, however, the real key is more important than either the system or knowledge used.   The real key and most important element to successful trading truly is risk management.   How can I say this?   How could risk management be more important than the method or the system I use to trade?  If these are questions you are asking yourself, and then ask this one as well; even if you have a good system that works very well most of the time, what system removes all market risk?  What system works, no matter what, under any market condition and will never have a loss.  The answer is NONE, there is no such system. Since such a system does not exist, the only way to be successful in the long run is to manage the risk we take with each and every trade.  Said another way, the very best of systems can only put the probabilities in our favor, or minimize losses not eliminate then.  With each trade we take we should be able at know how much of our account is at risk if the market moves against us, due to anything that we could not predict.  My rule is to always use a stop loss and never risk more than 1 percent of your total account on any one trade.  Nobody likes to take a loss, and I am no different, however, even under volatile market conditions like we are in right now, by managing my risk per trade.  I adhere to the “slow and steady wins the race.” theory of investing and never “bet the farm on a sure deal” trade because there are no “sure” deals in life only the possibility of success if we manage our risk and thus protect our trading accounts.  Risk management will help us to save our accounts and futures from greed, and maybe even in times like these, be able to trade and get a good night’s sleep!

You can learn more about reducing your risk and making more profitable trades by watching this…

Yes, Markets can be and are Manipulated – So What?

As long as I can remember, even before I was actually interested in investing, there has always been a question of if the markets are manipulated, I believe that the real question is not “If” they are manipulated but “How Much” are they manipulated.

It really should be plain to even the most uninterested person that market manipulation is alive and well, it has been present since the markets were first created and it will be present until they end some day.  When traders and investors reach this simple conclusion and just see it as a fact and not a debatable question trading and investing can become much easier.  The reason for this is that once that question is off the table we can get to what we are really supposed to be doing which of course is our analysis and making the decisions with regard to how we handle our trading and investing.

Looking for evidence that there is market manipulation is a waste of time because some things are so obvious a rational person could not look past them.  The most recent example of course is the Facebook IPO where an analyst from the lead underwriter is accused of sending out information to only their biggest and best clients stating that the company and therefore the stock may not be worth what it is being offered for.  This so called insider information was not shared publicly so of course the investors with the knowledge may have had an unfair advantage.  My question is why would it surprise anyone that something like this would occur?   I believe that we should just expect it, accept it as a fact and move on.  If you want to enter the market enter the market, if you don’t want to enter the market don’t enter the market but get over the fact that someone out there may know more than you, know that they do.  As long as human beings are involved there will be corruption because everyone has their own agenda.  It is unfortunate that this is true but I believe it is human nature and we should just accept it as a fact and move on.

I heard a news story regarding this topic, there were comments in the story that the Facebook IPO was a chance for the general public to begin to trust the markets again and feel good that there is no manipulation or corruption so this incident is a setback and just reinforces it etc.  I’m really sorry but you would almost have to have your head in the sand to ever think that this type of thing does not go on in every market.  The federal government can manipulate the markets, large corporations can manipulate the markets and high ranking people in world governments or business can manipulate the markets.  Yesterday the former Greek Prime Minister stated that Greece leaving the European Union is a real possibility which made the US stock market and the EUR fall later in the trading day.  I’m not saying that this was manipulation but for one person, who is not even in power anymore, to be able to make statements that affect the markets as his comments did made me immediately think who took a short position before his statements that knew what he was going to say.  Maybe no one but it would be a quick way to make some money.

The bottom line is do not concern yourself with market manipulation; own it, know it exists and know that it always will.  Make your best trading decisions based on the information you have available at the time, get into the market, get back out and book your profit.  We cannot control what other people do but at the same time we shouldn’t be naïve and actually think that everyone in business and government is honorable; acknowledged it, accept it as a fact and move on and make some money and don’t worry about what other people do.  As long as our accounts grow let the regulators try to take care of any corruption that may exist which of course makes you wonder which side of the transactions they are on.

Price Action… Short And Long Term

Although this is a topic we have addressed in the past, I would like to cover it in a bit more detail in today’s article.  Like many things in life we want to find the source from where things are generated.  In the Forex world that source is the price action generated from buying and selling of the various currency pairs.  Price action is where we make our money.  It is the direct movement of the price that will cause us to either make or lose our money.  Because of this, it makes sense then that we would want to know as much about this topic as possible.

When we talk about the price action of a currency pair we are looking at the direction that the pair is moving.  Is the exchange rate moving up or is it moving down.  This movement will cause us to make or lose money depending upon how we are positioned in the trade.  If we are long the trade (buying) and the price goes up, we will make money.  If we are short the trade (selling) and the price goes down, we will make money.  The key is to find out where the price action is moving.  If we know where the price is going we can make money.

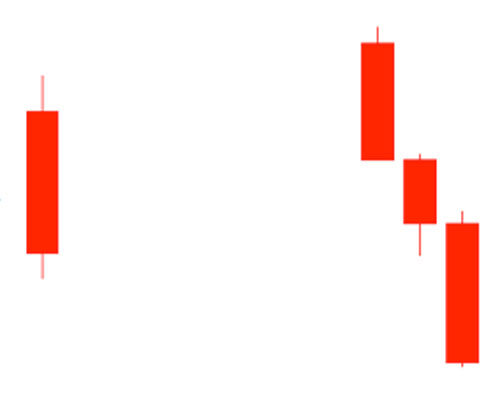
There are a few things that we can consider to help us make the decision about where the price is going to be moving.  We also need to consider the short term and long term price action of the pairs we are trading.  The short term price action can be identified by looking at the individual candlestick to see if the price action was strong to the up or down side.  If the candle is big, the price action is strong but if the candle is small, the price action is weak.  The long term price action can be identified by looking at multiple candlesticks put together.  As you see multiple candlesticks going up or down you will be able to tell if the long term price action is bullish or bearish.

The charts below show both the short term and long term price action on a chart.  The one on the left shows the short term price action.  In this example, there was a big move to the down side.  The one on the right shows the longer term price action as we are looking at multiple candlesticks moving down.


In addition, using a moving average can help us identify this long term price action by identifying if the moving average is going up or down.  Make sure you know how to evaluate the price action on the charts so you can gain confidence in your abilities to buy or sell the pairs you are trading.


Is There a Reason to Trade Right Now?

As long as I can remember, even before I was actually interested in investing, there has always been a question of if the markets are manipulated, I believe that the real question is not “If” they are manipulated but “How Much” are they manipulated.

It really should be plain to even the most uninterested person that market manipulation is alive and well, it has been present since the markets were first created and it will be present until they end some day.  When traders and investors reach this simple conclusion and just see it as a fact and not a debatable question trading and investing can become much easier.  The reason for this is that once that question is off the table we can get to what we are really supposed to be doing which of course is our analysis and making the decisions with regard to how we handle our trading and investing.

Looking for evidence that there is market manipulation is a waste of time because some things are so obvious a rational person could not look past them.  The most recent example of course is the Facebook IPO where an analyst from the lead underwriter is accused of sending out information to only their biggest and best clients stating that the company and therefore the stock may not be worth what it is being offered for.  This so called insider information was not shared publicly so of course the investors with the knowledge may have had an unfair advantage.  My question is why would it surprise anyone that something like this would occur?   I believe that we should just expect it, accept it as a fact and move on.  If you want to enter the market enter the market, if you don’t want to enter the market don’t enter the market but get over the fact that someone out there may know more than you, know that they do.  As long as human beings are involved there will be corruption because everyone has their own agenda.  It is unfortunate that this is true but I believe it is human nature and we should just accept it as a fact and move on.

I heard a news story regarding this topic, there were comments in the story that the Facebook IPO was a chance for the general public to begin to trust the markets again and feel good that there is no manipulation or corruption so this incident is a setback and just reinforces it etc.  I’m really sorry but you would almost have to have your head in the sand to ever think that this type of thing does not go on in every market.  The federal government can manipulate the markets, large corporations can manipulate the markets and high ranking people in world governments or business can manipulate the markets.  Yesterday the former Greek Prime Minister stated that Greece leaving the European Union is a real possibility which made the US stock market and the EUR fall later in the trading day.  I’m not saying that this was manipulation but for one person, who is not even in power anymore, to be able to make statements that affect the markets as his comments did made me immediately think who took a short position before his statements that knew what he was going to say.  Maybe no one but it would be a quick way to make some money.

The bottom line is do not concern yourself with market manipulation; own it, know it exists and know that it always will.  Make your best trading decisions based on the information you have available at the time, get into the market, get back out and book your profit.  We cannot control what other people do but at the same time we shouldn’t be naïve and actually think that everyone in business and government is honorable; acknowledged it, accept it as a fact and move on and make some money and don’t worry about what other people do.  As long as our accounts grow let the regulators try to take care of any corruption that may exist which of course makes you wonder which side of the transactions they are on.

Candlestick Basics… For Beginners AND Veterans

We have the 17th century Japanese rice traders to thank for the candlestick charts we often use today.   The power of the Japanese candlestick charts are often overshadowed by the use of various common technical indicators that a placed on the charts, for example: moving averages, Stochastics, MACD, etc.  However, the candlestick patterns themselves are a powerful trading tool, if we can recognize a few of the common candlestick patterns.  Traders can use candlestick patterns to better understand possible market sentiment.

What are Japanese Candlesticks and how are they formed?

The individual candlesticks are simply graphical representations of price movements for a given period of time. They are formed by the opening, high, low, and closing prices of stock.

If the opening price is above the closing price then a solid or “filled” candlestick is drawn. (Bearish Candle) If the closing price is above the opening price, then a “hollow” candlestick is drawn. (Bullish Candle) The “filled” or “hollow” portion of the candle is known as the candlestick body and is the difference between the open and close prices for a specific time frame.

The lines above and below the candle body are normally referred to as the wicks or shadows represent the high and low prices for that specific time frame. For example, see the diagram below,  if the price closes lower for the time frame a Bearish or “filled” candle is formed like on the left candle below and if the price closes higher then we have a Bullish or “hollow” candle like the candle on the right side below.

The Doji Pattern. One of the most popular candlestick patterns is the doji pattern. What is a doji?   When the individual stock, or any other market instrument for that matter, opens, moves up or down throughout the market day but closes at about the same price as the open. The lengths of the wicks (the high and low) can vary from short too long.  The doji pattern indicates indecision in market direction between buyers and sellers. The long legged doji consists of a doji with longer wicks and indicates stronger indecision between the buyers and sellers.

Traders can use the indecision indicated by the doji pattern to question the current trend. This can often trigger a price reversal in the opposite direction.

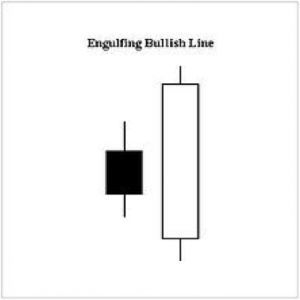
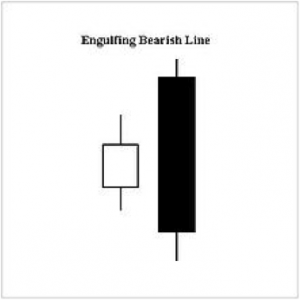
Engulfing Candlestick Pattern. Another one of the basic patterns indicating indecision and a potential direction change in the market is the Engulfing pattern. Examples of bullish and bearish engulfing candles follow:

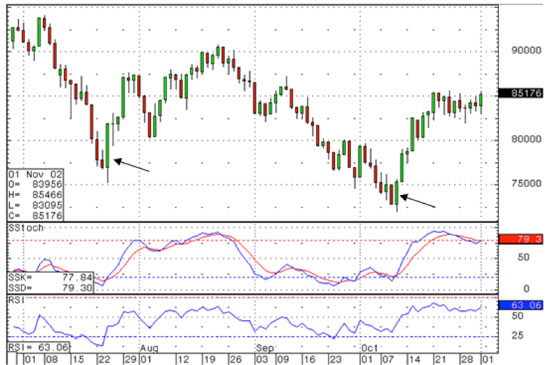
An engulfing candlestick pattern is a favorite pattern among candlestick traders because it is a good indicator of a possible market reversal.  The pattern consists of two separate candles. The first day is a narrow range candle that closes down for the day.  While the sellers are in control of the stock or ETF being charted because volatility is low, the sellers are not very aggressive.  The next day is a wider range candle that totally covers or fully “engulfs” the body of the previous day and closes near the top of the range.  In effect, the buyers have overwhelmed the sellers (indicates demand is greater than supply) Buyers may be ready to take control and push the issue higher.  Note in the Dow Jones industrial chart below, that the whole market sentiment reversed at the Bullish Engulfing candlestick formations.

A bearish engulfing pattern would be just the opposite, indicating a change to the downside.

These two popular candlestick patterns can be used to help identify indecisive market sentiment and potential changes in direction.

Traders Challenge:  Look back at your charts and see if you can identify these candlestick patterns and see how they may indicate indecision in the market and changes in market direction.

Currency Pairs… A Great Guide For Beginners & Veterans

When we speak of currency trading or trading the Foreign Exchange, we are referring to the simultaneous purchase of one currency and the sale of another. This relationship between these two currencies is what makes the price or quote of the pair go up or down. The currency pair is quoted as an exchange rate which compares the value of one currency to another. Currencies are all traded in pairs; for example, Euro/US Dollar (EUR/USD), US Dollar/Swiss Franc (USD/CHF), or any other two currencies. When you download a trading platform, you will see all the available currency pairs you can trade.

The best trading opportunities generally happen with “the majors” which are the most commonly traded and most liquid currency pairs. Nearly 85 percent of the daily transactions happen through the trading of the “Majors”, which include the US Dollar, Japanese Yen, Euro, British Pound, Swiss Franc, Canadian Dollar, and Australian Dollar. Major pairs are those crossed with the USD.

Here is a list of the currencies you may be dealing with:

USD = U.S. Dollar

EUR = Euro

GBP = British Pound “Sterling” or “Cable”

JPY = Japanese Yen

CHF = Swiss Franc “Swissie”

CAD = Canadian Dollar “Loonie”

AUD = Australian Dollar “Aussie”

NZD = New Zealand Dollar “Kiwi”


Some of the currency pairs that are be available are as follows:

EUR/USD = Euro vs U.S. Dollar (Euro)

USD/JPY = U.S. Dollar vs Japanese Yen (Yen)

USD/CHF = U.S. Dollar vs Swiss Franc (Swissie)

GBP/USD = British Pound vs U.S. Dollar (Sterling or Cable)

AUD/USD = Australian dollar vs U.S. Dollar (Aussie)

USD/CAD = U.S. Dollar vs Canadian Dollar (Loonie)

NZD/USD = New Zealand Dollar vs U.S. Dollar (Kiwi)

AUD/JPY = Australian Dollar vs Japanese Yen

EUR/JPY = Euro vs Japanese Yen

GBP/JPY = British Pound vs Japanese Yen

GBP/CHF = British Pound vs Swiss Franc

EUR/CHF = Euro vs Swiss Franc

EUR/GBP = Euro vs British Pound

The most common pairs are those crossed with the USD followed by the JPY, EUR, and GBP. These currency pairs tend to be the most liquid.

Now let’s talk about currency pair quotes. Each currency in a pair has a specific role.

Reading a foreign exchange quote can be quite simple if you remember two things:

1)   The first currency is the base currency

2)    The second currency is the quote currency

The base and quote order are determined by the International Standardization Organization or ISO.

The US dollar is the main currency in the Forex market and can be either the ‘base’ currency or the “quote” currency.  The major currency pairs with the USD in the base position are:  USD/JPY, USD/CHF, USD/CAD and the ones with them in the quote position are:  EUR/USD, GBP/USD and AUD/USD.

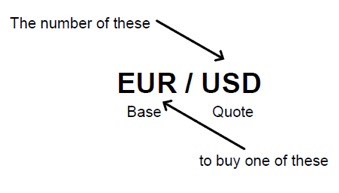
In order to read the quote you simply need to know which is the base and which is the quote currency.  For example, if we are looking at a price of 1.20000 for the EUR/USD pair, that means that it take $1.20 USD to buy 1 EUR.  If we are looking at the USD/CHF and the price is 1.2000 that means it take $1.20 CHF to buy 1 USD.  Regardless of how the pair is set up we will see the price on the charts move in the direction of the base currency.  What that means is if the base currency is getting stronger, the chart will be moving up and if it is getting weaker the price on the chart will be moving down.

Make sure you review the pairs you are trading and understand how to read the currency quotes.

When Is Gold Going To Break Out?

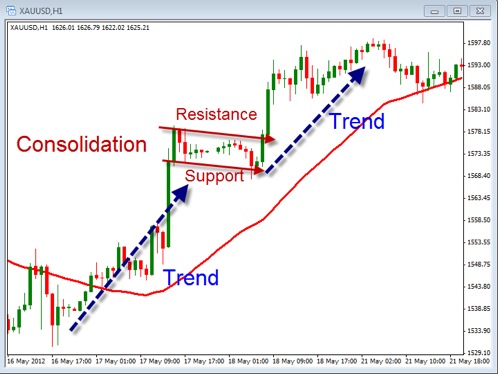
In today’s article we will discuss how we can use the trend of Gold along with support and resistance to identify potential areas to enter a trade.  Gold, like other trading instruments, tend to move in trends followed by areas of consolidation.  When the price is trending, the price is moving either up or down.  When price is consolidating, the price is moving to the side.  These areas of consolidation give us opportunity’s to enter the trade as price begins to move either back in the direction of the trend or the reverse direction of the trend.

As we look at the candlestick chart below you will notice the areas where the price is trending and areas where it is consolidating.  Since each one of these candles represent a 1 hour time period  the consolidation may last from a few hours to several hours.  During this time of consolidation the price action forms areas defined by support and resistance.  In the chart below we have outlined these areas of support and resistance with the horizontal lines.  These lines may not be exactly sideways but they do show that the trend has slowed.  These are the areas where we will look enter into a trade once a breakout occurs.  Also notice that once a breakout happens the price will either move back in the direction of the trend or reverse.  A breakout in the direction of the trend is considered a continuation break and one that breaks out in the opposite direction of the trend is considered a reversal break.

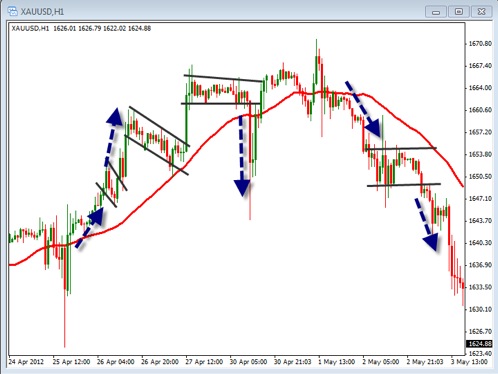
In this next chart you’ll notice we have identified both continuation breakouts and reversal breakouts.  These types of trending moves and consolidation moves can occur on any time period chart and can be traded in a similar fashion.  So you can look a 5 min chart or weekly charts and find the same type of setups.

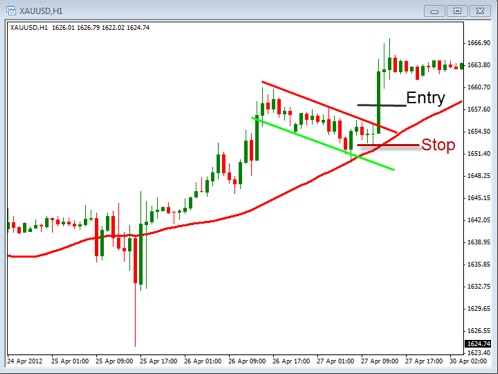
When trading breakouts we will look to enter the trade when the price confirms its movement outside of the consolidation area by closing either above the resistance line or below the support line.  Once a trade is entered a stop loss will simply be placed back inside the area of consolidation.  Many traders like trading these types of setups as they give a well defined area for both entering the trade and exiting the trade.  Targets can be set by identifying prior areas of swing highs or swing lows or looking at other areas of resistance or support.

Take some time to practice drawing trend lines and consolidation lines on your charts so you can better visualize these areas where you might find opportunity’s to trade.


Are You Diversifying Risk In Your ETF Trading?

Last week, I highlighted 3 keys to help us be successful traders.  The first key is to “Be Smart by Diversifying.”  However, we don’t want to diversify our positions, just for the sake of being in different positions, but the main objective is to DIVERSIFY OUR RISK.

By owning several different positions we spread out our risk but we need to careful to diversify our sectors as well.  If our portfolio is ONLY invested in major index ETF’s, for example, we may be in different issues but we may also be too heavily invested in a few highly correlated investments (which is great when they go in our favor, but not so good when they go against us.)  Well established portfolio management principles would teach us that we invest in several different sectors at any one time to spread our risk around and not be overly dependent on one or two issues in just one sector.  Also, with EFT’s one of my favorite investment vehicles, we have so many choices from the mundane (treasury bonds) to the exotic (emerging international market, like Vietnam) that we may be tempted to invest too much or our portfolio in areas that we have no experience in or that are too hyped or trendy.  With so many choices, and such ease of entry, it is easy to turn from smart investing to risking too much of our portfolio on speculative issues, without even realizing.

For the average ETF trader it would be wise to keep our choices less complicated. We can do this mainly by sticking to major issues within the major markets such as bonds, large to mid size caps, small caps and major international markets, major commodities, etc. depending on our risk tolerance.  Then, if you want to experiment with some more exotic or alternative picks, do so with a smaller part of our portfolio, say 10-20% at max. This would help us to  “Diversify Smartly.”

Are The Bears Coming To Town?

Hi Everybody, today we’re going to talk a little bit about the opposite of the Bullish Engulfing Pattern we went over last week. So, obviously, we’re going to look at the Bearish Engulfing Candlestick Pattern.

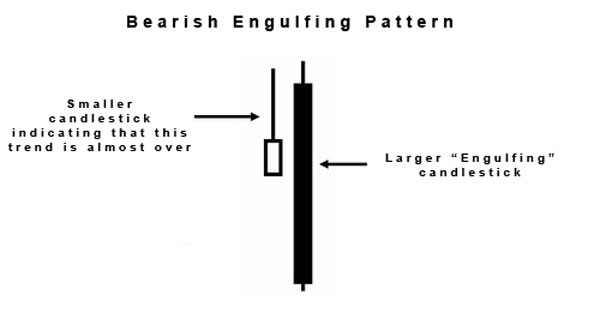
Now this candlestick pattern is also known commonly as a bearish reversal pattern, usually occurring at the top of an uptrend. The pattern consists of two candlesticks and can often look something like this:

Generally, you will see that the candle body of the first candle is fully “contained” within the body of the 2nd “engulfing” candlestick. That is what makes it an obvious “Bearish Engulfing” type pattern.

“Great, so what does this mean for us as traders?“ What this can mean is that the trend that has currently been going on may very well be quickly running out of steam. You see, the Bullish Engulfing Pattern often symbolizes an incredible change of sentiment by traders. This can happen from a bullish gap up at the open, to the large bearish candle body that closes at or near the low for the day.

At this point, you can be almost certain that the bears have overtaken bulls for the day, and possibly for the next few candles.

So in the end, when you see a pattern like that, it’s usually a safe bet that if one of your trading methods are telling you to go short at that point, you can bee even more confident that your next trade will go in the direction you hope.

“OK, the market’s likely on it’s way down… when do you sell exactly?” That is a common question I get from my students, and my answer is always to follow whatever trade parameters are dictated in the trading system you’re using. If you’re using a good one, then you’ll know exactly when to get in and when to get out. You have to stick to your trading plans folks!

But in general, there are few ways you can do it. If you’re the very aggressive type, you could sell at the end of the close of the bar on day 2. If you’re seeing a spike in volume as well, you can consider that as even more insurance that it’s going to move down.

If you’re a middle of the road type, you could wait an entire day after the Bearish Engulfing Pattern shows itself. That way you can be sure it was a true pattern, and not just a one-day anomaly.

And if you want to be extra careful, or if you’re new to trading patterns like this, then you could always wait to sell until you get an additional signal, like a price break below wherever the previous support point was. By doing this, you’ll have some serious assurance that this is indeed about to head south. Just remember, the longer you wait, the more profit opportunity you stand to miss out on, but in many cases, this isn’t necessarily a bad thing. It basically comes down to risk management, but that’s a topic for another day.

OK folks, that’s the Bearish Engulfing Pattern, and it is often considered to be one of the strongest candlestick reversal patterns. It’s worth keeping an eye open for it, and hopefully after today, you’ll have some idea of how to act if you see one.

Good Trading,
Bill Poulos