Technical Analysis of Gold & Silver (Tips inside)

Every time we begin our analysis of Gold or Silver we need to begin with looking at the charts.  No matter how much we want or hope for Gold or Silver to go up or down we won’t be able to move it on our own.  This means that we need to be able to evaluate the movement or potential movement based off of what we see happening on the charts.  If we begin hoping that something is going to happen we begin trading in the realm of fantasy.  This fantasy trading is no way to develop a consistent and deliberate way to trade.  Ultimately we will end up loosing our money to the markets.  So, if we cannot rely on hope or want, what can we rely on?  Well, the answer is that we need to base all of our analysis on the evidence that is presented on the charts.

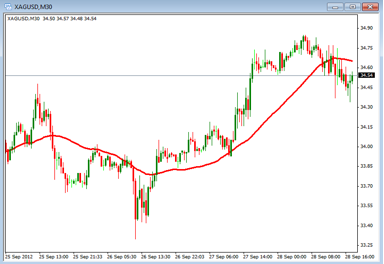
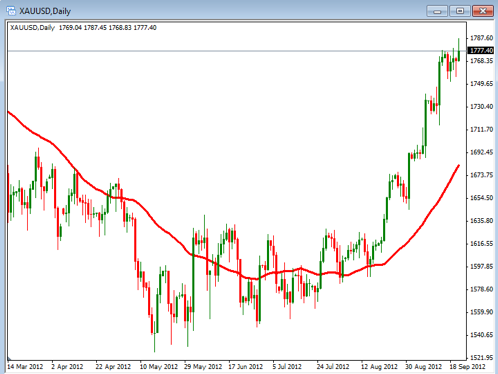
This chart evidence comes in the form of price action and any indicators that we may be using.  Remember, price action is the key.  If price is not moving then we cannot assume that it will move in any one direction.  We need to wait until we see it move prior to making any decision on trading.  Trading what we see and not what we think is the proper way to analyze our trades.  Let’s take a look at the two charts below.  The first one is Gold and the second one is Silver.

As we look to identify what is happening on this chart we need to first look at the Trend.  In this example we can clearly see what is going on.  Not only is the price moving up and making higher highs, but the 40 period Simple Moving Average is moving up while the price is above it.  So, the evidence that we see should direct us to the conclusion that the trend is up.  That means that we should only be buying Gold.  If you start adding your thoughts into the analysis, such as “it can’t go any higher”, then you are not trading the evidence.  In fact, you are trading counter to what the chart is showing us.  It may be true that it won’t go any higher, but we won’t know that until the chart shows us that it is now going down.  Remember, trade what you see.

The chart above is the 30 min. chart for Silver.  Notice that the chart was trending up but has recently moved below the 40 period Simple Moving Average, which has also turned down.  So, even though the trend was up, we now have enough evidence on the chart to tell us that the price should be considered bearish (at least for now).

In the end, we need to really know how to analyze a chart by focusing in on what we are actually seeing, not what we want to see.  By focusing in on the evidence we can begin to develop the confidence we need to become successful traders.  Take some time to practice analyzing the charts based on the evidence you see and write down your conclusion to what you are seeing.  Later go back and review it to see if you were analyzing it emotionally or if you were doing it properly.

Changing Forex Or Stock Brokers is Allowed

One of the most common questions I that I receive is around how to choose a good broker.  My opinion of brokers regardless of if they are strictly Forex brokers, strictly stock brokers or both is that they are all here to basically provide the same or similar things for their clients.  Clients typically want to trade through a safe and stable broker that provides quick and correct execution of orders, clean versatile and easy to read charts with an accurate datafeed provider and good customer service.  As long as a trading platform is user friendly and orders are executed correctly and efficiently the only real difference will be service.  In this regard I look at them the same way I look at banks; their products are all about the same so the only thing they really have to offer me is service.  If I cannot get the service I want from a broker I will change in a heartbeat.  I am not married to any broker they have to perform well for me or I will change.

Changing brokers seems to be a big deal for many traders which is not something that I have ever understood.  If you are purchasing a service in almost any other industry if the service is poor or does not meet expectations most people will be quick about changing companies to one that will provide the service level that they desire however my observation is that this is not the case with brokers.  I find this odd in the respect that dealing with our financial transactions may arguably be some of the most important transactions that we make.  I’m not sure why anyone would tolerate bad service from a broker however people do it all the time.

Changing online brokers is incredibly easy; actually changing away from any broker is incredibly easy so why aggravate yourself with a broker that does not meet your expectations when in a matter of a few days stock accounts can be transferred in their exact form with the same securities positions to a new broker.  Forex accounts are little more cumbersome in the respect that any open positions are usually closed and the full cash balance is liquidated.  It will take however long it takes the broker to issue the funds but even if it is a week or two getting away from a broker that is not doing their job is probably going to be worth the inconvenience in the long run.

Transferring away from a single use broker to one that can provide stock, Forex and options trading may be an excellent strategy for allot of reasons because diversifying across different markets will likely give the trader the opportunity to round out their portfolio easily moving money within the account for dedicated trading in the different available markets.

The way the markets act today trading in just one market can be very limiting and in some ways almost crippling to a portfolio when you consider that some will move sideways for extended periods of time making trading difficult at best.  Trading in a few of the major markets at all times will help to ensure that there is always the opportunity for a portfolio to grow on a consistent and regular basis.  Diversifying a portfolio among different markets can be one of the best and most efficient ways to reach most financial goals.

Plan Your Trading Work and Work Your Trading Plan

It doesn’t matter if you trade stocks, trade ETFs, or trade forex… I find that many traders trade by the “seat of their pants,” they may take a position when it just “feels” right, especially when the markets are moving quickly and they don’t want to be left behind. Trading without a specific trading plan can be dangerous to a trading account. Preparation for a trading session is a very important and essential element to a trading plan.  Many traders don’t even have a trading plan, or even a daily checklist. By contrast, many professionals will prepare for the market day even before the market opens.

A good trading plan can be broken down into three important parts:

First, the plan would naturally include a trading strategy or method.  Any good strategy should include market entry/ exit strategies depending on the markets traded and current market conditions (stocks, options, Forex, etc.) and the various market conditions.

Second, a trading plan should include a specific risk management rules with clear and understandable risk levels including position size calculations in order to control the risk with each and every position entered.

Thirdly, any good trading plan should include a regular and repeatable routine.  The more consistently a trader follows a set routine the more consistently will be the implementation of a good trading strategy.  Several traders have told me recently their biggest problem is not finding a good strategy, but implementing a consistent routine is their biggest challenge.  Once a routine is carried out consistently, trading success will become much more likely depending on the market strategy.

A routine is best written down as a check list so that it is simple and repeatable. Each individual trader needs to adapt a checklist to their individual needs. The checklist below is an outline that will get a new trader started. Modifications should be made depending on the trader preferences, type of trading (day trading, swing trading, position trading) and trader experience.

1. Check/read newsletters from paid/unpaid subscriptions from signal service, news, analysis, etc.

2. Check the day’s economic calendar for any scheduled reports and announcements for the day– This part covers the fundamental analysis. He will be checking the expected numbers against reports that will be publish during the day

3. Check the charts for price action, this is mainly for a trader who trades using technical analysis. Normally you will check to see if the prices have violated any support/resistance areas.  For technical trading, some the most popular indicators and tools used are:

a. Support/Resistance areas. (daily, week, month)

b. High/Low/Open/Close and candlestick patterns.

c. Stochastics, MACD, RSI, Momentum, Volume, or other indicators.

d. Fibanacci retracement levels.

4. Write down thoughts while going through checklist– This step is for the trader to write out trading ideas for the day, how much to risk , where he’ll be taking the position and where he’ll exit, and how large the position size he’s going to take.

5. After the trading session is over or after the trading day is complete it is important to document or journal each trade, with entry, exit, profit, loss, risk in trade, justification for entering, etc.

Once you have a good daily checklist that you are following, it is important to use it, just like the instruction on the shampoo bottle, Apply, “Rinse” and REPEAT!  It is important to follow the plan every trading day be very consistent with our written trading plan. This will help us be a much more consistent trader with hopefully more consistent results!

Traders Challenge:  If you don’t have one already, make a written trading plan with a simple, easy to use daily checklist, and keep a daily journal of all trades.

Automated Forex Trading & “Robots”… Do They Work?

I have a lot of forex students, and a lot of them are just starting in the forex world. They obviously have a lot of questions. Some of these questions are newbie questions like how do I place a trade, or which broker should I use… things like that. Then I have some established traders. People who have been trading forex for a while and then get bit with the “robot” bug.

Automated trading, robots, expert advisors… it’s all the same thing. It’s a “magical” system that has a set of parameters that determines when you should trade, what pairs to trade, and  how much to invest and then PLACES those trades for you… AUTOMATICALLY. Sounds great right? On the surface, this seems like a wonderful idea because it takes the guess work out. It takes the emotion out. It’s hands off and you can basically put your account on auto pilot and watch the millions of dollars roll into your account. Seems easy right? Too easy?

I’m here to tell you yes, it is too easy, and no, robots don’t work. At the end of the day, all they do is drain your account until it’s broke. Everyone out there looking for the holy grail system can just stop now. It doesn’t exist!

You see, the thing with any kind of automated trading is because it’s well, automated, it removes a traders #1 most powerful tool in the markets: DISCRETION.

Robots and expert advisors take away your ability to decide if it’s a good or bad time to be in the market. That basically puts you out there blind and totally and completely dependent on whoever’s logic or formulations that the software is based on. And guess what, 99.9% of the time, it’s based on a black box / hidden type of logic or algorithm. They almost never tell you what drives those signals to automatically buy or sell. And whatever formula that they made up might have worked last year, but will it work today? Tomorrow? Next week?

Now do the markets move in patterns? Yes. Yes they do, but it’s not that easy. Things move in patterns and trends, but you need the tools to read these things. You need a proper education, and a proper set of tools to understand and react to what’s going on in the market. You’re in control at that point. You’re the one with the power, in the driver’s seat, making decisions for yourself.

And trust me, with a proper education in forex trading and a few powerful methods under your belt, anyone of you can beat out a robot any day of the week.

Here’s an example: Let’s say you’re using an expert advisor or some type of automated trading system. Let’s say that it works pretty well. Heck, let’s say it works great. You’ve been making a lot of money with it and you’re very happy. So you just sit back and watch your trading account grow. Until the market makes a shift. It get’s volatile. This happens all the time. The market is fluid and dynamic… always moving. Or let’s say there’s an unexpected news announcement that moves the markets.  Poof. That EA that you were using all the sudden is killing your portfolio.

Now the outcome would be totally different if you were truly an independent trader, who took the time and effort to actually learn how to trade and invested the money in a few trustworthy methods. Methods that you can understand and control. Methods that once you learn, are yours for life. This kind of trader isn’t afraid of these kinds of shifts in the market. You know to stay clear of volatility and step back during news announcements and the like. You know how to react. You’re flexible. You’re a real bonafide trader!

Am I a fan of automated forex trading? Obviously, no. I’m not. I’m a fan of people thinking and trading for themselves and truly becoming independent traders. Trading can be difficult, but being prepared and putting your future in your own hands is what gives people the power to make a living in this business.

Skip the robot. Learn how to trade for your own… and watch your accounts grow.

Good Trading,

Bill Poulos

The Best Forex Signal? Trading What You See

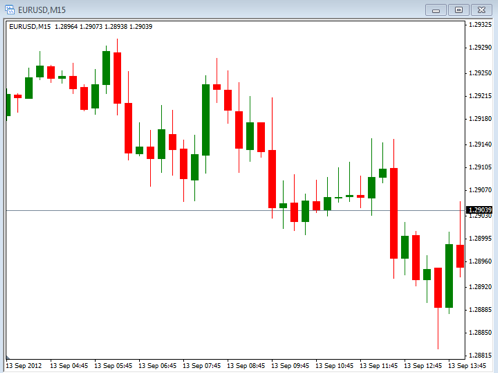
Today I want to spend a few minutes discussing the concept of “Trading What You See”.  This sounds like a fairly simple concept to understand but in reality can be very difficult to implement.  In the most simple terms, “Trading What You See” means that you only make your decisions upon the evidence seen on the charts, which can be as good as using the best forex signals.  Trading just what you see can be very difficult because we tend to place our own personal bias on our trades.  We look for what we want to see happen and ignore what is actually occurring on the charts.  We need to recognize that this can be a negative trait that we develop and look for ways to avoid it.  Take a look at the chart below and notice the trend that it is in.  Most would say that the trend is moving down.  Because of this bias we might be looking to short this as it triggers into a trade.

But, as we step back and take a larger look we notice that this is actually just a pull back within a longer term down trend.  So with the limited view of this single chart we are making the determination with only a small amount of information.  If we don’t realize that we need to see more, we may make the incorrect assumption that the trend is down.

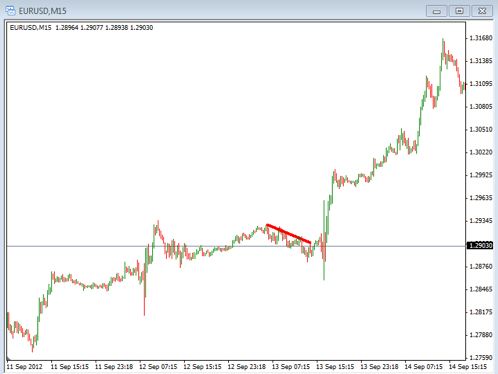
Now, take a look at the longer term chart and you will see that the trend looks a lot different.  In the chart below you can see the red line which indicates the area of the top chart.  As we look at the big picture we can see that the trend is clearly moving up.  If we don’t look at the full picture, or if we become to myopic in our view we can miss seeing what is really happening.

The other issue with “Trading What We See” is that once we enter a trade we do not want to be wrong so we end up holding positions regardless of what is actually happening on the charts.  Knowing that it is OK to be wrong can help us exit quicker when things go against our trade.  By looking at what is actually happening and making the decision to close a trade based off of the evidence we are doing the correct thing.  Unfortunately this is difficult for many traders.  Our emotions and psychological desire to be correct make us want to avoid what is actually happening on the charts and we start trading on our hopes and desires.

By learning how to trade what we see we can avoid the poor decision making that comes when we trade from our emotional side.  In order to avoid this problem we need to be able to recognize when we are beginning to trade off of hope instead of the evidence we see on the charts.  Again, this is easier said than done but something that you need to practice and learn to avoid.  By trading the evidence we are trading like the professionals do and are able to make the decisions based off of the facts.  Take time to review what you are doing and make sure you are not trading with your emotions.

Use A SMA To Find Hot Gold & Silver Trades

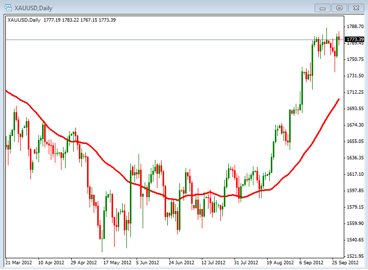
Today we are going to look at how a Moving Average can help us identify the trend of Gold or Silver.  In the chart below you will see the red line which is the 40 period Simple Moving Average.  Many traders will ask which moving average is the best to use and the answer to that is it really doesn’t matter as long as we are consistent with using the same one.  Getting to know one Moving Average is more important than trying to find the perfect Moving Average.  For our purpose today the 40 period Simple Moving Average will do just fine.  What we are looking for is something that will help us better see what the trend is doing.  In this chart above you can see both an up trend and a down trend.  By using the 40 period Simple Moving Average we can see the direction things are moving.  In order to use this to help us we need to define the trend based on the 40 SMA.

For example, if the Moving Average is going up and the price is above it, the trend can be considered up and if the Moving Average is going down and the price is below it, it is in a down trend.  This is a simple way to identify if the trend is moving up or down but it can also fool us during times when the trend is getting ready to change.  During this time of change you will see the price moving above and below the Moving Average frequently.  This time is frequently known as whipsaws or a choppy market.

So currently, as we evaluate what is going on with Gold we can see that the 40 period Simple Moving Average is moving up and the price is above it.  This would indicate that the trend is up.  While in the up trend we would be looking for opportunities to enter into long positions once our setup conditions are met.

Remember that just because the trend is moving up that it does not mean that we should just buy or that if it is down that we should just sell.  We need to make sure that we are still following our rules to enter into the position.  In fact, we need to consider how far it has moved so we don’t get in when it is sitting near the area of possible resistance.  In this case, we need to look at this distance and recognize that it may be near a point of retracement.  If the price is getting ready to change direction we need to be patient until the new trend has been established.

Either way we can use the 40 SMA to help us in our trade setups and knowing which way we should be trading.  Take some time to find a moving average that can help you in better determining the trend of both Gold and Silver.  Remember, the shorter time period the Moving Average the closer it will follow the price and the more false signals you may get.

Lastly, here’s a really good video that shows how moving averages work. It uses forex trading as an example, but the methodoligy is still the same.

What Are The Long & Short Term Effects Of QE3?

QE3 or Quantitative Easing 3 means that the Federal Reserve, the central bank of the US, will perform quantitative easing for the US economy.  Quantitative easing is a monetary policy that is used by central banks to stimulate a stagnate economy; it is typically used when other more conventional forms of stimulus will no longer work.   A normal monetary policy of expansion used by central banks to stimulate an economy will be accomplished when a central bank buys short term government bonds to decrease short term interest rates however when short term interest rates are at or near zero this is no longer an option.  At that point a more aggressive stimulus option is required.

A more aggressive monetary or stimulus policy, which is what we are currently seeing, occurs when a central bank purchases financial assets of commercial banks and private institutions with newly printed money.  In this case the Fed plans to buy mortgage-backed debt until the labor market outlook improves “substantially”.  Typically a central bank will buy and sell government bonds to control interest rates, inflation and the money supply so it is a little obvious that when a central bank prints new money to purchase existing assets there will be a glut of money in the system.

The short term effect of this generally speaking is good if nothing else than from a psychological standpoint.  The reason largely is because there is an opportunity for loosened credit.  This of course means that businesses will be able to borrow money easier expanding their operations which should result in higher production levels requiring more workers which will reduce the unemployment rate.  Individuals may also benefit from the opportunity to borrow funds easier which may mean that they will spend more money including the purchases of bigger ticket items.  The drawback to all of this is that the banks that receive the funds from the government easing must be willing to loan it out getting it into the hands of the people that can make the economy move.  There was little indication that they were willing to do this early on when the financial crisis first appeared though they were given billions of dollars, it will be interesting to see if this changes going forward.

The long term effect is far less rosy and in fact it could be considered rather bleak.  The classic definition of inflation is that there is too much money chasing too few goods which means the sellers of those goods can raise the prices to the level of equilibrium which is where they maximize the amount of profit they can earn at a given price while still being able to maintain a given level of sales volume.  When prices rise we generally end up with an increase in inflation which of course is not a good thing for consumers.  If money is printed and dumped into the market to filter into the economy at some point price will rise which will create an inflationary situation requiring the Federal Reserve to combat inflation.  The way that they combat inflation is to increase interest rates.  The reason that an increase in interest rates will help to reduce inflation is because as interest rates rise there will be a point in that rise where investors, both individuals and businesses, become satisfied with the prevailing interest rate meaning that they will put their cash in interest bearing investments which will typically pay a stated amount of interest such as money markets and CDs.  This pulls money away from various types of purchases, the stock market and other non fixed investments.  The result is that money is pulled out of the economy meaning that there is less money chasing the same number of goods which reduces the demand for the goods minimally requiring a need for prices to stabilize and possibly meaning that they need to reduce.  Rising interest rates are very good for the value of a nation’s currency, it is good for lenders but of course it is not good for borrowers and not necessarily good for equity investors.

There are a few obvious conclusions the least of which is that if you can refinance or restructure a long term debt now into a situation where your interest rate is fixed and reduced you will likely be far better off in the future when rates begin to rise.  Another thing to be mindful of is that we will likely see a short to intermediate term rise in the stock market but when inflation and interest rates rise the stock market will inevitably have to fall back.  This is one reason why investors in today’s’ world need to be very nimble and willing to pull the trigger to get themselves both into and out of the markets quickly.  The buy and hope strategy of the past may be gone but even worse it could lead to financial suicide.  Taking a common sense approach to managing investment dollars moving those dollars into and out of the markets as necessary at this point is almost the only course of action that really makes sense.


Should Traders Care About National Debt?

What is the big deal with the national debt?

First of all; what is the national debt?

The national debt is the debt owed by the federal government. This is separate from state or other municipal debts. The national debt is separate from the annual “deficit” which refers to the difference between government receipts and spending in a single year, that is, the increase of debt over a particular year.  Basically the national debt is the accumulation of all the annual budget deficits combined.

If the government doesn’t collect enough money through taxes and fees to cover the government obligations or it must “borrow” the shortfall.  This shortfall is referred to as the “budget deficit.”

What is the current national debt?

As of September 6th 2012 the United States national debt surpassed 16 Trillion dollars, with an annual shortfall or deficit exceeding 1 trillion per year for the last four years in a row.  There are several reasons for these high deficits including increased government spending in the recession of 2008 and 2009 and reduced tax receipts because of the same recession.  Typically during a recession, the tax receipts will decline because incomes are lower.  The combination of these two factors have lead to record deficits adding trillions to the national debt. To get a clearer picture of the national debt and it relationship to the economy, a useful statistic is the national debt stated in terms of the GDP as a percentage.  (GDP Gross Domestic Product is the total accumulation of all goods and services in the country.) This statistic is called the National Debt Level. It is useful as it provides a way to understand the size of the national debt as it relates to the overall production in the economy and provides a reasonable method of comparison from one period to another. The current GDP is  $15.6 trillion as of the first quarter 2012 (the latest figures available). That means the debt-to-GDP ratio or the national debt level is now 102%, up from 51% in 1988.  This is a dramatic increase of debt as a percentage of the economy but is not without precedent. After World War II the Debt level or national debt to GDP was 121%.

So we have had debt this high in the past, so now the question is what to do about it?  Well after WWII government spending was cut dramatically due to the war ending and the economic growth in the late 40’s and 50s was dramatic as well.

What can we do about it?

Doing the math would indicate that the only way to solve this problem will take a real debt plan.  The common sense approach to solving the debt problem seems to first reduce the current budget shortfalls by cutting the  deficit spending by getting our annual budget shortfall in line.  If we can reduce the budget shortfalls we can reduce the growth of the debt. Then if we could increase economic growth (which is lethargic at 1.7% to closer to 3%) so that GDP increases and the debt is then shrinking as a percentage of the economy.  There is no easy solution to such a huge problem. The worst thing we can do as a country, it seems, is just to ignore the problem until we have a much bigger debt crisis like other countries are experiencing.

Now will anyone have the political will to actually do this? I am not sure. But this is certain; solving this problem will allow us to maintain our status as the largest strongest country in the world, ignoring the problem will only lead to a weaker and weaker economy and country in the long run.

Trade Forex Flag Patterns With This Strategy…

Over the past several months we have discussed several types of price patterns involved in trading the Forex market.  Today I want to revisit one called the Flag Pattern and how we might trade forex with it on both the  short term and long term charts.

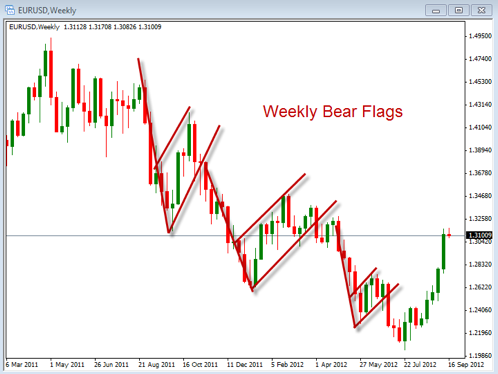
Take a look at this first chart below which is the weekly chart of the EURUSD.  When looking for price patterns on these longer term charts we are really trying to identify when the longer term trend is beginning to move back in the direction of the trend.  If we know that the price on the longer term chart is beginning to move we can use that information to trade on the shorter term charts.  In this chart there are 3 weekly bearish flag patterns that seen.  If you would have waited for the price to break out of the flag and then start trading on the short term you would have been trading at the best time.

Once the breakout occurs you would simply drop down to the daily or hourly charts to look for entries into the pair.

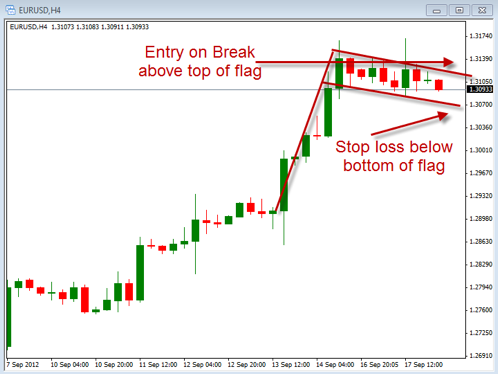
Now, take a look at the next chart.  This chart is the 4 hour chart and has identified 4 bullish flag patterns that all but the last one has broken out.  This last one is an example of what one looks like as it it being formed.

Now lets take a closer look at this last possible flag formation buy zooming in so we can look at the entry and exit points.  Noticed that we have pointed out an entry area which is located above the top part of the flag and an exit arrow which is below the flag.  There are various ways to place the stop losses but the main idea is to place it below the prior breakout point.  Some might prefer a tighter stop by placing it below the top of the flag.  Either way we are exiting once the breakout has failed and the price is beginning to move back through the flag.

Obama or Romney… Does It Really Matter?

This is about the upcoming election, the presidential election, and which party or which candidate will be the best for the stock market. Or another way to say it, what will happen to the stock market if Obama or Romney is elected come November? And I’ll tell you right off the bat that my view is because of factors external or unrelated to the election per se, I believe that the stock market has a high probability of peaking out right around the election time and then falling fairly hard from there well into 2013.

Now longer term, who wins the election will have a dramatic impact on the stock market, but depending on what they do. For me it’s not so much who wins the election, but rather who do you think is in the best position to reduce the size of government, get us on a glide path to a balanced budget, and start paying down the 16 trillion dollar deficit that is currently growing at a rate of over 1 trillion dollars a year? Now you don’t have to be very good at math to figure out that that kind of debt load is simply unsustainable. And if it is not addressed by the politicians now or after the election, or anytime after that, then what will happen is the dollar will continually be debased as a result, meaning it will continually lose value. That loss will accelerate the more and more we pile on the deficit. And what that’s going to do is undermine the stock market, and it certainly undermining the currency markets. We know it’s going on in Europe. Basically the same thing is going on here in the United States, except the U.S. dollar is reserve currency the world, so the United States can temporarily take on even more debt than can the countries of the European Union.

So as this currency debasement goes on, all currency, all western hard currencies are what I observe to be on the race to oblivion. And that can’t be good for any markets. That’s not good for the currency markets, it’s certainly not good for the stock market, because if the stock market is trading in dollars in the United States, and the dollar is being debased dramatically by these insane levels of debt, then who’s to say what the value of anything is? You see? So once you have a destabilized currency, you’re going to have a destabilized stock market.

So if you believe the Democrats are in the best position to manage our way out of this debt crisis and they win the election, then you can expect the stock market to recover in 2013 and move on up. If you think the Republicans on the other hand are in the best position to manage our way out of this debt crisis, then if they get elected, you can expect I think, the market to move on up later in 2013. Not initially but I think initially it’s going to fall regardless of who gets elected.

Now if whatever party gets elected, whatever candidate gets elected, if they do not effectively manage the debt crisis, then look out below. No one can predict what will happen or exactly how it will happen, but it will not be pretty. It will not end in a pretty way and it will not end in a way that anyone will like. And all you have to do is go back in history and look at what’s happened to currencies and markets going all the way back to the Roman Empire to see what’s happening here all over again. So we really need to be serious about addressing the debt picture politically. If so, there are better days ahead, better markets ahead. If not, I’m afraid we’re not going to like the outcome.

Last point: in the face of all that uncertainty I believe the best course of action when it comes to investing or trading is to learn how to trade in a disciplined nimble fashion. Events are occurring and unfolding at such a rapid pace that used to take years and months in the way of market trends to develop and play out now takes weeks and days. Things are happening so rapidly and so all of this is so unpredictable. The way to protect yourself and the way to even profit in the face of all this uncertainty is to learn how to become a disciplined nimble trader. It’s not that difficult, but it requires effort. It requires focus. And if you’re willing to instead of watching television for 30 minutes each evening, block out 30 minutes, block out an hour, learn how to trade. And that way you go from wondering what will happen to being in a position of control no matter what happens.