The 3 “R’s” Of Trading Success (Part 2)

Today, I would like to continue with the second part of the Three R’s of “Real” Trading Success.  To review, the first “R” is finding a trading routine that is both productive and practical.  This needs to be a routine that you can implement and maintain over the long term . Every trader is a little different and has a different set of circumstances than another, so it is important to be very practical in setting up a routine that works for you.

The second “R” of “REAL” success is to develop a system with RULES that are well defined.  A successful system will have well defined set-up rules, entry rules, and trade management rules and exit rules.  In other words your system should be clear enough to identify setups and easy enough to execute. Before you ever place a trade, you should clearly be able to identify, clarify and justify your trade with clear entry and exit rules.  No matter what instruments you trade, be it stocks, options, futures or forex, or whether you are a longer term position trader, a swing trader or a short term scalper, without clear executable rules to follow you find it very difficult to find long term success.

The rules should be easy to describe and repeatable, so that you can back test the results on past data.  Now this will not guarantee the same success into the future, but back testing over a period of time will allow you to become more confident in how the system works in a variety of different market conditions. For example, how the system works if the market is trending higher, trending lower, or the market is range bound and is moving sideways. The more we can test the system, the more confident we will become and the more we can rely on certain outcomes.

From a trading psychology standpoint, if we have clear rules that we can follow and test and become more confident in, we will be able to be more patient when in a trade to give it enough time allowing the trade to develop to a profit target or we will be able to recognize when a trade has failed and therefore be will be easier to cut our losses and move on to a more profitable trade. In other words we become significantly less fearful about our trading in general and hopefully we can become much more successful as a trader instead of the “fly by the seat” type of trader, who maybe have some successful trades, but may not be clear as to “WHY” a trade worked out; was it the system, or was it just “dumb luck?”

So the bottom line is to have clear Rules and then to follow those Rules so that we can identify trades, test our trades and execute our trades with the confidence to know how and when we are going to exit each trade.

Along with following a specific Trading Routine, the next important thing is to have specific trading rules for trade entry and trade exit, so that we can understand how our trades and making money and how we can repeat that success.

Traders Challenge:

If you don’t have a system with clear setup, entry, and exit rules; GET ONE that does!

If your trading system has good rules; FOLLOW THEM!

Risk To Reward Ratios For Trading Forex

Hi everybody,

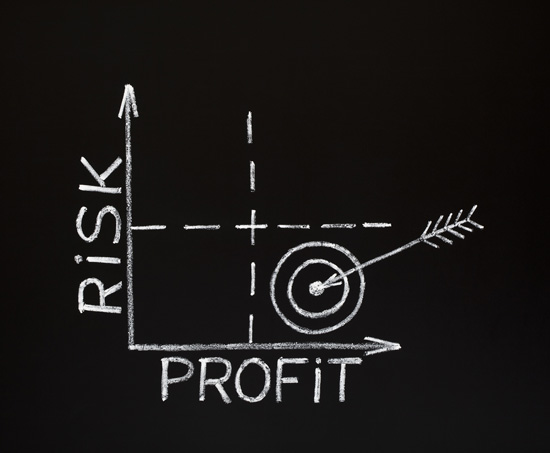
Bill Poulos here again and I wanted to touch base with you on a very often misunderstood topic: Risk To Reward Ratios. And this isn’t just for forex trading. This also applies to stock trading, ETF trading, or even options. Knowing how what your risk to reward ratio before you get into the trade is an important, but being hard set on that ratio at all times is not necessarily the best way to go about it.

Now from what I gather, the bulk of traders out there tout a profit loss ratio approximately in the 2 to 1 or 3 to 1 ratios. Now these ratios may work fine for most people, but the initial risk to reward ratio can often be misleading. What is more important to note here is the INITIAL risk to reward ratio vs. the EXPECTED risk to reward ratio. So a 3 to 1 initial ratio kind of trading methods would probably win 33% of the time, which  means that the EXPECTED ratio is more like 1.5 to 1 This is the number we need to look more closely at.

For example, in my Forex Profit Multiplier system, I aim to win 55% of the time. So what does that mean? It means that the initial reward to risk ratio of 1 to 1 equates to an EXPECTED ratio of 2 to 1.

So it’s very important to concentrate on “expected” ratios. I mean, when you get into a trade, you are expecting it to be a winner, so you need to plan that way.

Now don’t get me wrong, I’m not saying we should be reckless, and you of course always need to keep your protective stops in place, but at the end of the day, you want to keep these ratios somewhat dynamic and have the knowledge required to change them as the trade progresses. As the trade moves in your favor, you can move those stops up in a methodical way to remove risk while you’re in the trade. Eventually, if you picked a trade that was going with the trend, you will quickly be in a 0 risk situation which is where every good trader wants to be.

So those two things can end up being big game changers for you as your trade forex: Concentrate on expected risk to reward ratios, and don’t be afraid to move your stops WITH the trade.

Here’s another take on risk to reward ratios:


Let’s Get Back To Forex Trading Basics

Sometimes the best thing to do when the markets get tough is to return back to the basics of good forex trading.  When we talk about the basics we are referring to those things that are key in identifying good trading opportunities regardless of what you are trading.  It is kind of like the key elements of having good form when shooting a basketball or a good stance when batting.  These basics in trading are the key elements that can make or break a good trader.  In identifying these basics we will always refer back to the idea of looking for the trends.  So, today we are going to look at what trends are and what makes a good trend in order to apply it to our trading.

The first thing we will look at is – what is a trend?  A trend in the most simple term is the “direction” that the price is moving.  This direction is usually defined as up, down or sideways.  Now this may be very simplistic in it’s definition but it does give us a general visual as to the direction that a price is moving.  The importance of knowing this is that the price will usually continue to follow the direction that the trend is going.  If we know that the trend is moving up we will want to look for trading opportunities that will allow this trend to help us with our trades.  Of course we all know that the trend will stop at some point so we will want to be able to identify when this may be happening.

In the most basic terms this is what we want to be able to  know:

  1. If the trend is up, you want to buy.
  2. If the tend is down, you want to sell.
  3. If the trend is sideways, you want to wait.

Again, this may be oversimplifying things but it does give us the basic idea of what we need to be looking for with the trends.

So, now that we how to trade the trend we now need to know how to define the trend.  As we refer back to the basics of trend we can use this definition:

  1. Up trend = Higher highs and higher lows
  2. Down trend = Lower lows and lower highs
  3. Sideways trend = Unequal in highs and lows

By using price action as the way to determine the trend we are relying on the most important aspect of charts – the price.  As the price is moving up or down we can visually determine the direction that the trend is moving.

Understanding how to determine the trend, then how to trade the trend is one of the most important and basic concept of successful trading.  As you learn to look at a chart and determine it’s trend you will know if you should be buying or selling the pair.  As you buy or sell in the direction of the trend you will be placing yourself in the best possible situation to profit from your trading.  Take some time to review how you are determining the trend to make sure you are trading it the right direction.

Could The Momentum Of Metals Be Slowing?

We got some interesting news lately in the prescious metals marekts that makes many traders think that there maybe a slight slowing to metals. Here are the numbers:

Bullion rallied to an 11-month peak above $1,795 an ounce in early October after the Federal Reserve’s latest program of purchasing mortgage-backed debt kicked up  inflation talk again (always good for metals traders!). Bus since that relatively good news broke, we seem to see a slight change in momentum with weak global economic data helping send prices below $1,700 this week, when U.S. durable goods data showed the first cuts in investment in more than a year by timid businesses.

Year-to-date, gold is up nearly 10 percent, on track to grow for a 12th years straight. Bullion’s gains in the last several years have largely been powered by economic uncertainty related to the Fed’s bond-buying to stimulate growth.Platinum group metals are on track to fall more than 3 percent this week as economic worries and easing supply fears from top producer South Africa triggered heavy selling. Platinum also dropped 1.38 percent to $1,546.25 an ounce and palladium fell 1.28 percent to $594.0 an ounce.

So gold seems to still be going in the right direction but the other metals do show signs of slowing.

Is this good? Is this bad? Well, if you’re a trader, it won’t matter one bit. What we might be seeing here is a little bit of a volatility and traders love volatility. You see, as prescious metals traders, we’re not trying to find bottoms and tops, we’re trying to find trends and pull profits our of the trends up or down… or both! At the end of the day, while it’s good to keep your eye on the market moves and market news, the only thing you should really be following is your trading plan and your trading methods.

Trading Forex During News Events (Multiple Time Frames)

I recently got this question from one of our students and I wanted to share it with you along with how I answered it. And if you’re a forex trader, stock trader or if you trade ETFs, I think you’ll find it to be a helpful bit of “Q&A” that can have a direct impact on your trading.

Here’s the question:

“Hi, what do I do if my trading system doesn’t account for news events? And I trade multiple time frames and various markets all over the world, does this come into play as well?”

This is a great question and is a situation that I hear a lot about. The good news is, if you’re using a good forex trading system, then news events shouldn’t be an issue. Here was my response:

“There really is no way to predict how the market will correct itself after the actual news data is released for any given economic report versus the estimates that are published ahead of the announcement. The market will correct itself based on the difference between the actual news and the estimate of the news at the time of the announcement.  I believe it would be best to stand aside for 30 minutes or so up until the time of the announcement if you do not have an open position at the time.

With regard to the various sessions that occur around the world there is no reason to take them into account because this will happen naturally.  During the more active trading sessions there will be more signals produced due to the added liquidity, volatility and volume of the market at the time.  During the quieter times in the market there is typically less movement to the price action, less liquidity, less volatility and less volume so there will be fewer signals that are produced.”

So you see, working around news events and multiple time frames is really not an issue IF you’re using a good trading system.

The Three R’s of Trading Success

This is going to be part 1 of a 3-part series I’m putting together, so stay tuned next week for part 2.  And don’t worry, whether you are trading stocks, options, futures or forex, there are some key elements that I have come to understand that all successful traders need to follow.  I have over time tried to distill these successful elements or “habits” into three main categories. These are first, to have a consistent trading ROUTINE, Second is to have specific entry and exit RULES and then to follow them.  Third, is to maintain specific RISK management rules. I refer to these habits of success as the three R’s of successful trading. The most successful traders I know incorporate all three of these elements into their trading habits.

Today, I will discuss the first of these three trading elements, which is to establish a consistent trading ROUTINE.   In order to trade successfully, not only is it important to identify a trading routine, but also a routine that is best for your individual circumstances. Because, whatever routine you decide on, it has to be one that you can continue to follow for the long run. For example, if you are have a system that works well trading forex at the London open buy you reside in the United States, you will need to arrange your schedule so that you are consistently available to trade very early in the morning as the  London forex markets open at 2am eastern time.  If staying up that late is a challenge for you, then it may be more practical to adjust your trading system and routine to trade the Forex on the US open which is at 8am Eastern.  The key to implementing a successful routine is to make it practical so we can follow through and be consistent with it.

Another important key to deciding on a routine is what style of trading you like.  For example, if you are planning on trading Stocks or ETFs on a daily position basis you will need far less time than if you want to “scalp” trade the forex market which requires an exclusive block of time at a set time per day every trading day.  So, understanding what kind of trading style and what markets you are interested in the long run will help determine what routine you eventually decide is the best for you.

So, like the “chicken and the egg” I am not sure what comes first, the system or the routine, but one thing is for sure, without a consistent routine regardless of how good your system is, the chances for trading success is greatly diminished.   In other words, you could have a best system around, but without a consistent daily trading routine, you will have trouble implementing that system.  Like anything worthwhile in life, consistent effort and energy is required to make it happen

To me the most important thing about a trading routine is to make sure that whatever you decide to do, pick something you can stick with.  To sum up, it is very important to your overall trading success to have a specific trading routine and STICK WITH IT!

Forex Trading Indicator Cheat Sheet

Hi everybody,

I was just working with a new student this week who was asking a lot of questions about indicators. So to answer all his questions, I put together a little “cheat sheet” of indicators and a very basic description of what they do. Now, keep in mind that this is just a “cheat sheet” and just scratches the surface of what these indicators do. They were all invented by some pretty smart people, and an entire book could probably be written about each and every one of them… but I’m not much of a book writer. So a VERY short synopsis is what you get.

I also want to chime in with my own two cents: Most of these indicators are NOT needed. I personally use a few of these in my trading methods, but what I do is I use very common indicators like a few of these, and I use them in very UNCOMMON ways. But you’ll have to check out a few of my trading systems to fully understand what I’m talking about. But at the end of the day, the truth is you don’t need every one of these indicators. One or two could be helpful if that’s what your trading method and trading tactics call for, but rarely do you need to use all of them at the same time. I often see many of my students suffering form indicator overload. I take a look at their trading platform and it looks like a video game gone wrong. I’m a big advocate of keeping things simple and uncomplicated. There’s no magic trick to being successful trading forex, and adding a bunch of indicators is not going to get you the results you want. Using a method and staying disciplined with it is what brings you success. But enough lecturing from me, here are your indicators and what they do:

  • Bollinger Bands: These are lines that are drawn on your chart and act as little support and resistance level indicators. They are more or less volatility indicators but can be useful to those who are working off of support and resistance levels and have a hard time spotting them.
  • MACAD: This is a two line indicator that uses two moving averages (fast and slow) and helps spot trends. The only issue I have with this one is it tends to have quite a bit of lag because of the two averages, so it’s more historical than anything.
  • Parabolic SAR: This is an indicator that spots trend reversals (SAR = Stop and reversal) and is pretty easy to follow because it shows you only bullish or bearish goals. When the dots are above a candle, sell, if they’re below, then buy. Simple as that.
  • Stochastic: Now this is an indicator I end up using in a lot of my methods and I think it works pretty well. What it does is it tells you when there are cases of something being overbought or oversold.
  • RSI: RSI stands for Relative Strength Index, and is very similar to stochastic. Same information, I prefer the stochastic.
  • ADX: Average Directional Index. This is another trend spotting indicator and can be very helpful if you know how to use it. What’s good about the ADX is it tells you the “strength” of a trend which can help validate a trade you’re thinking about entering.
  • IKH: This stands for Ichimoku Kinko Hyo and is a “price momentum” indicator.

There are many many more indicators, but that’s all I have time for today. Again, if you’re interested in learning more about any of them, I highly recommend getting a book or at least doing some web searches as there is a LOT to know about all of these. But at least now you’ll be able to hold your own at the next trader’s cocktail party.

Good Trading!

Trade Forex More Profitably Using The Stochastic Indicator

Today I want to spend a few minutes discussing a commonly used indicator and how to apply it to the charts we are forex trading with.  First of all, any indicator is technically a lagging indicator and therefore only showing us what the price has done in the past.  It cannot tell us what is going to happen in the future, so don’t expect it to be correct every time.  About the best we can hope for is that the indicator will continue to follow the patterns it creates going forward.  With that being said, there are several things that happen with the Stochastic indicator that can be beneficial to our charting.

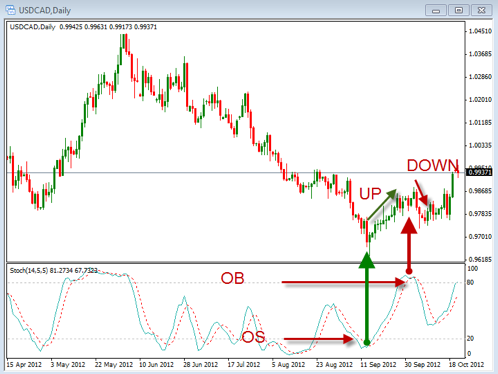
The basic idea behind the stochastic indicator is that it can show us when the price is overbought or when it is oversold.  When price is in the overbought area it has been moving up and when it is in the oversold area it has been moving down.  This part is fairly easy to understand but the hard part is to determine what might happen once they reach these areas.  In the chart below you can see an example of when the price move into and out of these overbought and oversold areas.

Notice that the Stochastic indicator will move into and out of these areas of overbought and oversold which are indicated by the 80 and 20 levels.  If the price is above the 80 it will be considered overbought and if it is below 20 it is considered oversold.  You can see the green  up arrow that show when the price is coming out of the oversold area and is where the price begins to move up.  The red up arrow shows the indicator in the overbought area and as it comes out of it you can see the price move down.  You can get fooled by this if you just buy or sell once the indicator moves into these over extended areas because the price can remain overbought or oversold for an extended time frame.  In that case if the price is overbought you may see the price continue to move up.  The key is to look at the indicator move out of these areas which may be the sign that things are getting ready to reverse.

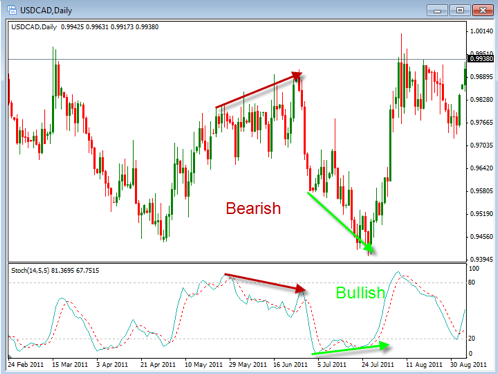
Another reason to considered using the Stochastic indicator is to help you identify areas of divergence.  These are areas where the indicator is showing strength or weakness opposite of what the price is showing.  These are points where the price may be getting ready to reverse.  In the chart below you can see some examples of these divergences.


In the above chart you can see two examples, one of a bullish divergence and the other of a bearish divergence.  The Bearish divergence is in red and you can see that the price is making higher highs while the stochastic indicator is making lower highs.  This would indicate that the price is showing weakness as it is moving higher and may lead to a down move.  The green bullish arrows show the price making lower lows while the stochastic indicator is making higher lows.  This would suggest that the down move is becoming weaker and may begin to reverse.  This does not guarantee that the price will move as show but it does give us a heads up as to the possible direction.

So, stochastics is a good indicator that can help identify some possible direction changes.  We just need to remember that the price is more important than the indicator so we always wait for the price to confirm movement.

Is Now A Good Time To Trade Gold Or Silver?

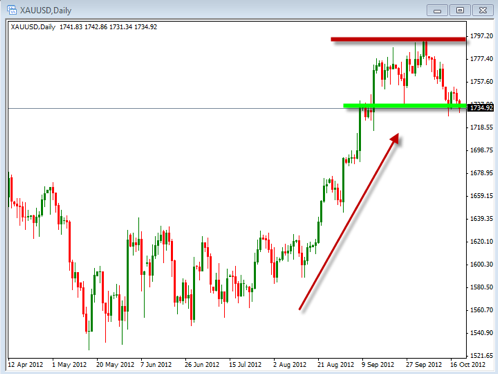
Before you trade gold or silver, you need to know what’s going on in the markets, so…. Let’s take a look at the daily charts of both gold and silver.  When looking at the charts, any charts, we want to identify two primary things.  The first is the trend and the second support or resistance.  Once you have identified these two things you can then start to make determinations as to buying or selling of gold or silver.

The trend is the first thing to look for as you begin to analyze the chart you are looking at.  Many traders look at the trend to tell them where price is going.  The problem with that is that it really is only telling you where the price has been. There is no guarantee that the price will continue moving in that trend.  So the reason why we look at the trend is that it gives us an idea that if the price has been moving in one direction that it is most likely to continue to move in that direction.  We need to remember we are looking at the past history to help us decide what may happen in the future but that it is not for sure.  In the case of Gold in the chart above, the trend looks to be moving up.  This would suggest that we should be looking to buy Gold at the appropriate times.  Those times when our trading rules give us the setup conditions we need to enter the trade.

The second thing we will identify is where support or resistance is located.  This too has issues as there is no guarantee that the price will actually stop at those historical levels.  It does however give us a gauge as to where things may encounter a barrier to price movement.  You can see the areas where we might see this slowing of price action on the chart above.  With the trend being in an overall up trend, we would want to see the price near support as that is the area where the price will tend to want to bounce up off of.  This, in combination with the trend can give us a good area to look for buying opportunities.

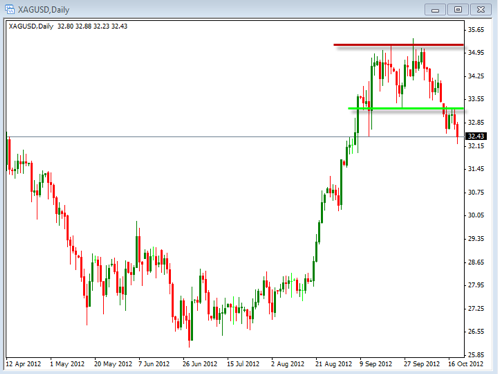
The chart above is the daily chart for Silver.  You should see that the overall trend seems to be similar to Gold.  You should also see that the areas of support and resistance are similar.  I do want to point out the double top that formed more clearly on this chart than on the chart for Gold.  I have drawn in the M pattern that you see on a double top pattern.  You will also notice that it has clearly confirmed a break to the down side as it has closed and tested the support area where it broke down from.  One important thing to consider when looking at the trend of a chart is to identify potential signs of weakness or reversal.  Here with the double top, which is a reversal pattern, you would need to consider the possibility that the trend is starting to reverse.  This would make us less likely to want to buy this chart.

In the end, you need to be able to tell what is happening on the charts currently, not only on what they have done in the past.  Currently with both of these charts we need to consider the fact that they are showing signs of topping and may be slowing the strong moves we have seen the last couple of months.

Lastly, I wanted to answer a quick question that I got from one of my students today. They were asking “why should they trade gold or silver?” There are many many answers to this, but I wanted to share a quick video with you of a gentleman’s view on why he trades gold and silver. I don’t agree with what he’s saying 100%, but he does make some good points.

How Average True Range (ATR) Can Help Forex Traders

Hi everybody,

Today, I wanted to talk to you about an indicator that I like a lot. It’s a common indicator, and one everyone should know about. It’s called Average True Range or often shortened to ATR. Now in many of my forex trading courses, I use the ATR, but I often use them in very unusual ways. So I’m not going to explain that to you today (If you’re really interested, check out some of my forex course), but I will give you just a brief overview of what it is, how it’s used, and how you might be able to apply it to your daily trading efforts.

The Average True Range is simply a technical analysis indicator developed by J. Welles Wilder. As such, the indicator does not provide an indication of price trend, simply the degree of price movements. Now this is something that a technical analysis trader would be interested in as opposed to someone who’s more interested in trading on fundamental analysis. And the key word here is “movement.” I say movement is important because this is an indicator that measures volatility. Volatility is a HUGE factor in forex trading. It can be a great thing when it moves the markets in a predictable fashion, and it can be a bad thing too. Sometimes the volatility can be too extreme where you shouldn’t be trading. This will all seem like old news to veteran traders, and after a while even beginning traders can get a sense of the level of volitility just by looking at a candlestick chart. BUT it’s always a good idea to add an ATR to your charts as it’ll give you another set of “eyes” to see how the markets are moving. Plus, ATR is often a key indicator that many traders use to know when to get in or out of a trade.

Another benefit of adding Average True Range to your charts is you’re able to customize how far it looks back. This is huge as it makes it a really helpful indicator no matter if you trade tick charts, 5 minute bars, 4-hour charts, or even end of day trading with daily bars. The ATR can easily be customized to your trading style.

So there’s a short introduction to ATR. It’s one of my favorite indicators and something that every trader should at least consider adding to their arsenal of trading tools.

Good Trading,

Bill Poulos


PS: Here’s a somewhat interesting video that talks about ATR… It’s a little old, but still, it’s worth a look: