The Sequester Shell Game

This Friday, March 1st, is a day that will live in infamy. If you listen to the President, trying to frighten everybody about the consequences of the sequester going into effect. Of course the sequester is the agreement the President made more than a year ago with the Congress to automatically cut spending across the board if no other agreement was reached. Predictably, as the politicians operate, they did not come to any other agreement.  This sequester, therefore will in all probability go into effect this Friday.

But is the situation as dire as the President indicates?  To that I would say, “Absolutely not”. The dire situation is not what the President’s talking about. It’s not the sequester. The dire situation is the spending. It’s completely out of control. I think most of you know that by now. The annual deficit is now over a trillion dollars. It’s been a trillion dollars or more for the last several years. The total national debt is now up to $16.5 Trillion, and we’re adding $85 Billion a month! So that equates to one trillion dollars a year more debt on top of the $16.5 we already have. Now that’s a dire situation!

Now the sequester is about cutting $85 Billion, not in a very intelligent way for sure, but $85 Billion across the board in 2013, which would represent about 2.5 percent cut in spending. That’s it. Now do you think there might be 2.5 percent of inefficiency in the government? Or 2.5 percent of waste in the government? Or 2.5 percent of fraud in the government? I would say absolutely! Far more than that.

So these cuts do not have to be such that they interrupt services or cause harm to anybody. It’s all a bunch of Washington speak. Furthermore, what you don’t know, or at least they don’t want you to know, is these cuts are not absolute cuts. They are simply reductions in the increased rate of spending. So if they were spending $10,000, you would think they would be talking about cutting 2.5 percent of that, or $250, back to $9,750. They are not! They are on a track to increase the $10,000 by 3 percent or so. That’s $10,300. So the sequester in my little example would cut back spending from not $10,000, but from the increase of $10,300 back to $10,050. After the sequester goes into effect, the spending in absolute dollars will still go up.

So these guys are leading us down the wrong path. I think they know it. I don’t think they care. So why is all this important? Well, if you’re an investor or a trader in the markets, you can’t be steered in my opinion by these events, and certainly not by the hyperbole from the President or from the House Speaker, or by least of all the media. This is true especially if you hope to have an edge when trading the markets. So one of the keys to successful trading is to ask the question, “what is your edge?” If you don’t know what it is, you don’t have one. So you have no business trading the markets.

You have to know what your edge is. An edge is a method or process, a system that gives you favorable odds when making your trades. So if you do have such an edge, you simply trade it, regardless of what’s going on in the circus in Washington. When you do, with discipline over a series of trades, you’ll come out a net winner. It’s that simple. So don’t be dissuaded from your discipline, your method by all this nonsense. Keep cool heads, stay disciplined and you’ll do just

Everybody Focuses On Entries, But What About Exits?

With the market up and down the last week due to worries and speculation concerning the budget “sequestration” trade management is very important do keep our exposure to risk at a minimum.  In fact, when learning to trade many traders are so focused on how and when to get into the market, they fail to realize that exiting the trade is just as, if not more important to the success of the trade.

Traders without good exit procedures in place are really just hoping or gambling. It’s true that some gamblers come out winners occasionally however; the casinos are evidence enough that most are losers. The decision to get involved in trading should not be based on a desire to gamble. If you want to gamble, you will have a lot more fun going to Las Vegas.
Defining your exit strategy

Successful traders plan out their exits by setting initial stop-loss and take-profit points. Stop-loss and take profit points represent two key ways in which you can plan your exits.

On the other hand, unsuccessful traders often enter a trade without having a good idea of at what points they will exit the trade at a profit or a loss. Like gamblers on a lucky or unlucky streak, emotions begin to take over and dictate their trades. Losses often provoke people to hold on and hope to make their money back, while profits often entice traders to be greedy and  hold on for even more gains.


Planning exits with Initial Stop-Loss and Take-Profit Levels

An initial stop loss point is the price at which a trader will close a position and take a loss on the trade. Often times, this happens when a trade does not go the way you had hoped. The initial stop loss point is designed to prevent the “it will come back” mentality and will limit losses before they get overwhelming. For example, if long in a stock and it breaks below a key support level, it is often a good time to close the position.

On the other side of the table, a take-profit point is the price at which a trader will sell a stock and take a profit on the trade. Often times, this is when there is limited additional upside given the risks. For example, if a stock is approaching key resistance level after a large move upwards, traders may want to sell before a period of consolidation takes place.

How to Effectively Set Initial Stop-Loss Points

One good way to determine stop-loss or take-profit levels is based on support and resistance levels that can be drawn by connecting previous highs or lows that occurred on significant, above-average volume. A trader can also use longer term moving averages to help establish potential support and resistance levels.  The key to determining the best initial stop loss is to determine solid support and resistance levels and to set them just inside these levels by 1/2%.

Conclusion

The important thing to remember is to never place a trade before you determine what your initial stop loss and take profit levels will be.  Know in advance where you are going to place your initial stop loss to keep your losses to a minimum, if the trade goes against you. And place your profit target where you are willing to take a profit when the trade goes in your favor.

Stock Trading Strategy: Use Candlesticks

Today, the stock trading strategy we are going to discuss the topic of Candlesticks.  When looking at a chart we need to determine which type of charts we want to use.  There are many different choices that we can use including line charts, bar charts, range charts and candlestick charts.  Candlestick charts seem to be one of the more common types of charts used and one that you should at least be somewhat familiar with.

As traders, we need become familiar with the type of charts we are going to be using in order best understand what the charts are trying to tell us.  By choosing one type of chart it can make reading the charts a bit easier.

The candlestick charts have been around since the 18th century and are thought to originate with Japanese rice traders.  From then until now the use of candlestick charts have evolved into an elaborate way to identify trading opportunities.  These ways include individual candlestick patterns and multiple candlestick price patterns.

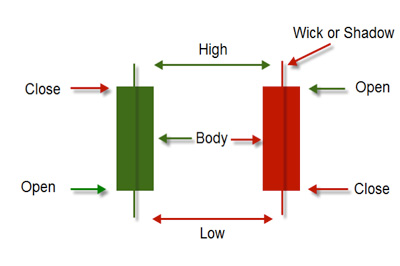
In looking at an individual candlestick you will see commonly used data that forms the candlestick itself.  Take a look at the pictures below to see how these are formed.

Notice that each candle, both the up and down candles, have a body which is a solid rectangle.  They each also have what is called a wick or shadow.  The body of the candlestick show where the price opened and where it closed.  For an up candle (green) the open is at the bottom of the body and the closed price is at the top of the body.  For a down candle (red) the open is at the top of the body and the closed price is at the bottom of the body.  The wicks are the same for both the up candle and down candle, the top of the wick or shadow is the high price and the bottom of the wick or shadow is the low price for the candle.

Each candle represents a specific time period.  Candlesticks generally range from 1 minute to 1 months.  This means that the candles can look a lot different depending upon the time frame used.

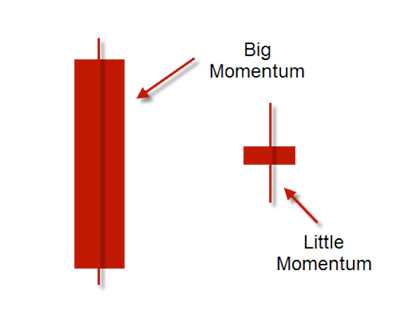
In addition, candlestick can give traders an idea of the momentum or lack of momentum for the given time period.  Take a look at the picture below to see how the different momentums can look with candlesticks.

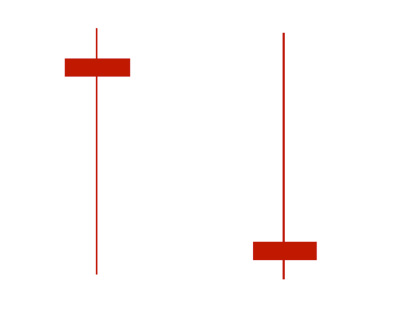
With lots of momentum you can see large bodies created and with little momentum you can see small bodies.  This can give the trader an idea of the amount of interest in a certain currency pair.  You can also identify when there might be lots of volatility for a specific time by looking at the size of the wicks or shadow.  Take a look at the picture below to see how this might show up on a candlestick.

With these candlesticks you can see that there was lots of movement without much change in price.  This might indicate that there was lots of volatility happening for that specific time period.

Candlesticks may or may not be for you but now you have an idea of what they are and how you might use them.  Take some time to practice with them to see what you think.

Knowledge vs. Creativity

A topic that I have heard people debate for quite some time now is whether it is more useful to have allot of knowledge with regard to a particular subject or if it is better to be able to be creative around it.  My thought process has applied this question to trading and other topics many times in the past and while there will likely never be a definitive answer due to differing points of view and opinions I believe that they can coexist and in fact in order to maximize ones potential they almost have to coexist.

Having allot of knowledge when it comes to a particular topic is very important.  Gaining knowledge from traditional methods such as on the job training, personal research or through learning in a school or classroom environment is essential in many instances.  Without basic knowledge of a particular topic it is very difficult to grasp the specific mindset that is required to understand it and trading of course is no different.   When you have studied charts, taken classes and done allot of personal research, at some point in the process you develop the trader’s mindset which is very important.  It is important to know the technical aspects of trading and really any topic because when it is applied in real life situations we begin to gain experience as well.  Experience adds greatly to one personal knowledge base because it can tell you when trouble is looming even when the technical aspects of what you are seeing do not indicate that and it can also lead you to an opportunity that may be present that people with little or no experience could not possibly see.  This is all very important and I believe that it is essential for success but is that really all that we need?

The ability to be creative around any topic will greatly enhance your ability to succeed and again trading is no different.  I have heard people state that watching charts live is allot like and about as exciting as watching paint dry and I occasionally will agree with this, however, I have also stated many times in the past that the more you look at the charts the more that you will see.  There is an infinite number of ways to trade and to be successful the only reason we do not apply different creative ways to our trading is simply because we have not thought of them yet.  When you study charts watching the tendencies of the price action adding and subtracting different technical indicators while also noting what happens when fundamental events occur you will begin to see various patterns unfold that actually become very obvious after you discover them.  After you discover new patterns and repetitive events in the price action of a chart you will note that the same old charts are being used with the same old indicators but when you play with them and change them they actually can become new and very vibrant.

Following in the path of knowledge and utilizing what has already been learned is very important but if we can use that knowledge as a catalyst or a basis to be creative and discover our own way of thinking and looking at trading there becomes as many ways to trade as we can think of.  Looking at charts and trading in a traditional way while using the traditional knowledge may be ok to an extent but it can cause a problem because that is what most traders will be doing.  If we can find a way to look at the charts and the indicators in a way that no one else looks at them we will be doing different things than they are at different times which not only sets us apart it will give an advantage over our competition which of course is every other trader in the world that trades in the market that we trade in. 

Being creative with no knowledge and having knowledge with no creativity will likely leave you running with the pack doing what everyone else does which is largely unsuccessful.  Being bold and willing to look at different ideas in different ways is what can set us apart running away from the pack in our own direction.  Many successful traders state that they are successful because they can find opportunities before anyone else recognizes them does not necessarily mean that they have more knowledge than anyone else nor does it mean that they are more creative.  What it may mean is they have found a way to marry the two drawing on the aspects of each that are needed in any given situation which puts them in the best possible position to succeed which often times is a much better position than most other traders. 

Stock Trading Education Tip: Trade What You See

Today I want to discuss a  stock trading education concept (aslo works with ETFs, metals, and Forex) that many traders understand from a theoretical standpoint but often times have a hard time applying.  It is something that is affected by our trading psychology more than anything else.  This concept is – trading what we see.  This may seem simple enough but it is something that many traders struggle with.

Most traders have some sort of trading rules that they have created and are trading from.  These rules are designed to help us know when to enter and when to exit our trades.  If we follow our rules as we have outline we will do well, but if we stray from our rules we often times will lose.  Trading what we see simply means that we are trading our rules based off of what we see happening on the chart.  This should make sense to everyone but it is not something that is always followed.

As we begin our trading we sometimes will make decisions on what we “think” will happen as opposed to what we “see” happening on the charts.  Once we move from “seeing” to “thinking” we move into that area of potential disaster.  As traders we need to have our rules, understand our rules and trade our rules.  By gaining confidence in our rules we will be more likely to trade what we see, not what we think.

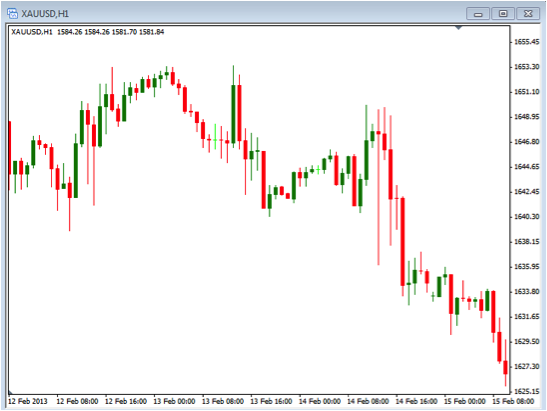
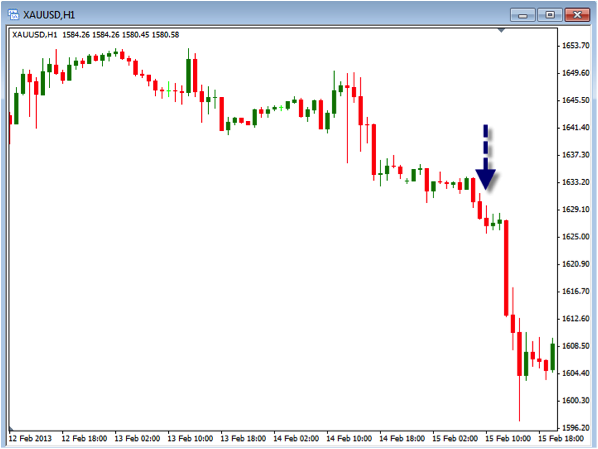
Let’s look at a common example of how some traders trade when not following their rules.  In the chart below you can see that the price has moved down nicely.  This quick move down will get traders thinking that the price cannot move down anymore.  Once they begin thinking like this they will be more likely to want to close positions or start to trade in the opposite direction before a real reversal move begins.  Once we trade on what we think or feel may happen we have stepped away from our rules.  We need to make sure we are trading based off of the price confirming a move, not on the potential for a move.

Notice the big move down on the price of Gold.  Traders, without a trading plan, may decide that they should start to buy gold because it “cannot go down” anymore.  This may be true, but without confirmation of seeing the price move back up we are only guessing that it might happen.  Take a look at what happened to the chart later on.


The blue arrow shows where the prior chart ended.  Notice that the price did not stop the downward movement but continued in an accelerated rate to the downside.  If you were to have followed what you thought would happen you could be sitting in a large drawdown or stopped out with a big loss.

By waiting for the change to occur and following our rules we can focus on trading what is actually happening and not on the idea that it might happen.  Anything might happen and it does not matter what we think may happen.  The most important thing is to have your rules and then waiting until the conditions are met in order to take a trade.  Remember, trade what you see, not what you think.

Welcome To The Sequester Soap Opera

Our friends in Washington are at it again. We have the infamous sequester looming on the horizon scheduled to go into effect March 1st. Like the Fiscal Cliff, you now hear all of the foreboding warnings coming out of Washington that if the Congress and the President don’t come to some other understanding, this sequester will automatically mandate significant cuts to the budget.

We’ve seen this soap opera before in the form of the Fiscal Cliff and before that, the failure to agree to any budget whatsoever in the past four years. During that entire time, the stock market has done just fine. So my advice would be to ignore all of the media hype around the dangers of the sequester and just stay with your discipline and go where the market wants to go. Right now the market continues to say it wants to go up. Now it’s not going to go up forever and so you have to have specific exit criteria to exit the market so you lock in your profits and step aside at the right time and then wait for another good high probability buying opportunity. But right now the market says it still wants to go up.

Now this sequester business is all smoke and mirrors as far as I’m concerned. We’re spending over a trillion dollars a year more over and above the total revenue that the Federal government takes in each year. That’s of course adding to the $16-plus Trillion of debt we already have. These numbers of course are so unbelievable that people have become used to them only because there’s nothing else to do.

So the sequester talks about slowing the rate of deficit spending somewhat, that’s all it does. It is not Draconian whatsoever. It will not impair the economy. On the contrary, unless the Federal government starts to rein in spending, the economy is headed for a very, very tough slog. So I look at the sequester as not the best way to cut spending, but at least it’s a start. I hope it goes into effect frankly. Hopefully those politicians will sober up and get some fiscal sanity into their dialogue and follow through with actions.

So in the meantime, stay with where the market wants to go, have your exit strategy in place, and don’t listen to those media hounds, they’re just going to throw you off track.

Fibonacci: A Powerful Tool with a Funny Name

Traders are always looking for “the” best indicator to use, while I don’t believe there is such a thing as the best indicator, I believe that technical traders can be successful when they rely on time tested support and resistance to help forecast market movements. Today, I would like to discuss the use of the Fibanacci Retracement technical indicator that many technical traders use to trade stocks, futures ETF’s, etc.  The Fibonacci retracement patterns can be useful for swing traders to identify reversals on a stock chart. Looking at stocks for example, once they have moved up or down in a trend, have a great tendency to move back or retrace a certain amount, rather than to move in a completely straight line or direction up or down. Because of this common retracement pattern, stock traders use the Fibonacci Indicator as reference points to predict certain retracements levels as the stock moves back and forth in a trend during a retracement or “pullback”. You will find Fibonacci levels to be very accurate when analyzing chart pattern reversals. Fibonacci indicators also provide an excellent visual map and identify very accurate support and resistance levels. Some traders will also combine Fibonacci Retracement levels with common candlestick patterns to identify optimum entry and exit points. An effective candlestick pattern trading method is to look for small double bottoms or double tops and individual doji or shooting star or hanging man type reversal candle patterns within these Fibonacci levels to identify trading opportunities.

Fibonacci levels are where price retracements or “congestion” often form. Just like moving averages, the Fibonacci levels work like price magnets to old highs or lows and can also form good support and resistance levels. For an even greater degree of accuracy they can be combined with the major candlestick patterns

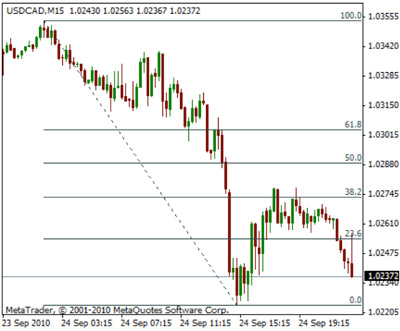
The most common Fibonacci levels used in technical analysis for drawing Fibonacci lines are 62% (61.8% rounded up), 38%, 24% (23.6 rounded up) and 50%. For existing trends, the 24% level should be the minimum retracement but can go down as low as the 62% level. As price retraces, support and resistance occurs at a high rate near the Fibonacci levels. In an existing rising trend, the retracement lines move down or “retrace” from 100% to 0%. In an existing downtrend, the retracement lines move up or “retrace” from 0% to 100%

You can see in the USDCAD chart above that the retracement retraced to the 38.2% level before continuing the downward trend.

Technical Traders use these Fibonacci Indicators (Fib-lines or Fib-levels) to predict Price Targets and Support/Resistance Targets. To accurately draw the lines to identify these patterns you begin drawing from the lowest point (which equals your 0 percent line) to the highest point (which equals your 100% line). The 38%, 50%, and 62% lines will provide your reference point for targets.

While there is nothing that can predict the market with 100% accuracy, using the Fib-levels can greatly enhance your ability to be in profitable trades. Adding the candlestick signals provide a great advantage for being able to immediately recognize what is going on with investor sentiment at these levels.

Traders Challenge:  If you haven’t used Fibanacci levels in the past, add Fibanacci levels to your stock charts and study the retracement patterns to help identify potential support and resistance areas and potential entries

Stock Trading Strategy: Use Trailing Stops!

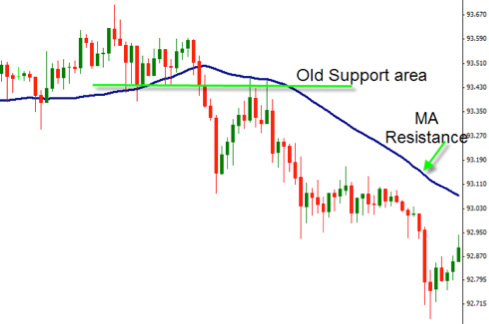
Today we are going to discuss a very important stock trading strategy: the use of a trailing stop when we are in a position. And just as a reminder, this technique works with stocks, ETFs and forex trading, so take notes! Now, to begin we will look at the purpose of a stop loss in general.  Stop losses are set up to limit the amount we will lose when entering into a trade.  This pre-determined stop loss area is based on something we see on the chart that will tell us when the trade is no longer doing what we thought it would.  A stop can be placed based off of things like prior support or resistance areas, moving averages or some other indication we see on the chart.  This is the area that we do not anticipate the price moving to and if it does we want to get out of the trade.  Take a look at the chart below to see how an initial stop loss can be determined.

In this chart you can see that we could look at an old area of support to indicate where to place the initial stop loss or the area of the Moving Average resistance.  You can also look at the prior highs in this case to place the stop.  Once this initial stop has been determined you can calculate the amount of your position size that you will be trading.  This will make sure you are staying within your risk comfort level.  Once you have this initial stop placed you can decide if you want to make it a trailing stop.

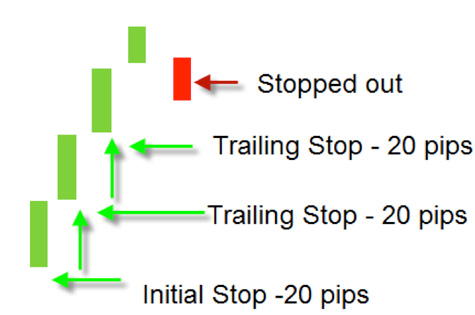
A trailing stop does exactly what it says, it trails the price of the currency or stock by a certain amount.  The idea is that you will exit the trade once the price has begun to retrace a certain amount.  For example, if you have a long position and your initial stop is set at 20 pips and a trailing stop of 20 pips, you will get stopped out once the price drops 20 pips from its highest price.  So, for every pip the price goes up, the stop will be adjusted up one pip.  The reverse is not true in that the stop will never drop down from its highest level.   The opposite pattern will occur for a short position.

Take a look at this picture below.


In this picture above you can see that the initial stop loss was placed at 20 pips.  As the price moved up you can see that the trailing stop adjusted upward as the price move up.  This continued to move up until the price dropped down and hit the trailing stop.

On issue that you need to be aware of is that each trading platform may have a different way to apply a trailing stop.  Check with your broker to see how they apply the trailing stop tool.  Another issue that traders will run into as they begin to us a trailing stop is that they end up getting stopped out too soon.  They find that even though the price moved up strongly that their position was stopped out because they place the trailing stop too close.  So the key important point is to find the appropriate area to place the trailing stop so you do not get stopped out prematurely in the move.  Take some time to practice with the use of a trailing stop to see if it can help in your trading.

Does the US Stock Market Need a Correction?

Many so called experts believe that since the US stock market has been on fire and rising steadily for quite some time now it is just about time for a correction.  This is a good common sense approach to what has been going on but does that way of thinking really have much merit?  This is an economic topic so of course there are solid arguments that can be made both ways, for and against, and as usual analysts and economists really have no idea they’re merely guessing at what may happen which is what their jobs are based on, guesswork.

Since the last large correction in third quarter of 2011 and the subsequent volatility that followed into the middle of the fourth quarter of that same year the stock market has advanced at a very steady pace.  There was a smaller correction that was largely based on the European debt issues towards the end of the second quarter in 2012 and of course the Congress induced fiscal cliff fiasco in the fourth quarter of 2012 but as a whole the S&P 500 was up 13.4% for 2012.  So far this year it has advanced 5% in January and 1% so far in the first two weeks of February which of course is great but can it continue and do we really want it to continue?

One philosophy I have heard voiced by some of the most iconic stock traders in our history is that you should see where the dumb money goes and do the opposite.  The question of course is where is the dumb money going?  With the nice rise in the S&P 500 and the fact that cash and safer investments are paying very little this means that money has been pouring into the stock market.  There is still a tremendous amount of cash out there doing very little with regard to earning a return for its owners so people are chasing the big returns that the stock market has produced by moving cash into stocks which of course drives the market even higher.

The stock market may be a bubble that needs to pop because though it has made fantastic gains how much substance is there to those gains meaning how sustainable will it be in the future.  At the end of last year most of the companies in the S&P 500 reported earnings that beat analysts’ predictions which were very low to begin with and nearly three quarters of those same companies have issued negative outlooks for the first quarter of 2013.  Unemployment is still remarkably high and the real numbers are much worse when the people that have given up looking for jobs or have been out of work for too long to be considered in the unemployment equation are added back in.  There are renewed concerns over Italy and Spain so the European problems have not gone away the media is just not focusing on them right now.  There is a March deadline coming up in the US that requires automatic government spending cuts which Congress would actually have to do their jobs and work on to avoid.  All of these items in addition to the fact that consumers have less net income means that there are allot of reasons for a market pullback.

The recent move in the stock market has been largely fueled by the Federal Reserve propping up the economy with their 2 trillion dollar bond buying program with the good news being that there is no indication that will end anytime soon.  The next few months should be a very interesting market environment to be a trader or an investor in, typically when a downturn is expected in the stock market it doesn’t happen but as many people chase the rising market raising it to new levels the professionals will likely begin to book their profits and move into cash waiting for the next opportunity that an inevitable pullback will create.

Gold & Silver Trading Consolidation

Today I want to discuss how we can use consolidations in the market to look for opportunities to buy or short gold ETFs and silver.  In fact, this can be used for any type of instruments that you may be trading.  It is based on the important concepts of that are used in trading – trends, support, resistance and price action.  Gold and silver, like other trading instruments, tend to move in trends followed by areas of consolidation.  Trending charts are either going up or down while consolidating charts have the price moving to the side.  These areas of consolidations can give us opportunity’s to enter the trade as price begins to move back into the current trend or reverse and go in the opposite direction.

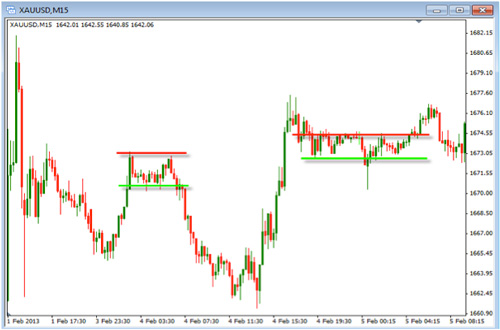
In looking at the chart below you will notice the areas where the price has been trending and areas where it has been consolidating.  In this chart each one of these candles represents a 15 min. time period so the consolidations are lasting for several hours.  If you were looking at a daily chart, the consolidations may be lasting for weeks at a time.  During this time of consolidation the price action forms areas defined by a lower support and higher resistance area.  Also notice the outlined areas of support and resistance with the horizontal lines.  These lines may not be exactly sideways but they do show that the trend has slowed and that the price has being to move in a tight range.  These consolidations are the areas where we will look enter into a trade once the price has move above or below them.  When looking at these breakouts you will notice that once they happen the price will either continue in the current trend or reverse its direction.  A breakout in the direction of the trend is considered a continuation breakout while one that breaks out in the opposite direction of the trend is considered a reversal breakout.

This chart shows how consolidations can be either longer term or shorter term.  You will also notice that the consolidations do not have to be exactly horizontal but can be at an angle.

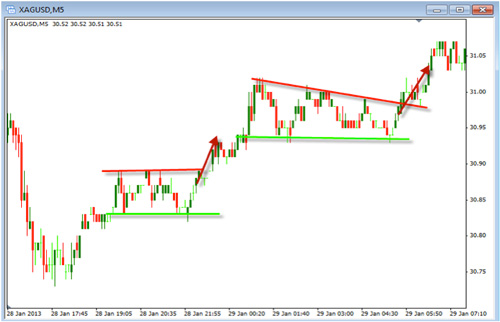
In this next chart you’ll notice we have identified continuation breakouts.  These types of trending moves and consolidation moves can occur on any time period chart and can be traded in a similar fashion.  So you can look a 5 min chart or weekly charts and find the same type of setups.  In this chart we are using the 5 min. chart to see how they work.  You can see the red up arrows that indicate where the breakouts would have occurred.

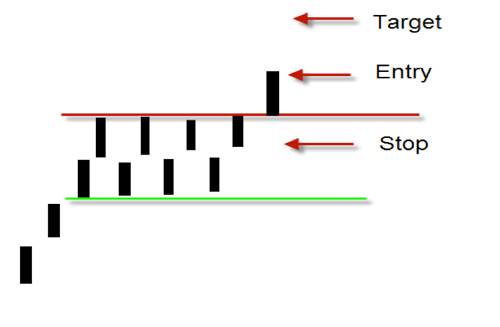
When trading breakouts we will look to enter the trade when the price confirms its movement outside of the consolidation area by closing either above the resistance line or below the support line.  Once a trade is entered a stop loss will simply be placed back inside the area of consolidation.  Many traders like trading these types of setups as they give a well defined area for both entering the trade and exiting the trade.  Targets can be set by identifying prior areas of swing highs or swing lows or looking at other areas of resistance or support.  Take a look at the picture below that illustrates where the entry, stop and target may be set.

With the Gold and Silver charts moving sideways, take some time to practice placing consolidation lines on your charts so you can better visualize these areas where you might find opportunity’s to trade.  Then practice placing trades in a demo account so you can see how they work.