Defining The Trend

Today we are going to spend some time talking about how we define the trend of the chart.  Regardless of the time frame we are looking at we need to be able to tell the direction that the price is moving.  The trend can be defined in terms of the long, intermediate and short time frames.  If we are trading the short time frames we still want to know the longer term trends.  The longer the trend, the stronger price movement can be expected.  If we are trading counter to this longer time frame we need to be aware that we are doing so.

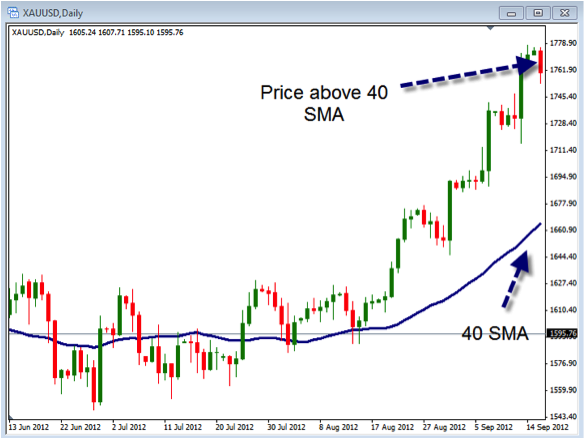
The first thing we need to do is have some criteria we look for in order to define it the trend is up, down or sideways.  As an example I will present the following as a suggestion of how to define each of these trends.  We will use the chart of Gold on the daily time frame for our example:

In order to define the trend as moving up we are using the 40 period SMA.  When this SMA is pointing higher like we see here, the trend is up.  In order to confirm the trend we want to make sure that the price is also above this average.  Knowing that the price and moving average are sitting in this position we can have confidence that the trend has been established as up.  Once the trend is established as up we will be looking for opportunities to buy.

Downtrend:

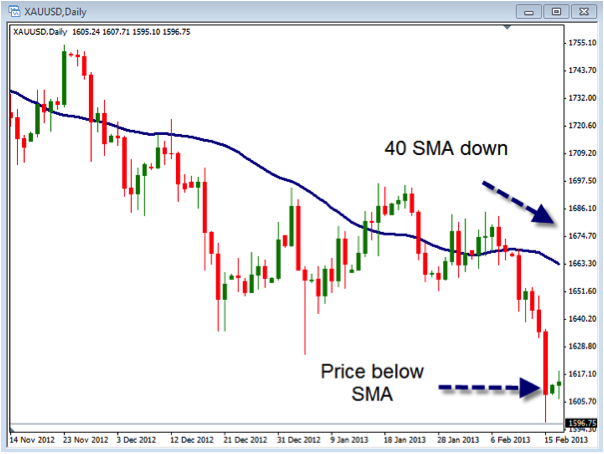
In order to define the trend as moving down we are using the 40 period SMA.  When this SMA is pointing lower like we see here, the trend is down.  In order to confirm the trend we want to make sure that the price is also below this average.  Knowing that the price and moving average are sitting in this position we can have confidence that the trend has been established as down.  Once the trend is established as down we will be looking for opportunities to sell.

Non-trend:

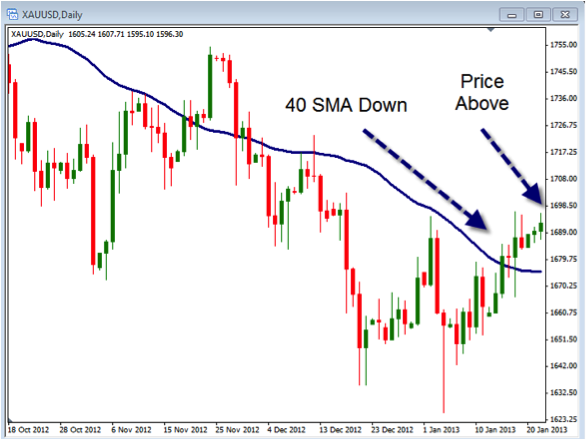
Should the alignment be different than what was described for the uptrend or downtrend we will consider it a non-trend.  In this example above we can see that the 40 SMA is moving lower but the price is above the SMA.  This is out of alignment for calling it a down or uptrend so we will look at it as a non-trend situation.  In this situation we would not take a trade until the proper alignment happen for the up or down trend.

When we are looking to take trades we want to make sure we know what the trend is for the time frame we are trading as well as the longer time frame.  This puts us in the best possible position to allow our trade to move in the direction we want it to.

Take some time to review how you determine what the trend is.  Make sure you outline your rules and write them down so you can follow them when looking at your charts.

Should You Be In Gold Right Now?

It may be time to buy gold and silver mining stocks, as well as gold and silver ETFs. It seems the most hated stocks in this rising stock market since the first of the year are gold and mining stocks. It also seems like the S&P 500 and the Dow Jones averages are over-extended and due for a significant correction. Of course, it’s impossible to predict when exactly that will happen, but it will happen. So what is the prudent thing to do right now, given that the S&P 500 and Dow Jones are near or at nominal record highs and the gold and silver mining stocks are beaten down and hated and extremely cheap? It would seem the opportunity lies with the gold and silver mining stocks, which can quickly rise in price ten, twenty, thirty, forty percent in a matter of a couple of months. Whereas it’s unlikely that the major indexes are going to rise that much in the next two years.

So if you’re a trader who has an edge, meaning you have a method that puts the odds in your favor, you might want to put that method to work on the gold and silver mining stocks, and gold and silver ETFs for that matter. And you might want to scale back or at least protect your long positions on all of those stocks that have enjoyed a nice bullish run since January 1st.

Now of course the media will not ring a bell telling you when it’s time to pile into the gold and silver mining stocks, and they won’t ring a bell telling you when you should cover your long positions on all the stocks that have run up since January 1st. But you might consider this article as ringing such a bell. 

What To Do When The Markets Take A Turn For The Crazy

Has the financial news got your head spinning? Record highs one day, Budget crisis the next, the tiny island of Cyprus throws the market in a panic another day.  Many traders are feeling the anxiety that comes from the currents ups and downs of the market. This anxiety may even have some traders considering stopping trading altogether until a “better” market comes along.

The first thing to remember is that there is NO perfect market! The market isn’t really good or bad, it just IS.  What makes the market move, are the emotions behind the market and their effect on supply and demand. There is nothing we can do to change this. In fact, if the market didn’t go up and down we would not have any trading opportunities. Certainly there are times, like the present, when the market is more uncertain than we would wish for. But, if we allow the market to get into our heads we can really find ourselves overly anxious and even discouraged to trade.  Trader’s who tend to be preoccupied with catching only perfect trades, and never losing on a trade, end up being disappointed with themselves when they fail to meet these goals.

There is no doubt that during times of market volatility, like now, can lead to fear and anxiety over our trading style and methods. However, if we start to question our successful trading methods, you may start to question the sanity of trading altogether, and you may decide that it is better to sit on the sidelines and not trade at all.   This kind of defeatist attitude is allowing our fears to overcome logic and will lead to more unsuccessful outcomes.  To stop trading will eliminate market risk, however this will also eliminate any opportunity to be successful and make any trading profits as well.

We can’t totally eliminate risk; therefore we set out to reduce our risk. Often times traders will try to reduce their risk by tightening up their stops, which is a common reaction among newer traders, however more seasoned traders understand that tightening up our stops during more volatile times can be the worst thing we can do.  In fact, doing so can almost guarantee that we will lose on the trade.  Often the thought is; if we are going to lose anyway, we want to lose less that we would have under normal circumstances. The only real way to reduce our risk is to reduce our EXPOSURE. Some traders reduce their exposure by tightening their stops which will reduce our potential exposure, but it also increases our probability of taking a loss. The best way for a trader to reduce our exposure in a volatile market is not by tightening up our stop but by reducing our position size.  So if we are going to reduce our exposure by reducing our position size and we normally define our risk as 2% per trade, then we may want to consider reducing our exposure per trade to 1% or even .5% instead.

BOTTOM LINE

If we are feeling anxious because of  current market uncertainty, the best thing we can do is NOT to worry about changing our methods,  but simply reduce our position size, therefore, reducing our exposure to the volatility or “choppy waters.”  This will help us control the fear and anxiety that come from trading in times like we are currently experiencing.    

Deliberate vs. Non-Deliberate Markets

Today we’re going to spend some time talking about deliberate trading markets. Whenever we are trading the ideal situation is to have a market that is deliberate in its movements.  A market that is deliberate becomes easier to identify proper entry points while non-deliberate markets become difficult to find proper entry points.  Regardless of the method we are trading a deliberately moving market will be to our advantage.  If we are trying to force trades by entering in during non-deliberate movements we are only asking for trouble.  Focus on trading deliberate markets and you will be giving yourself the best opportunity for success.

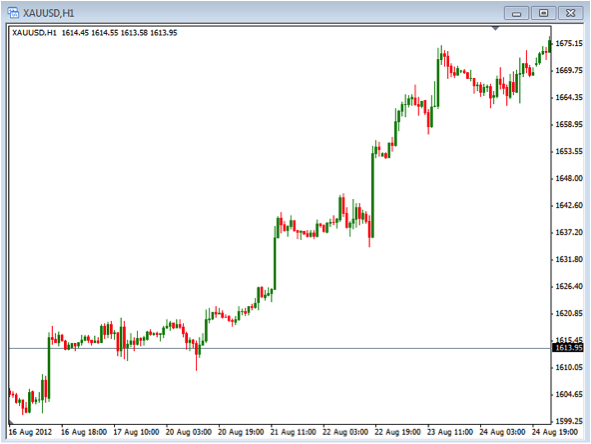
The first thing that we need to do is identify the difference between a deliberate market and a non-deliberate market. A deliberate market is one where the price action is consistently making either higher highs and higher lows or lower lows and lower highs.  You can also see a deliberately traded market that is moving sideways while making consistent highs and consistent lows.  Take a look at the chart below to see an example of gold moving in a deliberate fashion.  Here you can see that the price is consistently moving in an upward direction forming higher swing highs and higher swing lows.

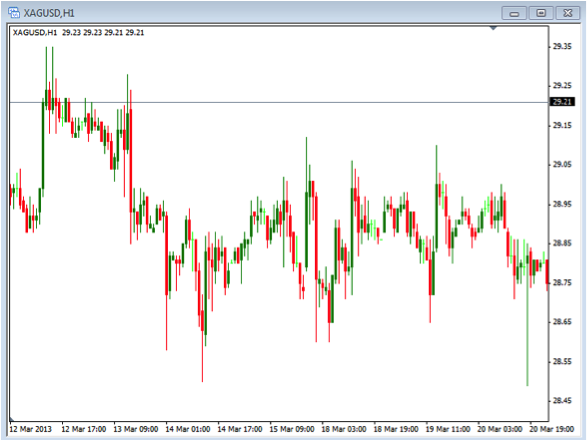
A non-deliberate type of the chart is one in which the price action is inconsistent in how it moves.  A non-deliberate market will have swing highs and swing lows that do not follow the deliberate pattern.  In addition, you’ll find in a non-deliberate charts candlesticks that have large wicks and move in a volatile fashion. You can also see non-deliberate charts that lacked volatility and just seem to chop in a sideways pattern.  In this chart below you can see an example of silver which is moving in a non-deliberate fashion.  When we see our charts moving like this we need to be cautious and recognize the fact that the price action might be inconsistent. This inconsistent price action can make it more difficult to find a good setups with the methods we are trading.

In the end, regardless of what we are trading or the method we are using to trade we need to have a market that is deliberate in how it moves.  A deliberately trading market allows us to have more confidence in our methods and will bring us more success with our trades.  This week we have seen market conditions that have been somewhat non-deliberate in their movements because of things like the FOMC announcement.  We need to recognize when the market may be more likely to have a non-deliberate movement and avoid those times to trade.  If we know when the news comes out and can avoid the times when volatility may be high.  By putting our focus on trading during deliberate markets we will place ourselves in the best possible situation to find a success we want.  Take some time to review your charts to see how well you can identify the difference between deliberate and non-deliberate markets.


Cyprus Was A Black Swan…

Cyprus turned out to be a black swan. With the events in Cyprus the last couple of days, once again we are reminded about the fragile state of the world’s financial system, and the predicament that the politicians worldwide find themselves in with ever-mounting deficits that can never be repaid.

They cling to power at all costs, exacting more and more punitive taxes or other forms of confiscation to at least go through the motion of trying to raise revenue to offset these deficits. That’s exactly what’s going on in Cyprus. They call it a ten percent tax on savings, but it amounts to nothing more than confiscation of private individuals’ property. So I believe there are many others and that Cyprus was a trial balloon to see what the reaction would be by private individuals, by the bankers, by the governments and if the reaction were benign, then why not do the same thing in Spain? Why not do the same thing in Italy? Why might not our friendly U.S. Government try the same thing eventually? So this could be a cascading effect.

Now the initial reaction to Cyprus was one of outrage. But already it’s starting to die down, which is not a good sign.

So what does this all mean to you? It means that you need to be vigilant. You need to be in a position of control so that you can look after yourself and your family, no matter what happens. Given the current and continuing fragile state of the world’s financial systems and out of control spending governments, my recommendation continues to be if you don’t know what to do about that, then you better find out, because you don’t want to be sitting there as an unsuspecting victim of this continuing drama. For me that means you have to be a nimble trader or nimble investor. Meaning you’ve got to go with these markets with a short term mentality, up or down, because anything can happen and it will.

So in order to that you need to have an edge when trading the markets or investing in the markets. An edge is something that puts the odds in your favor. If you don’t know what your edge is, then you don’t have one. So I strongly recommend that you go and get an edge. Find out where you can get an edge and that usually involves learning how to trade at least one good trading or investing method that will definitely give you and edge over a series of trades.

Now it’s probably too early to tell whether Cyprus will turn out to be a black swan. The next few days may tell the story. But whether it is or not, it serves notice that such events while surprising when they occur should not be unexpected in the months and years to come. So you are left with no choice. The bankers certainly won’t help you. The politicians certainly won’t help you. We all need to adopt an attitude or personal sovereignty. Take control so we can take advantage of these unfolding events no matter what they may be. 

Top 5 Sector ETFs

Many long term buy and hold investors have been conditioned to be satisfied with returns that mirror the market averages over the long term. These investors hold on to the hope that at the end of their lives, their investments will show positive returns. In the meantime, traders are making and losing millions using what the buy and hold crowd refer to as risky strategies. But what if they weren’t really that risky?

What if you invested in the strongest, fastest growing stocks when the market was going up and in the safest stocks, or no stocks at all, when the market was going down? That sounds like a perfect strategy, but picking individual stocks is far too risky, right?

The compromise between the risk of buying individual stocks and the lack of control that most buy and hope strategies offer can be found in sector based ETFs. These funds allow you to put your money to work in the most productive places, yet still provide the diversity of investing in many companies at the same time.

The S&P 500 is generally considered to be the index that best gives the broad picture of the general market.  It is up 2.4% over the past month, which is great! What if you could have done better?

Here are the top five performing SPDR Sector ETFs over the past month:

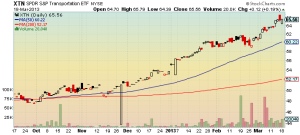
SPDR S&P Transportation ETF (XTN) – Up 7.5%

Transports have been cruising higher since the beginning of the year, and they have really taken off in the past three weeks. It is often said that the Transports are a leading indicator for the economy, so even if this trend doesn’t last, it can be a positive sign that jump starts other sectors.

If you had owned this transportation ETF over that past month, you would have done three times better than the general market. This is important to keep in mind when reviewing performance. Just because a number is good, doesn’t mean that it couldn’t be better.

The transports are a very broad sector. They are currently being led higher by airlines like Delta (DAL) and Alaska Air (ALK) as well as car rental companies like Hertz (HTZ) and Avis (CAR). These industries have been very hot lately.

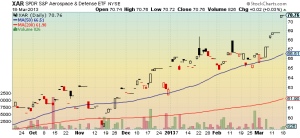
SDPR S&P Aerospace / Defense ETF (XAR) – Up 6.4%

After trading very tightly over the first two and a half months of the year, the aerospace/defense stocks have really started to take off in the past few week. This group contains stocks like Honeywell (HON), Transdigm (TDG), B/E Aerospace (BEAV), and United Technologies (UTX).

Aerospace/Defense is another sector that has performed almost three times better than the S&P 500 over the past month. By simply noticing this performance, you could have seen this trend developing and made significantly more than the general market during this uptrend.

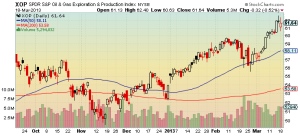
SPDR S&P Oil & Gas Exploration ETF (XOP) – Up 6.0%

The Oil & Gas Exploration sector could be just getting started on a major move after jumping the past few weeks. The sector had been consolidating when it tried to break out in early February, but then suffered three straight down weeks. Since then, it has put in two very strong up weeks and appears to be ready to head higher.

If you owned the Oil & Gas Exploration ETF over the last month, you would be up 6.0% on the position. Again, this is much better than the general market has done. Some of the stocks pushing this sector higher include PDC Energy (PDCE), Delek US Holdings (DK), Valero Energy (VLO), and Marathon Petroleum (MPC).

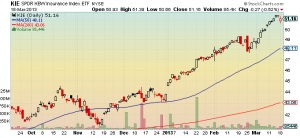
SPDR S&P Insurance ETF (KIE) – Up 4.8%

The Insurance sector has only had one down week this entire year. It has been one of the strongest sectors all year, returning 16.9% year to date. In the past month, the Insurance sector is up 4.8%, making its performance double the performance of the S&P 500. It is currently being led higher by stocks like Assured Guaranty (AGO), Genworth Financial (GNW), and Progressive (PGR).

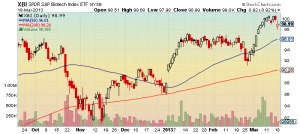
SPDR S&P Biotech ETF (XBI) –  Up 4.7%

Despite pulling back a bit last week, the Biotech sector is still way up on the year with a big chunk of that coming two weeks ago. The sector is up 4.7% over the past month and 13.7% year to date. Four of the stocks pushing this sector higher are Isis Pharmaceuticals (ISIS), Pharmacyclics (PCYC), Incyte (INCY), and Celgene (CELG).

What Are The ETF Advantages Over Mutual Funds?

While Exchange Traded Funds (ETFs) are not new, (they have actually been around for about 20 years,)they are certainly getting a lot of attention lately.  This is due to the ability for an individual investor to easily combine index and sector investing with the convenience of the individual stock ownership, is a formula hard to resist. ETF’s are a collection of shares that follow a particular index, industry, or a commodity like Gold or Silver, like a traditional mutual fund does, however, that is where the similarity ends.

There are several advantages Exchange Traded Funds  have over Mutual Funds for equity investors, because of the fundamental difference that ETF’s trade like individual exchange traded stocks not Mutual Funds.

The Differences vs. Mutual Funds:

  1. When a new investor buys shares in a mutual fund, he or she pays the end of day NAV (net asset value).  Since ETFs are traded on the exchange, they act just like any individual stock issue, and can be purchased any time at the current price during the market hours.


  1. When an investor purchases shares in ETFs, unlike mutual funds, they may use the same kind of orders used when purchasing individual stocks like pending limit orders, pending stop entry orders, stop loss orders, and take profit limit orders just like stock trading.  This ability to trade an ETF just like a stock is a great advantage for more active swing traders allowing them to apply many different trading strategies to their ETF positions, something that just can’t be done to mutual funds.  In addition to applying order types, with ETFs, you may go long or short, just like stocks something you can’t do with Mutual Funds.


  1. With exchange traded funds an investor may also buy long or sell short any number of shares that, he or she would like too, even down to one share, if desired.    This is a real advantage for the investor with a small portfolio, as many mutual fund, have much higher minimum purchasing requirements.


  1. For investors with experience trading options, you can trade puts and calls on many ETFs just like any other optionable stock.


  1. The management fees are generally less in the ETF world, as they just need to pick the basket of shares that follow their sector or specialty, and are much less likely to have highly paid fund managers (expensive stock picking gurus.)


There you have it summary of the major differences between the two kinds of funds, ETFs and Mutual Funds, in a nutshell.  For the active trader, I think it is easy to see the real advantages of trading Exchange Trades Funds over Mutual Funds.   Also, many say that there are tax advantages to ETF’s (mainly the EFT underwriters.)This is a complicated topic that the Mutual Fund and ETF industries don’t seem to agree upon.  All I know is that if we are successful and make some money, just like the “death thing,” Uncle Sam is always going to get his “Capital Gains” in the end.

Money Management

One of the most important aspects of trading is the ability to use proper money management.  If you do not use proper money management you are setting yourself up for taking large losses in your account.  This is something we obviously want to avoid so make sure you take the time to know how to manage your money properly.

Money management includes the process of determining the proper amount of risk to take in a trade and also the proper position sizing for the trade.  We know that there are very few things we can control in the market and most of them revolve around money management.  We know that we cannot control the market direction, news or what other traders are doing, but we can control the amount of our money that we are allowing the market to “play” with and we can decide whether or not to trade during news announcements.

There are 3 things that we want to work on controlling.

  1. Maximum risk per trade
  2. Maximum position size
  3. Emotions

Now, each one of these are independent things but are very dependent upon each other when it comes to using them correctly.  Let’s first look at these individually.

Maximum risk per trade represents the total amount on a single trade that we are willing to lose if the trade moves to our stop loss.  This means that we need to know what our comfort level is and what our stop loss is going to be.  Once we know this we can place our trade.  The general rule is to risk no more than 2% of your account in any one trade.  The key here is that this is the most we should risk which means we can risk less if we feel better about that.  So, if you look at your account and determine 2% is too much then it is ok to risk less.  The way this is calculated is to take the account size and multiply it by 0.02 in order to get the total you will be risking in your trade.  For example, if our account size is $10,000 we would multiply it by 0.02 which means we would lose $200 if we got stopped out.

Maximum position size is determined by first understanding what you are willing to risk.  So in our example above we would be risking $200.  That means if we bought something at $20 and we had a stop loss at $19.80 we are risking $0.20 per share.  I would then take my maximum risk of $200 and divide it by my stop loss amount of $0.20 and come up with 1000 shares.  That means if I had 1000 share and the price dropped by $0.20 I would lose my maximum risk amount of $200 or 2% of my account.  Now we would do the same with the price of currencies or gold but the key is to know how to calculate our position size so we are never in a situation where we are exceeding our maximum risk per trade.

Emotions can be a difficult thing to control but something that needs to be in order to trade properly.  If we allow our emotions to get pushed into the extreme areas of being happy or sad we are letting our emotions get out of control which causes us to trade poorly.  Luckily we can learn to control our emotions by keeping our risk in control by doing what we discussed above.  Our emotions get out of control when our money is not properly controlled.

By learning to control our money management we can control our emotions.  When we control our emotions we can become better traders.  The better traders we become, the more disciplined and consistent we can trade.

Take some time to review your rules for risk management to make sure you are doing it properly.

The Dow Wins Again

Today the Dow Jones Industrial Average recorded its first nine day winning streak since November of 1996 and it set another new closing record high. Isn’t that something?

Now that’s what happened today, but let’s circle on back to just before the sequester was going to take effect. That was the last week of February just prior to the March 1st effective date.  And what were we hearing from our friendly politicians that entire month? In particular out of the White House? We were hearing about all the calamities that would take place in the country if the sequester went into effect. People were genuinely concerned, even frightened by all the rhetoric coming out of Washington. And of course here it is two weeks later, after the sequester has been in effect since March 1st and none of those calamities have come to pass. The worst thing that’s happened so far is the White House tours have been cancelled.

Now why am I bringing all this up? Well, back there in that last week in February, many of our Market Mastery students were very concerned about a lot of the long positions that Market Mastery had recommended, because they were fearful of the sequester, and they were certain that the market was going to drop dramatically as a result of the sequester.

What we counseled them around is that their feeling about that is natural, but inaccurate. Because the truth is, nobody knows what will happen from one day to the next in the market, and whether it will be driven by the news positively or negatively. Oftentimes a company will come out with earnings that beat estimates and the stock will drop. Or vice versa. They’ll come out with earnings that missed estimates and the stock will go up. It’s very counter intuitive sometimes.

So what we counseled our students to do, is stay away from thinking you know something, meaning don’t let your fear and emotions and your thinking get in the way of a good trading method. Stick with your method. So we said, “No, don’t close out those long positions. The method tells you to stay long. The positions are protected by protective stops. But don’t just go in there willy-nilly and close out your positions because you think you know something.”

Most of the time when you do something like that it works against you. And lo and behold, what happened? Those positions are all dramatically more profitable today just two weeks later than they were then. And now our students are thanking us. They’ve learned an important lesson. More important than the profits they’ve made in the last two weeks is the lesson they’ve learned around staying disciplined. Do not listen to the rhetoric, especially from politicians. Do not listen to the rhetoric from media. If all you had to do was listen to the rhetoric from the politicians and the media to guide you on what investments to make, everyone would be rich by now. So obviously that’s a losing proposition.

So stick to your knitting, stick to your method that gives you an edge. Stay disciplined and you should do just fine. 

Price Pattern Basics

Today we are going to spend some time talking about some basics of price patterns.  Price patterns are exactly what it says, patterns formed by the price action on the charts.  Many traders look at price patterns as a primary way to trade in the Forex market as it forces them to look at the most important thing in trading.  This most important things is the action that the price is making.  If we can read what the price is doing, we can get a good insight into what it may do next.  As the price makes certain patterns we can get an idea of what it might be doing in the future.  Knowing what may happen can help us know what we should do next.

There are two basic types of price patterns – Continuation and Reversals.  Continuation patterns indicate that the price is likely to continue in the direction that happened prior to the pattern.  Reversal patterns indicate that the price is likely to reverse and move in the direction opposite than what it was moving.

In addition, price pattern formations use some of the key things when looking at chart.  They use the trend to determine the initial direction, then they use support and resistance to form the price pattern.  The primary way a price pattern is traded it to look for breakouts from these patterns as the price moves above or below the area of resistance and support.

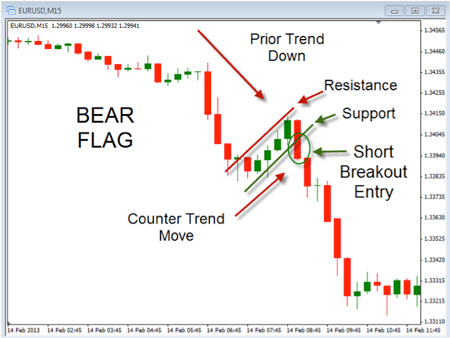
Take a look at a couple of examples of common price patterns.  The first one is a continuation pattern called a flag.

This is called a Bear Flag pattern.  You can see the prior trend was moving down, followed by a counter trend move forming an area with resistance and support.  After the counter trend move you can see the price break to the downside, breaking below support.  This is where you would enter the trade in the direction of the prior down trend.

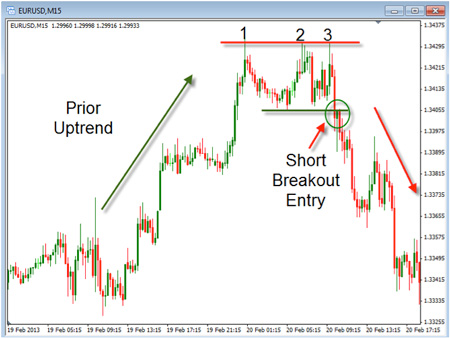
This next example show what a reversal price pattern looks like.  This one is called a triple top pattern.

Notice that the prior trend is moving up followed by an area of support and resistance where the price hit the resistance area three time before dropping below the support area.  The entry price occurs when the price breaks out from the area of support.

There are many types of price patterns that can occur.  These are just two examples of what they can look like.  Other examples can include double tops and bottoms, head and shoulders, triangles, wedges and rectangles to name a few.  Knowing when and what type of price pattern is happening can help us know the direction price may be heading in the future.    Once you understand what these look like you can begin to use them in your own trading.  They can be another tool that can help improve what you are already doing.  The key is that we are looking for the price action to help us know when to enter or exit the trade.  Take some time to review these price patterns to see if they might help you in your trading.