Plan Your Work and Work Your Plan

Many traders trade on emotions instead of rules, especially when the market is moving quickly and they don’t want to be left behind. Trading without a specific trading plan can be a dangerous habit. Many traders don’t have a trading plan, or even a daily checklist. By contrast, many professionals will prepare for the market day before the market opens.

A good trading plan can be broken down into three important parts:

First, the plan would naturally include a trading strategy or method. Any good strategy should include market entry/ exit strategies depending on the markets traded and current market conditions (stocks, options, Forex, etc.) and the various market conditions.

Second, a trading plan should include a specific set of risk management rules with clear and understandable risk levels. This including position size calculations in order to control the risk with each and every position entered.

Third, any good trading plan should include a regular and repeatable routine. The more consistently a trader follows a set routine the more consistently will be the implementation of a good trading strategy. Several traders have told me recently their biggest problem is not finding a good strategy, but implementing a consistent routine is their biggest challenge. Once a routine is carried out consistently, trading success will become much more likely depending on the market strategy.

A routine is best written down as a checklist so that it is simple and repeatable. Each individual trader needs to adapt a checklist to their individual needs. The checklist below is a potential outline that will get a new trader started. Modifications should be made depending on the trader preferences, type of trading (day trading, swing trading, position trading) and trader experience.

1. Check/read newsletters from paid/unpaid subscriptions from signal service, news, analysis, etc.

2. Check the day’s economic calendar for any scheduled reports and announcements for the day – this part covers the fundamental analysis. You will be checking the expected numbers against reports that will be published during the day.

3. Check the charts for price action – this is mainly for a trader who trades using technical analysis. Normally you will check to see if the prices have violated any support/resistance areas. For technical trading, some of the most popular indicators and tools used are:

  1. Support/Resistance areas (daily, week, month)
  2. High/Low/Open/Close and candlestick patterns
  3. Indicators such as Stochastics, MACD, RSI, Momentum, Volume, etc.
  4. Fibanacci retracement levels

4. Write down thoughts while going through the checklist – this step is for the trader to write out trading ideas for the day, how much to risk , where you’ll be taking the position, where you’ll exit, and how large the position size you are going to take.

5. After the trading session is over or after the trading day is complete, it is important to document or journal each trade, with entry, exit, profit, loss, risk in trade, justification for entering, etc.

Once you have a good daily checklist that you are following, it is important to use it by following the plan every trading day. This will help us to be much more consistent traders with hopefully more consistent results!

So, If you don’t have one already, make a written trading plan with a simple, easy to use daily checklist, and keep a daily journal of all trades.

What is Happening to Gold?

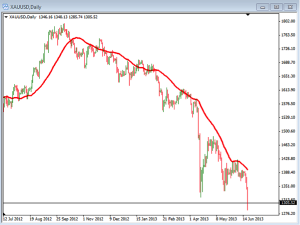
Well the last time we were below the $1,300 level in gold was back on September 28, 2010. Nearly three years of positive moves have been erased. After the FOMC made their comments yesterday we immediately saw volatility come into the gold and silver markets. Currently the price of Gold is sitting at 1301.68 as of this writing, which is nearly $500 off of the most recent high back in October of last year. This represents a loss of about 27% in a relatively short time frame. You can see in the chart below the dramatic move we have seen.

(click to view)

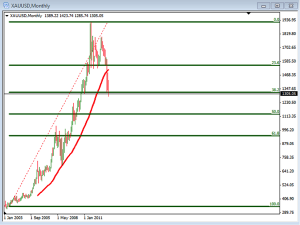
The question we should be asking ourselves is whether or not we should be looking to go long or short gold. If we go short we are looking to take advantage of this move down, waiting for entry point. If we are looking to go long and buy gold we need to wait until the charts show us the price has bottomed and is beginning to move up. If you look at the monthly chart below you can see that gold has consistently moved higher over the last decade. There is no reason to think that it could not continue to do so over the next 10 years.

In the chart below we have a monthly candles along with the Fibonacci retracement levels. Currently the price is testing out the 38.2 retracement. This could be an area where the price finds support and begins to bounce back up again. Remember that this is just a possibility, not a certainty. That is why we will watch and wait to see the bounce before looking to take a long position.

(click to view)

Since most traders and investors are looking to buy gold instead of shorting it, we will wait until we get some bullish moves to do so. You will hear many people talking about the importance of owning gold and silver. This may be true but knowing when to buy it may be the key to profitability. There were many people that bought gold and silver when the prices were at all-time highs, only to regret doing so. Knowing when to buy is going to keep you getting into positions at the best time.

If you are buying gold to hold for the long-term, seeing pull backs like we have now can be exciting. As the price sells off, we are able to purchase gold at a reduced price. We do not know if this is the current bottom or if it will continue to drop more, but we do know that it is at a much better price now than it was back in October of last year. By waiting for good opportunities to buy we can expect to be more profitable over the long run.

If we are trading on the shorter-term, we are likely to look for opportunities to short in this current bearish trend. Regardless of how you are trading gold or silver you need to make sure you let the charts tell you what to do instead of just buying and selling because you feel it is a good time.

7 “Golden” Habits Will Change Your Trading Forever! (Part 2)

PART 2

In Part 1 of the 7 “Golden” Habits, we covered the first three habits, namely: 1. Never risk more than 1 to 2 percent max on any one trade, 2. Always calculate and trade the proper position size for your risk, and 3. Don’t over leverage your account by trading too many positions at the same time. These first three habits are all related to managing your risk.

Now in Part 2, we will cover the last 4 of the 7 habits, as follows:

4. Trade With the Trend

The most successful traders who ever lived are trend traders. Sure, you hear from time to time about traders who have been successful picking tops and bottoms, but that is mostly luck and not very sustainable in the long run. Trading with the trend is actually simpler and so much easier than other strategies. Generally speaking, simpler is also easier to implement and easier to follow. The key is to have a system that just goes for the middle of the trend. The reason is because; again it’s hard to pick the top and bottom (impossible to do on a consistent basis). Trying to trade against the trend may cause you to overtrade and potentially lose when the trend “catches up” with your trade.

5. Don’t Day Trade

Use a good end of day system. It is a well established fact that over 95% of day trader’s lose all their money in less than one year, so stay away from “scalping” and other forms of short term trading, especially new traders who have a tendency to overtrade the markets and not let good trades develop. However, by using daily charts when the market is closed removes 95% of the emotion of trading. Plus it’s nice to trade and have a life outside of trading and the markets. Day trading is much more intense and stressful. Find a good daily swing trading system to start out with.

6. Be a Technical Trader

The only people really pushing long term fundamental trading are the financial advisors or money managers who are looking for more funds to manage and the longer they can lock up your money, the more money they have under management and the more management fees they make. Here is a fact that technical traders have come to understand; all known fundamentals are already factored into the price. So all we have to do it follow price, in fact, simply put, it is all about price anyways. That is what technical trading does, allows us to focus on the price and not get distracted. Now a caution about technical trading, most people make it too complicated with way too many indicators. It seems like some traders believe the more indicators the better, when the truth is that you only need a few indicators. Why? Many indicators are redundant and all indicators are derived from the same thing: price, and that is what really matters most.

7. Don’t be Greedy

When your system says to take profits, take the profits! Sure the trend might keep going without you, and, about half the time, it will. But don’t get greedy, always looking for the last percentage of the move. The old saying “Pigs get fat and hogs get slaughtered” is an old Wall Street saying for a reason. If you are always going for maximum profit you can lose what you have, looking to maximize profits. If you leave some money on the table, that is O.K. Remember, you are going for the middle third of the move in the first place. Be happy with that.

These 7 simple habits may not be complex or difficult to understand, but sometimes they are harder to implement. If they are consistently followed and implemented into your trading routine and trading plan, they can give you a much higher probability of success and lead to a much lower stress and happier trading life.

Candlesticks or Bar Charts?

There are many different types of charts that can be used when we are trading Forex charts. Some of the more common charts are line charts, bar chart, renko charts, range charts and candlestick charts. With all of the different types of charts available we need to decide which types we are going to use. One important thing to remember is that when we are trading we want to make the charts as familiar as possible. With this in mind you can see why it is important to choose a chart type and stick with it. Two of the most common charts that traders use are the bar chart and candlestick chart type. Today we will review both types and you will see the similarities and differences. We will also discuss how to use the candlestick and bar chart and what they really represent.

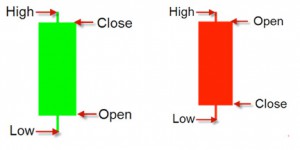
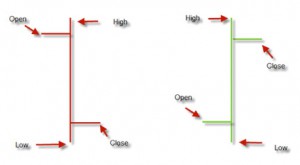
Take a look at the examples below of both the candlestick and bar. The first two are examples of the candlestick chart. The green one tells us the price action for that candle was up. The other candlestick is red, which tells us that the price action for that candle was down. Regardless of the time frame represented by the candle, we can simply look to see whether the movement was bullish or bearish.

Notice that big green candlestick opens at the lower end of the box and closes at the higher end of the box. This is called the body of the candle. The red candle or down candle opens at the top of the body and closes at the bottom of the body. Also take note of the wicks or shadows that stand above and below the body. These wicks represent the high and low of the price action.

Like the candlestick the red one represents a bearish price move and the green one a bullish price move. With the bar chart you will see a single vertical line where the top and bottom represent the high and low price and the left hash line is the open and the right one is the close price.

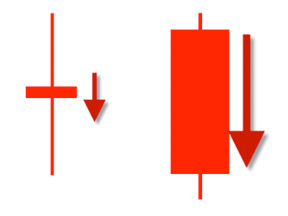
Both the candlestick and bar can give information about the strength or weakness of a move. Notice in the picture below that the candle on the left side has a very small body with very large wicks. This type of candle tells us there was very little momentum pushing the price higher or lower. Compare that to the candle on the right where the body is very large and wicks are very small. This tells us there was very strong momentum during this time. You will also see a similar look on the bar charts.

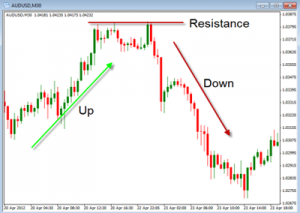
Regardless of which type of chart you use, they can helps us identify the trend and support and resistance on the chart. One of the key components of any chart is to identify the direction the price is moving as well as areas of support and resistance. Take a look at the Candlestick chart below where you can see the areas where trend is occurring and areas where resistance and support is occurring.

Take some time to consider what the bar and candlestick charts are actually trying to show you. As you apply this information from your charts it can help you better determine what is happening and what you may want to do next.

7 “Golden” Habits Will Change Your Trading Forever! (Part 1)

PART 1

For decades the book by the late Stephen R Covey,“7 Habits of Highly Successful People” has been on the bestseller list. Over the years, I have had a couple of occasions to hear Dr. Covey in person talk about how mastering just a few important habits can make a huge difference in a person’s effectiveness and happiness. As trader’s we can do the same thing. A few habits, if incorporated into our trading routines can make all the difference between being an effective and successful trader, or being a failure and quitting after all our money is gone or simply quitting out of frustration. If we can start to be successful by implementing the following habits then that success can build on itself. In the world of money and investing we call this compounding. Einstein called compounding the 8th wonder of the world and I agree. Here are 7 habits that if developed will help your trading to become more effective and more profitable:

Here are the first 3 of 7 “golden” habits of trading. We will finish these in the next installment. In the mean time, work to make these habits part of your trading routine

1. Use Strict Risk Management

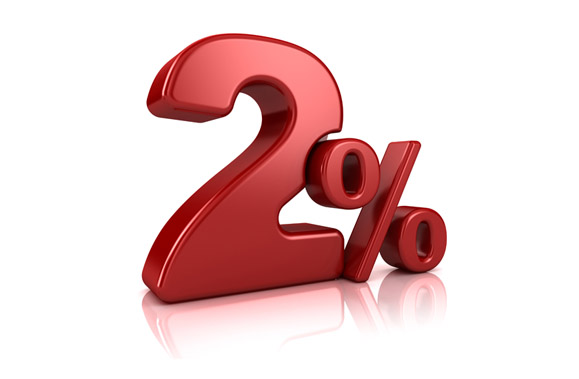
Only risk 1-2% per trade. The reason is simple; at some point in time, it is a statistical possibility that you could have 5-10 losers in a row. It might not be this month or year, but over a 10-year period of time you could have 10 losing trades in a row. If you risked 5% per trade you would be down 50%. To make that up you would then have to make 100%. Risking only 1-2% puts you at a 10-20% loss with 10 losers in a row. That type of loss can be made back in 1-3 good trades. Always use an initial stop loss order that reduces your initial exposure to the 1-2% max loss. Once the trade moves in your favor you can move your initial stop loss to your entry point or breakeven point and effectively reduce your risk on that trade to zero. You can then use a trailing stop to start to protect profits as the trade moves more in your favor.

2. Use Proper Position Sizing

There is more to money management than just using stops or not having too many trades on at once. Those are only the basics. Professional traders do all that, but also use position sizing. Let me reiterate that you must always trade with a stop loss in place to limit your losses. Most people use a percentage risk stop and that is usually not the best level to place your stop. The best stops loss levels are based on the chart using a recent significant high or low level. If you only use only a percentage you may place your stop to tight or to wide for the current market conditions. With the correct stop in place you can then calculate the proper position size for your trade. That is the best way to keep your risk per trade at the proper 1-2% risk level.

3. Don’t Overtrade

There is no need to have too many trades at any one time. Along with limiting our risk to 1-2% on each trade, if we have more than 4 or 5 trades at any one time we could easily over run our risk management and be way over leveraged if several of these trades go against us. So begin by risking no more than 8-10% of your portfolio at any one given time.

Rising Interest Rates – Good and Bad

The US Federal Funds rate has been at .25% for several quarters which is generally considered to be as low as it will go, which means that at some point there is only one way for it to go which of course is up. We all know that this will happen but when it does happen is it good news or bad news? The answer most likely will depend upon which segment of the economy that you belong to. The thing that will make the coming interest rate rise differently than those in the past is due to the Fed’s continued intervention each month; they are artificially propping up the economy which may be just another bubble that will have to burst if they are not careful.

They have already tested the markets reaction to what will happen when their manipulation stops and it wasn’t pretty, however that being said I am a big believer in perception being reality as far as the markets are concerned so of course that means that the Fed’s actions have been the prevailing reality. They have been doing a pretty good job in accomplishing some of their goals which include jump starting the housing market however the goal of creating jobs has been far less successful.

The Fed’s actions has caused the real estate market to begin to move with rising home prices, which of course is great for homeowners but poorer people are less likely to own real estate which creates a divide in the recovery of the populations wealth. The Fed’s actions have also helped the stock market’s advances which again help more affluent people while poorer people are less likely to own stocks again adding to the wealth recovery gap. I’m not saying that any of this is bad or good at this point it just “is”.

The Fed won’t be able to keep interest rates as low as they have been forever and when they do begin to rise the bond market will suffer in a big way, but the stock market may benefit. Since the two major asset classes typically move in an inverse way as bond prices fall money will move out of bonds and into the stock market which could fuel another leg of a rally. Rising interest rates may benefit many retirees whose amount of monthly income from investment dollars is directly tied to interest levels so the portion of the population that falls into this segment of the economy may see increased monthly income and a general improvement in their lifestyle. The rising values in real estate may slow down as interest rates rise and mortgages become more and more expensive so people whose livelihood is derived from an aspect of the real estate business may start to get squeezed when rates rise.

Everything is tied together in our economy like a big story problem where one thing leads to another thing which leads to another thing so typically there doesn’t seem to be one easy or direct answer for anything but generally speaking everything comes back to what will happen with short term interest rates. When the economic news reports come out we’re interested in job creation and inflation and unemployment etc… but the bottom line is that all of these reports are just indicators that help the Fed to determine what they will do with short term interest rates which is how they are able to control just about every aspect of our economy. There is a very fine line between too much Fed interactions and too little and of course there is always someone that is unsatisfied but generally speaking they haven’t done a bad job over the past few years. When they do begin to increase interest rates and reduce or stop their artificial economic support we will see the biggest economic shake up that we have seen in a few years. Like anything else some people will be winners and some will be losers but the bottom line is that everyone will be affected one away or the other.

Current Support and Resistance

Today we are going to look at the current areas of support and resistance for both gold and silver on the daily charts. We need to recognize the importance of identifying these areas as they will generally act as a barrier to price movement. If we can find these areas we will be able to know how to react as the price approaches these price levels.

Support areas are where the price has moved down to a level where buyers are interested in entering the market. The increase in buying causes the price to hold and begin to rise. The areas of resistance is where the price has risen to a point where seller come into the market ready to sell. This causes the price to move back down.

By knowing where these areas are located it can help us know where to enter and exit our trades. They can also help us with our confidence in being able to read the current trends as the higher highs and higher lows can be seen in these areas of support and resistance.

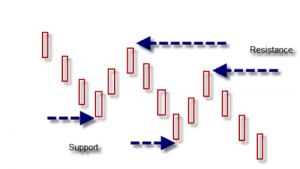
Take a look at this picture below as it show where these areas can be located.

These areas are showing support and resistance on a diagonal line as opposed to the support and resistance on a horizontal line. These areas can be just as effective on the diagonal as they are on the horizontal.

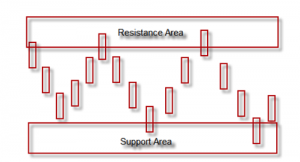
The other thing we need to look at when identifying these areas is that they are really areas as opposed to lines. The market is not so exact that we will see the support and resistance form as areas and not exact points. You can see what we are referring to in the picture below.

When looking for these areas make sure you give it enough room to catch the support or resistance. These areas may be 5 pips or 50 pips depending upon the time frame we are looking at. Now take a look at the daily charts of Silver and Gold.

Gold

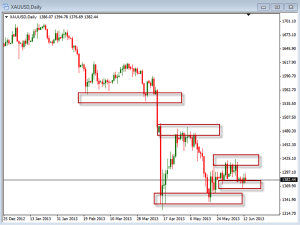
In the chart above you can see the areas where the price had encountered these areas of support and resistance. Currently you can see that the price is being pinched between support and resistance. These areas need to be taken out in order to see either a reversal and move back up or a continuation of the movement down. With this consolidation that we are seeing we need make sure we take it into consideration and look to trade accordingly.

Silver

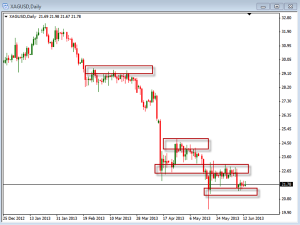
In this chart of Silver you can see the areas of support and resistance currently on the chart. This price action has been similar to gold in that we are seeing price being pinched between support and resistance right now.

On both gold and silver we are seeing the trend moving down but developing several areas of support and resistance where it may be developing a bottom. Keep an eye out on what happens this week to see if this base can be formed, then look for the price to try and move back up again.

How to Achieve Low Anxiety Trading

It seems that the last few weeks, as the markets are in a state of historic highs and dramatic lows, it is reacting to news reports generally concerning the economy. Specifically, the reaction is surrounding manufacturing, housing, and employment. With these news stories, and with the historical highs of the market lately, many traders are feeling increased anxiety. This anxiety may even be causing some traders to consider getting out of the market until the market is more “calm”.

The first thing to understand and remember is that while there are better trading markets than others, there is NO such thing as a perfect market! The market isn’t really good or bad, it just IS. There is nothing we can do to change this. In fact, if the market didn’t go up and down we would not have any trading opportunities. Certainly there are times, when the market is more uncertain than we would wish for. But, if we allow the market to get into our heads we can really find ourselves overly anxious and even discouraged to trade. Trader’s who tend to be preoccupied with catching only perfect trades, and never losing on a trade, end up being disappointed with themselves when they fail to meet these goals.

There is no doubt that during times of market uncertainty, it can lead to fear and anxiety over our trading style and methods. However, if we start to question our successful trading methods, you may start to question the sanity of trading altogether, and you may decide that it is better to sit on the sidelines and not trade at all. During uncertain times, tightening up our stops is a common reaction among newer traders, however more seasoned traders understand that tightening up our stops during more volatile times can be the worst thing we can do. In fact, doing so can almost guarantee that we will lose on the trade. The thought is; if we are going to lose anyway, we want to lose less than we would have under normal circumstances. The only way to absolutely eliminate market risk is to stop trading, however this will also eliminate any opportunity to be successful and make any trading profits as well.

The only real way to reduce our risk is to reduce our EXPOSURE. The best way for a trader to reduce exposure in a volatile market is by reducing position size. Tightening our stops may reduce our potential exposure, but it also increases our probability of taking a loss. So if we are going to reduce our exposure by reducing our position size and we normally define our risk as 2% per trade, then we may want to consider reducing our exposure per trade to 1%.

So, if we are feeling anxious or discouraged because of current market uncertainty, the best thing we can do is NOT to change our methods. We simply reduce our position size, therefore reducing our exposure to the volatility. This will help us control the fear and anxiety that comes from trading in uncertain markets, both today and in the future.

Multiple Time Frames

Today we are going to discuss the topic of using multiple time frames to help us identify the best times to enter the Forex market. This topic in trading is not new and should be at least a bit familiar to you. The idea is that because we want to trade with the trend, we can look to the higher time frames to identify the stronger and longer term trends. Once we have identified these longer term trends, it should give us some additional confidence that the trend is really what we think.

The basic idea of using multiple time frames is that once we identify the chart we are using to find entry triggers, we would then look at the higher time frame chart to see the that trend is. So, if we are trading a 5 minute time frame chart to enter trades we could use the 15 minute chart to confirm the trend. Using this longer time frame and making sure it is moving in the same direction as our shorter time frame will give us the added confidence we may want to take a trade. This idea of longer time frames can be used with any trading. So, if we were long term traders we could look for entries on the daily charts while confirming the trend on the longer term weekly charts.

Take a look at the example below looking at multiple time frames:

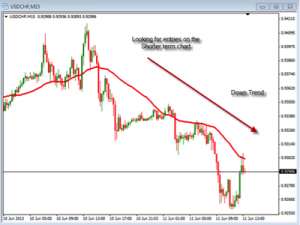
Figure 1

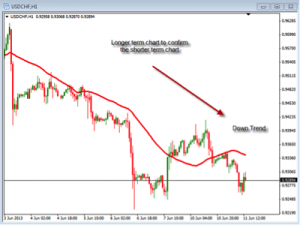
Figure 2

In this example we are looking at the 15 minute chart and the one hour chart of the USDCHF. Figure 1 is the shorter term 15 minute chart which shows the overall trend moving down. The 40 period simple moving average is pointing lower which indicates that the price action has been moving lower. With the trend moving down on this chart we would begin to look for an entry to go short. Currently it is sitting near the moving average which may act as an area of resistance. Once we see a potential entry we can then look to confirm it with the longer term chart. Figure 2 is the one hour chart which is also showing downward moving 40 period simple moving average. This would confirm the overall direction the price has been moving. With both the shorter term entry chart and the longer term confirmation chart moving in the same direction we should feel better about entering this trade.

Again, this can be done with any two time frames that we are trading. Some of the common time frames might be a 5 and 15 minute chart, 15 and 60 minute chart, 60 and 4 hour chart and the daily and weekly chart. Take a look at these time frames to practice this concept of multiple time frames.

Take some time to look at your trading rules to see how this concept might improve what you are currently doing. By adding this one simple step you might just add that additional confidence you need in your trading.

Instant Options Income is LIVE!

Instant Options Income is LIVE!

Make sure you watch the ENTIRE presentation right here — it
reveals some BRAND NEW, SURPRISE EXTRAS you’re going to get when
you enroll in the program today…

This is priced low enough so that pretty much everybody can
give it a shot; but it looks so good, that I think the price
will likely double in the future, so if you’re ready to add on
another safe, predictable income stream, go and get this NOW…

Good Trading,
Bill Poulos