What is Risk?

Today I want to spend some time discussing the topic of trading risk. This is a topic that we should all understand and be familiar with. So the question we need to answer for ourselves is, “What is risk?” For some, this may mean something different than for others. We have to be able to answer for ourselves what risk is. If we don’t know, we need to figure it out. Once we do know what risk is we can then learn how to control it. Hopefully, we can give some ideas of what risk is all about so you can better understand and control it for yourself.

In the market there are only a few things that we can control. We cannot control the market or what other traders are doing. One of the few things that we can control is the amount of money we put into our trades. There are several things that we need to discuss so we can better know how to control our risk. 

  1. Defining Risk: Each time we take a trade we need to figure out how much risk we are going to take in that trade. This risk is usually defined by determining a percentage of our account we are going to risk. The maximum amount that should be risked is 2%. You can risk a smaller amount if you think this is too much.
  1. Justifying Risk: In order to justify the risk we are taking we will need to have a reason why we are taking the trade. For example, we need to have a reason why we would place a stop loss at a specific point on the chart. That reason may be as simple at using a moving average or looking for the past swing low or high. Once we have the evidence to put our stop loss at a specific point we can then know the amount we are risking 
  1. Quantifying Risk: This is where we make the determination of the position size we are going to be using when placing the trade. By looking at your defined risk in correlation with your stop loss you will know exactly how much you will be buying or selling. Using the examples from above if we have a 2% risk we know we can only buy enough that we would never lose more than 2% of our account size. If that 2% equaled $200, then we would only buy the amount that would keep our loss below $200 if we got stopped out.

So, in helping answer the question about risk, we need to be the ones that make all the decisions about our risk. We first need to define what it is, then justify taking the risk and finally determining the size we will be trading to keep our risk under control. Take some time to look at the process you go through to determine your risk in each trade. If you find you are taking too much risk, then lower the amount you are risking in each trade. Risk management is one of the most important things you can learn and incorporate into your trading.

ETF Investing – Where Do I Start?

Last time I discussed the advantages of ETFs over Mutual Funds. Today I would like to expand the discussion to the many choices you have when investing in ETFs.

Within the ETF world, there are a huge range of choices. I am often asked, “Where do I start?” and “Which ETFs are right for me?”

There is such a broad range of ETFs, investors new to them have a hard time understanding where to begin. My suggestion is to always start with things that are familiar and understandable. Then as you gain confidence, branch out to other things as your portfolio warrants it. So the best way to get started is to become aware of what is available.

Generally, I separate the ETF market into three broad categories:

Equity Index ETFs
Bond ETFs
Commodity ETFs

Within each broad category, there is no shortage of creativity on the part of the issuers. There are bull market ETFs that follow the uptrend of the market. We have bear market ETFs that are constructed to follow the downtrend of the market. We have ETFs that are leveraged 2 and 3 times to double or triple the market’s average move. There are Index ETFs where you have large caps, med caps, small caps, international index funds and emerging market funds to choose from. The choices seem almost limitless and, just when you think you have it all down, more ETFs pop up, especially on the international scene; while the US ETF market is fairly mature, the international markets are just getting started.

My best advice to those getting started in ETFs is first, start with something you know and are familiar with. If you are involved and have knowledge of certain industries, say “high-tech”, look at one of the Technology Sector ETFs. If you follow macro economic factors, a good index fund could be the place to start. If you are looking for international growth, look to one of the established international equity index funds. Secondly, make sure you know the “true” objectives and goals of the fund. With so many ETFs now available, be sure to check out the fund’s holdings with a little bit of research. Sometimes the official title of the fund can be a bit generic or the funds can alter their course from their original objectives. You can find out much about a fund with a 1-2 minute internet search and can save a lot of second-guessing and stress down the road. Also, a word of CAUTION concerning “Leveraged ETFs” – some have performed fabulously in the most recent market run up, but, as always, what goes up quickly can come down just as fast when the market reverses and all your profits can quickly turn to losses. So BEWARE!

Like any investment, you need to, first, identify your investment objectives; make sure your objectives are clear and practical. Second, do your homework to make sure what you are investing in will meet your clear objectives. Third, spread your risk around by diversifying as best you can so that you are not putting all your money on one or two ETFs. Portfolio Risk Allocation rules should be used when investing in any market, including ETFs. And fourth, have fun with the huge variety of choices; ETF investing can become enjoyable as well as profitable.

Technical Indicators – A Self-Fulfilling Prophecy

A common question that I am regularly asked is, “How many technical indicators are enough to use on a chart to determine when to enter and exit the market?” My first thought when someone asks this question is either as few as possible or none at all. Another very common question that I hear is, “Which technical indicators are the best?” My first thought when I hear this question is that none of them are great. This may make it sound as though I am a bit cynical when it comes to technical indicators, but that is not really the case at all. I use them just like everyone else does, but I have noticed that recently I am using less and less of them and, in some cases, I do not use any of them at all.

I have noticed over the years that having technical indicators on a chart skews your thinking, which of course is what they are meant to do; however, this can lead you to believe that you actually know something about the market, it leads you to believe that you have an idea of which way the market is actually going. Giving up the notion that you know something about which way any given security may go is very freeing. When you come to the point where you can free your mind of any thought that you may have that you may actually know anything about which way any market may go at any given time is likely when you may begin to be a consistently successful trader.

When you enter a market based on what your technical indicators tell you, regardless of the direction of your trade, you are making a prediction about which way the market will go. Since technical indicators are lagging indicators, meaning that they cannot be created until the price has already occurred, by the time you see them and try to apply them they’re already late. When you look at a 50 period moving average on a chart, do you really need to have that average on the chart to tell you if the last 50 bars have been generally going up or generally going down?

If the most common way to use a specific indicator is used the same way by most traders, is the indicator itself actually important or is it important just because so many traders believe it is important? If you have the stochastic indicator on your chart and you see %k is above 80, does this means that the security is overbought and should come down? If that is the conventional wisdom around this indicator, when this occurs, some traders will place sell orders to close out long positions, while others try to enter the market short. Either way, downward pressure is put on the stock due to all of the sell orders, so of course the stock goes down. Conversely, if %k is below 20, do traders exit shorts and try to enter long putting upward pressure on the stock? What do traders do when the Bollinger Bands are breached? Fibonacci levels are used for stops and entry orders on a regular basis, are those levels really important or are they important because we say they are important?

I believe that if you remove all of the indicators from your chart and you sit and watch the price action for an extended period of time, just watching the price action alone will tell you more about the direction that a security will likely go than most of the common indicators that are used. If any indicator or combination of indicators was so incredibly accurate that it could get its user on the right side of market moves before they ever happen, the person who created the indicator would be instantly famous; they would be on all of the news shows and all of the talk shows telling everyone how they can use the indicators to make themselves rich. I guess that since everyone says that they want to be rich everyone would use the indicators in the prescribed way, which would lead to the next previously asked question, “Is the new way of using the indicators actually any better than any other way or is it better because we say it is better?”

Divergence

Today we are going to look at one of the basic price actions we can see when looking at charts. Divergences are used to look for possible changes in direction of the price action. If the price has been making higher highs and there is a divergence, we would look for the price to begin to drop. If the price has been making lower lows and there is a divergence, we would look for the price to begin to rise. Because price action is so important in technical analysis using divergences can help us in reading the charts a bit better.

With gold and silver we have seen a major drop in price over the last several months so looking for this key price pattern may identify when the prices will move back up again. So, in preparation for this time we will review the basic concept of divergences.

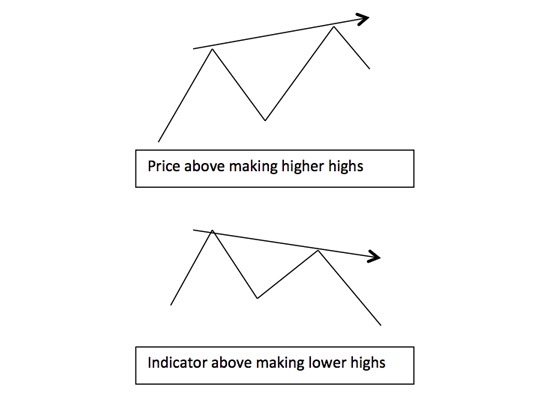
A divergence in its most simple form is when some indicator is moves opposite the price action. So if the price is making higher highs, the indicator would show lower highs or if the price is making lower lows and the indicator is making higher lows. Take a look at the pictures below.

The pictures above show what a bearish divergence would look like. This would be what you might see when the price has been moving higher followed by the indicator putting in a lower high. The reverse would be true for a bullish divergence.

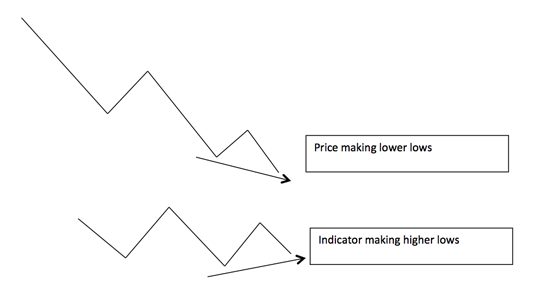
A bullish divergence is what we are currently looking for with the price action on gold and silver. In the chart below you will see an example of what we might see when the price of gold and silver begins to move up again.

Notice that the price has been making lower lows while the indicator made a higher low. This might be the situation we see as the price of gold and silver begins to reverse. Keep an eye out for the time when the divergences begin to show up with both gold and silver.

As you know there is no guarantee that just because there is a divergence that things are going to change direction but it is an indication that there may be the price changing direction. This means that when the divergence occurs we need to look for confirmation that the price is going to reverse. Generally we will look for the price to begin to show upward or downward movement before we act upon the divergence. For example, if we see a bullish divergence like shown above, we would look for the price to begin to move higher. This could be a break out of the resistance area or a move above a moving average or the moving average begins to move back up. Regardless of what we use we need to make sure we have the confirmation there to take action on the trade.

Take some time to look for divergences to see how you can incorporated them into your decision making process.

Why Trade Exchange Traded Funds?

Exchange Traded Funds (ETFs) are not new, they have actually been around for about 20 years, but they are certainly getting a lot of attention lately. This is due to the ability for an individual investor to easily combine index and sector investing with the convenience of the individual stock ownership. ETFs are a collection of shares that follow a particular index, industry, or a commodity like Gold or Silver, or like a traditional Mutual Fund does; however, that is where the similarity ends.

There are several advantages ETFs have over Mutual Funds for investors interested in equity funds because of the fundamental difference that ETFs trade like individual exchange traded stocks as opposed to Mutual Funds.

The Differences Between ETFs and Mutual Funds:

  1. When a new investor buys shares in a Mutual Fund, he or she pays the end of day Net Asset Value (NAT). Since ETFs are traded on the exchange, they act just like any individual stock issue and can be purchased any time at the current price during the market hours.
  1. When an investor purchases shares in ETFs, unlike Mutual Funds, they may use the same kind of orders used when purchasing individual stocks, like pending limit orders, pending stop entry orders, stop loss orders, and take profit limit orders just like stock trading. This ability to trade an ETF just like a stock is a great advantage for more active swing traders allowing them to apply many different trading strategies to their ETF positions, something that just can’t be done to Mutual Funds. In addition to applying order types, with ETFs, you may go long or short, just like stocks, again, something you can’t do with Mutual Funds.
  1. With exchange traded funds, an investor may also buy long or sell short any number of shares that he or she would like to, even down to one share, if desired. This is a real advantage for the investor with a small portfolio, as many Mutual Funds have much higher minimum purchasing requirements.
  1. For investors with experience trading options, you can trade puts and calls on many ETFs, just like any other optionable stock.
  1. The management fees are generally less in the ETF world, as they just need to pick the basket of shares that follow their sector or specialty and are much less likely to have highly paid fund managers.

Here is the summary of the major differences between the two kinds of funds – ETFs and Mutual Funds, in a nutshell. For the active trader, I think it is fairly easy to see the real advantages of trading Exchange Trades Funds over Mutual Funds. Also, many say that there are tax advantages to ETFs. This is a complicated topic that the Mutual Funds and ETF industries don’t seem to agree upon. All I know is that if we are successful and make some money, just like “death”, Uncle Sam is always going to get the taxes in the end.

Weekly Trading Charts

This week we are going to look at the longer-term charts by using the weekly time frames to get a better sense of what is happening with the “bigger” picture. Whenever we are looking at these bigger time frames we are trying to determine the stronger or longer-term trends and support and resistance for these time frames. Knowing these things will help us better determine how we can trade the shorter time frames. We do not want to be buying at the long-term resistance or shorting at the longer-term support areas.

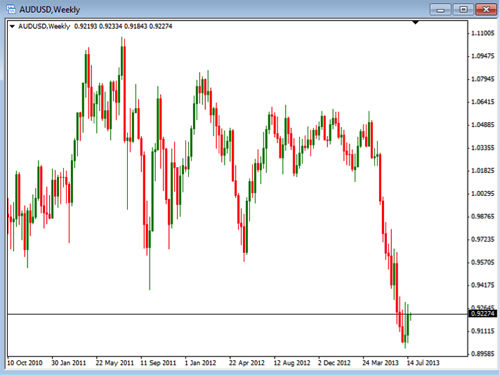
So with that said we will begin with the AUDUSD chart:

AUDUSD: There are a couple of things we can identify with this chart that may be important for our trading. The first thing we should look at is the current trend. In this case we can see the extreme downtrend this pair has been in over the last few months. With this big move we need to consider the fact that there will be a point where the price will bounce back up. The question is where and when that will happen. Of course we do not know the exact time or place but with this big move down we know it is getting close. As we see the price confirming the move back up that is when we know the downtrend may be over.

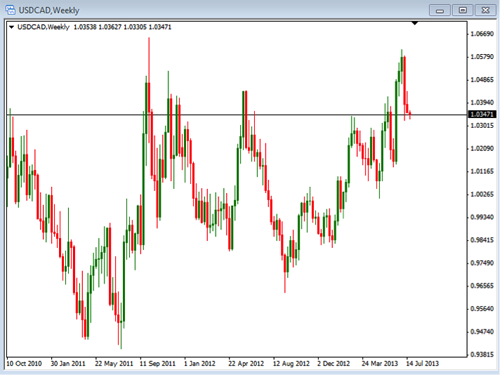
USDCAD: With the USDCAD chart we can see that the price has been making higher highs over the last year. This uptrend price action is currently pulling back to the area of support where we may be getting another upswing that we could trade long. In addition, we need to consider the fact we are nearing the prior highs which can act as an area of resistance.

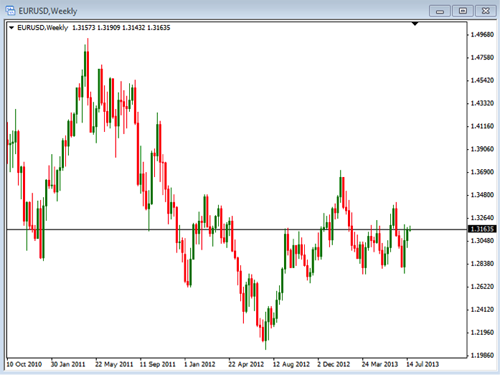
EURUSD: As opposed to the prior two charts the EURUSD is currently in a consolidation phase where it has been moving in a tight range between the support and resistance. This does not mean we cannot trade this, but we need to make sure we understand the range may be small right now. We will also watch for the price to break out of this range and begin to trend again.

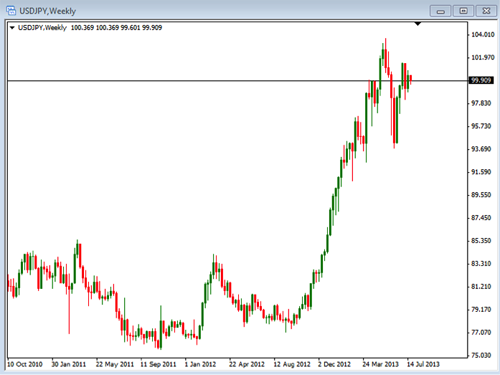
USDJPY: After several years of sideways movements the price over the last has become very bullish and moving higher. With that being said we can see that the price has just put in a lower low and lower high so that it is making a bit of a triangle formation. We may see that this continues to form so we will wait for the consolidation to form or break in order to take some trades.

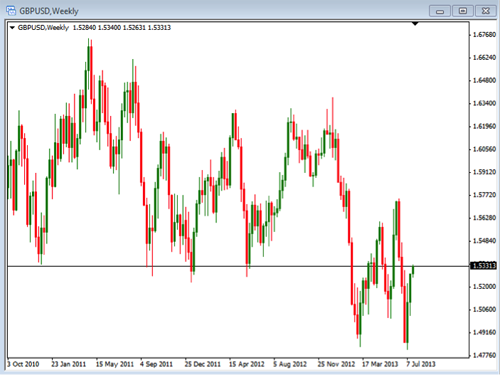
GBPUSD: With this pair we can see a bit of a downtrend with the most recent lows forming an area of support. Currently the price has been moving up over the past few weeks but now sitting near the resistance area formed from the prior area of support back in 2010 and 2011. This could be an area where we see the price being to move back down. Should the price break above this area we may see as bit of a stronger move higher.

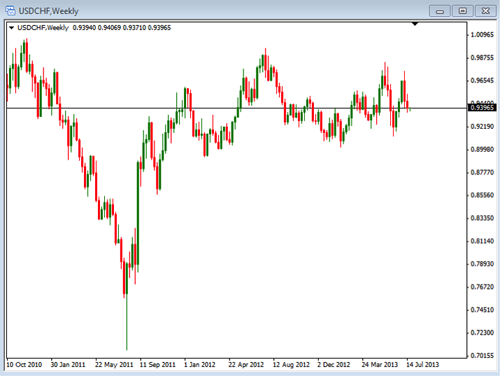
USDCHF: Because of the inverse relationship of the USDCHF and the EURUSD we can see the price moving in a similar fashion. As the price moves sideways we need to look to trade in a tighter range, once it breaks out we will look for some stronger moves up or down.

So, take some time to use these longer time frames to help you identify the direction you may want to trade on the short term. Knowing this will help you trade with the overall direction of the markets.

Swing Trading vs. Buy and Hold Stock Investing (Part 2)

In Part 1, we discussed how traditional long term “buy and hold” investors have lost over 12 years of potential growth. For those ready to take more control of their trading, there are several elements to an active swing trading system that should be understood.

First, a trader needs to have a good electronic broker. There are many good brokers to pick from and most will work just fine. But I would recommend, if you don’t already have a good electronic broker, that you do some research (which has never been easier) into several brokers and look at their trading platforms with an eye on ease of use. You would never buy a car before taking a test drive, so take several brokers for a similar “test drive” with their virtual or paper trading platform to get a good feel for live trading with them. Next, compare trading fees and other maintenance fees between several different brokers. And lastly, avoiding the “no-name” broker is best. In the brokerage business, reputation counts for a lot. So, if possible, look for recommendations from other traders.

Second, after you have selected a good electronic broker and have them set up and funded, you need to find a good swing trading method. I use the word “good” on purpose. There is no “perfect” trading method that works perfectly every time. So the trick to successful trading is to find a good method that is solid over time and take into account different market conditions. For example, some methods have a tendency to overtrade and work great when the market is trending, but then you give back most, if not all, of the profits when the market is ranging. A good trading method will outline specific entry and exit points based on specific price action or price patterns. Skip any trading system or method that doesn’t offer easy-to-follow entries and also a good method for identifying exits. Along with a trading method, which includes specific entry and exits or targets, a good overall trading plan also needs to have specific risk management rules.

Risk Management is one of the most critical elements to a good trading plan, as the market will always have some unpredictability to it. Following specific risk management rules will help to limit our risk or exposure to the markets. Generally, a good trading method would incorporate specific initial stop loss points, which would specifically identify our initial exposure when a trade is initiated, and then have some general rule for risk exposure of individual trades like 1 to 2% risk and then some general overall risk rule like 8- 10% of total risk at any one time, for example. The key to risk management is have specific risk rules that are clear and then applying them consistently no matter what the market conditions.

While the transition from a traditional “buy and hold” investor to a more sophisticated daily swing trader may feel overwhelming, the key element is to get a good plan and method that is easy to follow and incorporates overall risk management. I recommend a medium term swing trading method that can be traded on a daily basis. This allows for more control of your trading without having to spend all day trading. A mid-term swing trading method generally would have trades that last several days to several weeks. So much of the time spent is reviewing and maintaining positions instead of just jumping in and out of positions.

Lastly, a good system should be easy to understand and easy to implement. Many trading systems look good on paper but are not realistic or practical in real life because they are very hard to actually follow or maintain. When looking for a trading system, look for good support or education which would allow easier implementation and more probable success.

Fundamental or Technical Analysis?

When we hear about the different types of analysis that are typically done by traders we always hear a lot about technical analysis, which may likely be because it provides us with something that we can actually see and follow on our charts, it seems as though it is tangible. It makes us feel good to put moving averages and our stochastic and a whole host of over 100 other indicators that we have to choose from on our charts. Technical indicators are based on price, which of course is something that is continuously changing and, therefore, makes technical indicators lagging indicators. They cannot exist at a specific point in time without the price action of the security occurring first. So, unlike the question of which occurred first, the chicken or the egg, we know that the price has to occur first or no technical indicator can exist.

 The other type of analysis that we hear a lot less about, though many investors employ it regularly in their trading, is fundamental analysis. This is the analysis of non-statistical events such as how a strike will affect a company’s production, what will an earnings announcement and financial reports do to a company’s stock price or what happens when interest rates change? If anyone ever tells you that government economic reports are not a factor in how the equity markets act and move they are simply not paying attention. Different markets will be more or less sensitive to particular types of economic reports, but generally speaking, as a whole, they are not something that should ever be ignored.

We basically have two types of analysis – fundamental and technical; one uses past information and the other uses information that typically cannot be accurately predicted even though we know when the events will occur and many people try to make predictions around them. It seems that it should also be pretty clear that using one type of analysis isn’t enough so how do we merge the two and which one takes precedence over the other?

The two types of analysis can be married together and work harmoniously with each other if they are both used when needed, but not necessarily used at the same time. As the price action of a security moves throughout any given day or any given time period technical indicators can be effective at giving us an idea of where the price action is likely to go. However, when a major news event is about to occur, regardless of if it is company specific or a government economic report, we may consider abandoning our technical analysis in favor of fundamental analysis until the event has passed. Some news events will pass with virtually no noticeable effect at all on the markets and specific issues, but some events will cause a lot of volatility in the price action. It can be difficult to tell which events will move the markets and which will not, so it isn’t a bad idea to be ready when all of them occur.

I have heard countless investors state that their technical analysis will get them on the right side of news events the majority of the time, but my observation is that is only true for events that have very little effect on the markets. When a news event causes a huge and quick rise or fall in the market the technical indicators that led up to it really have a 50/50 chance at being right; it is more luck than anything that they just happened to be in a position that was on the right side of the move. The indicators can also be thrown off for an extended period of time after the event, rendering them ineffective until enough time passes since the event has occurred. If we are watching a moving average, or just about any other technical indicator, and a huge move occurs in the price action that move will be reflected in the moving average. The average, however, will be skewed by the volatility, so, from that point, until enough time has passed to filter out the event, the average isn’t very helpful.

Traders that strictly use technical analysis or strictly use fundamental analysis with no regard to the other type of analysis will likely get hurt and experience losses by doing so at some point. From a common sense standpoint they both exist. So ignoring one type of analysis altogether makes virtually no sense at all. We just need to be able to determine which type of analysis is appropriate for the given situation based on current events.

This Week in the News

Although, as traders, we often time consider ourselves technical traders we need not forget the impact that news events can have on our trading. As technical traders we spend time looking at charts and analyzing various indicators to help us decide if we are going to buy or sell a specific currency pair at a specific time. When we jump into the fundamentals we are looking at economic conditions that might suggest a specific currency might be stronger than another currency that it is paired with. Regardless of the importance we put on technical vs. fundamentals we need to realize that news can throw everything we thought out the window.

If you have traded for any length of time in the forex market you will recognize the fact that what you think should happen doesn’t always work out. You may have a certain indicator that suggests the price should go up and the next thing you know it goes down, you may find some fundamental data that indicates that the one currency should be stronger than the other but then the price does not move accordingly. Likewise with the news, you may find a specific report comes out better than expected then the currency weakens when it should strengthen, or vice versa. In addition, you may find your technical and fundamental information all points up, but when news comes out the price move opposite the direction you thought.

The truth is that news can cause the market and pairs to move in an unusual manner and is something that we need to be aware of, if only to recognize that there is new being released. Since the only thing we can consistently predict about news is the actual release time, we should make sure we take caution when we know the news is coming out. This might mean we close our trades or avoid entering into new ones prior to the release time. Or it may mean that we cut our position risk in half prior to the news coming out. Either way we need to be aware of the news time and keep our risk at an appropriate level.

With this in mind, it is a good idea to take a look at the upcoming week prior to our trading for the week. This means we can look to our broker or other news sources to find the reports as well as the release times for the reports. Doing this at the close of trading or prior to the next week will keep us informed as to what we can expect. So this week we have the following major news items coming out during the US market:

Monday, July 15 – Retail Sales numbers
Tuesday, July 16 – CPI Numbers
Wednesday, July 17 – Building Permits
Thursday, July 18 – Philly Fed Manufacturing Index
Friday, July 19 – G20 Meetings

Now, this is not all of the reports for the US but it give an idea that there are usually some type of report that comes out each day. You will want to take some time to review the rest of this week’s news for the US as well as the other times for the days. Finally, remember that there are certain news releases that can be more volatile than others. Reports like the FOMC, Non-Farm Payroll and Housing numbers can be considered major reports. Take some time to better incorporate news into your overall analysis and you will find you will become a better trader.

Swing Trading vs. Buy and Hold Stock Investing (Part 1)

For the investors who were betting on the “buy and hold” strategy to increase their portfolio over the last 12-13 years, they’re about even and have lost more than a decade of growth! One contributing factor to this slow down in overall growth are the almost continual bubbles and market corrections that keep happening. First, the Internet bubble at the end of 1998, then the attacks on the World Trade Center in September 2001 and the recession that followed, then the Real Estate Bubble in 2008, now we see a the debt bubble building and getting ready to burst. These bubbles create a lot of volatility in the market which leads to market swings to trade. And there doesn’t seem to be an end to these bubbles in sight. Because of these “bubbles,” the market has had tremendous movement over the past several years.

While Wall Street still won’t admit it, it is time to declare buy-and-hold stock investing era OVER, as a viable way to make money in the long run. The best strategies over the last 12 years have been swing type strategies that take advantage of both the up swings and down swings in the market by both buying in the up trends and selling short in the down trends.

Swing trading has also become much easier and less expensive with the maturing of the internet over the last few years, giving “active” swing trader’s easier access to online brokers and broader investment choices like ETF’s, cheaper commissions, and cheaper, easier to use trading tools.

Many traditional investors hesitate to look at other more active methods because at first it sounds too complicated to understand and there are concerns when they hear the words “more active” or “shorter term trading method,” because there is a belief or a mindset that has been ingrained in investor’s minds and it is believed that short-term investing is more risky, that it is more complicated, and that it is more time consuming than long-term “buy and hold” investing. When trader’s think of shorter term trading they think of people intensely “day-trading” for hours at a time, but there are good alternatives to buy and hold investing that do not involve the intensity or the time commitment of day-trading. A good alternative to both long-term buy and hold trading and very short-term day trading or scalping is what I refer to as mid-term swing trading or Daily Swing Trading. A good mid-term swing trading method that can be implemented on a daily basis will allow you to follow and to take advantage of the ups and downs or the volatility that we have found more recently in the markets.

Remember this: The person who cares the most about your portfolio is YOU! So with a system that best fits your investing goals, you are the best person to manage your investing or trading decisions. This can be done without an old school broker or a mutual fund company that wants to manage your money and have you to leave on deposit for years at a time.