Managing Winning Trades

From a conceptual standpoint trading is very easy in the respect that anytime you enter the market you have a 50/50 chance of making money because at some point the market will only go up or down. Finding a good entry point to get into a trade is really not that difficult to do, only enter in the direction of the prevailing trend and allot of traders will wait until specific common indicators such as moving averages are cleared which of course is one of the things that makes them common and also one of the things that makes them get cleared. Losing when trading is also easy because all you have to do is set your protective stop, if a trade goes far enough against you the stop will be reached and you will exit the trade, this is not complicated. The more difficult thing to do is to manage open positions that are moving in the direction of your trade, that are profitable, and that have a legitimate chance of making you money.

It seems as though the longer you are a trader the more the realization sets in that the entry point is very important but the management of profitable trades and their exit points are at least as important and in fact may be more important. Any trader that believes that they can consistently get into a trade at the very beginning of a move and back out at its very end is likely to be very inexperienced. My experience tells me that the entry for many traders is far more consistent than their exits. The reason for this is because to enter the market with any given method there are certain things or conditions that must occur. If A, B, and C happen we place a particular type of entry order however once we enter the market we obviously still must exit preferably with as much of a profit as we can capture.

I believe that one of the most consistent ways to do this is to determine ahead of time how much of a profit are we looking for. Are we looking for a specific dollar amount or a specific number of points or pips or a specific percentage? If we are looking for something specific how do we handle it when the price action comes within a fraction of meeting our profit target and turns around on us never reaching that level again on that particular move? How do we handle it when the price action rockets through our profit target and we see that we could have realized several times the profit that we actually did? When either of these things happens to us are we emotional about it or are we following our rules with no regard to what variables may occur? Will these events cause us to constantly adjust and change our exit strategy or are we disciplined enough to follow our rules?

I have the chance to communicate with many traders on a regular basis with all levels of experience and it seems that most traders exit strategies for profitable trades varies and is largely based on risk aversion. What I mean is exactly how much unrealized profit that is currently in a profitable trade are they willing to risk. Many traders will get very uncomfortable and jittery when their trades are profitable because though they want to maximize their profit they don’t want to stay in too long giving allot of it back if the price action abruptly turns on them. Looking for A, B and C to occur before entering a trade is fine and it actually works however once you are in a trade and you have a specific entry point to deal with getting out when D, E and F occur is much more difficult. The reason is that all we need to have happen for us to enter is that our entry conditions are met regardless of the price level, however, once we have the established entry price our exit conditions will not always occur at a time when our trades will be profitable or to the degree of profitability that we are looking for. This is the reason that our entries can be much easier and much more consistent than our profitable exits.

Some traders will use a consistent number of points, pips, dollars or percentages and some will use a floating stop letting the price action dictate when they exit. Regardless of which theory is used to exit a profitable trade what I notice is that even the best exit strategy works a good amount of the time but it won’t work all of the time which is what can cause us to make changes and adjustments that for the most part are probably unnecessary. Once you determine which exit strategy works best for your style of trades and trading use it consistently, if it is a good exit strategy it will produce consistent winning trades while limiting the losses on the losing ones.

Keeping Things Simple

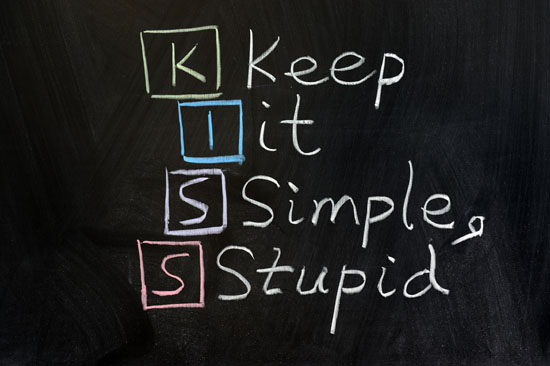
With all the craziness that is going on in the markets today, it is often good to look back and make sure we are not overcomplicating things. It is easy to make things more complicated so we need to look at what is really working for us and what is not. Many times new traders feel that the more indicators they can use the better traders they will be. This often times leads to a more confusing way to identify entry and exit points and can lead to trading unsuccessfully. In fact, if you look at many successful traders you may find that they only look at price action to determine when they should enter and when they should exit a trade. Now you don’t have to eliminate all of your indicators, just make sure that the indicators that you use are helping you in your decision to buy and sell. Today we will be looking at some ways we can simplify our trading process so that we can truly keep things simple.

When trading any trading system there are a few things in common to all of them. This list below can help us keep things simple by following the basic rules for developing a trading system.

  1. Determine the trend
  2. Determine support and resistance
  3. Determine entry trigger
  4. Determine exit trigger
  5. Apply appropriate risk management rules

As we apply these things to our trading system, we will be focusing in on those things that can help us successfully trade the markets. Anything more than this just makes trading more complicated.

As we begin developing are trading system, the first thing we want to look at is how to determine the direction or the trend that is happening on the charts. This can be done in many ways and there are many indicators that can help us identify this direction. Using all of them will not be productive, so we need to identify a simple way to determine if the trend is moving up or down. We won’t go through all of the indicators, but consider using a moving average or just looking at the price action and seeing if it is moving higher or lower.

After identifying the trend, we will want to look at the areas of support and resistance. This can also be identified by looking at moving averages or looking in the past at the highs and lows made by the price. There are also many indicators, such as Fibonacci retracements and pivot points, that can help identify these areas. Again, make sure that you are using only what is needed to give you the information that you’re looking for.

Determining the entry trigger and the exit trigger can be done in many ways and with many indicators. Take some time to review the indicators you are using to make sure that they have a reason to be part of your trading rules. If they do not, then get rid of them! Try to get the most information with the fewest indicators so your charts can be easily read and simple to understand. As you try to simplify your trading process, you will find trading much more enjoyable, as well as successful.

The Importance of Consistency

Today I will discuss the importance of establishing and following a consistent trading routine. When we think of a trading routine, we think in terms of: when we trade, what we trade, how we trade, where we trade, and, even, why we trade. In order to trade successfully, is it important to have a trading routine, but not just any routine is good enough. One needs to be developed that is best for your individual circumstances and situation. Whatever routine you decide on, it has to be one that you can continue to follow for the long run.

In other words, it must be practical! For example, if you are have a system that works well trading Forex at the London open, but you reside in the United States, you will need to arrange your schedule so that you are consistently available to trade very early in the morning, as the London Forex markets open at 2 a.m. EST. If staying up that late is a challenge for you, then it may be more practical to adjust your trading system and routine to trade the Forex on the US open, which is at 8 a.m. EST. The key to implementing a successful routine is to make it practical so we can follow through and be consistent with it.

One important key to deciding on a routine is what style of trading you like. For example, if you are planning on trading Stocks or ETFs on a daily position basis, you will need far less time than if you want to “scalp” trade the Forex market, which requires an exclusive block of time, at a set time per day, every trading day. So understanding what kind of trading style and what markets you are interested in the long run will help determine what routine you eventually decide is the best for you.

So, like “the chicken and the egg”, I am not sure what comes first or is more important, the system you use or the routine you follow, but one thing is for certain, without a consistent routine, regardless of how good your system is, the chances for trading success is greatly diminished. In other words, you could have the best system available, but without a consistent daily trading routine to follow, you will have trouble implementing that system. Like anything worthwhile in life, constant effort and energy is required to make it happen.

The other important element of a consistent routine is the advantage it will give you to make sound, logical trading decisions. Consistency is the key to sustaining a good trading plan and good trading psychology. If you are not following a good routine, you will have a tendency to allow emotions rule your trading and sabotage your trading success.

To me, the most important thing about a trading routine is to make sure that whatever you decide it is, pick something you can stick with. Whatever your routine is, you should WRITE IT DOWN and STICK WITH IT!

Setting Your Goals

Many traders set goals that are grand in nature and can be difficult to achieve without continued monitoring. No matter how much we want these goals to be achieved, without constant work they are likely to be forgotten.

With this in mind we can take action to keep our goal alive and well. It is up to you to keep your goal active. Regardless of what your goals are you need to have a process that you go through to monitor your progress in achieving those goals. So let’s go through this review process by starting with defining our goals.

Goals should be created so that they will help you get to where you want to go. It is a road map for achieving your financial success. In creating goals you should create both long-term and short-term goals for your trading. Long-term goals can be those things that will take longer than one year while short-term goal are those that take less than one year to accomplish. This may not be the only way you can divide them up but it is a simple way to do so.

So whether you are trading stocks, option, futures, metals or forex you should have an idea of what you want these to do for you. These instruments should be a means for you to achieve your goals of financial success. If you have not done so you should take time to set these goals. Let’s take a look at examples of some long- and short-term goals.

Long-term Goals:

  1. Become financially independent by trading the Foreign Exchange market.
  2. Annual income of $100,000 within 5 years
  3. Take a trip to Alaska in 2015

Short-term Goals:

  1. Achieve a return of 5% per month by end of 2013
  2. Add $1,000 to trading account each month in 2013
  3. Complete trading plan by end of 2013

Note: These are just examples, as each trader should set their own goals based on their personal situation and life. Once these goals are set, the next step is to figure out how you are going to monitor your progress. Each goal, both long- and short-term, needs to have a specific plan of how you are going to track its progress. If you have not set goals then begin today and move forward. Your success depends upon it.

Gold and FOMC

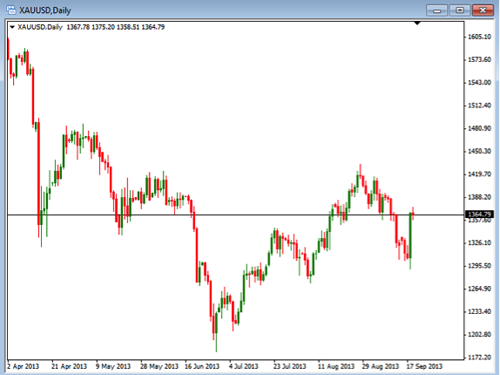
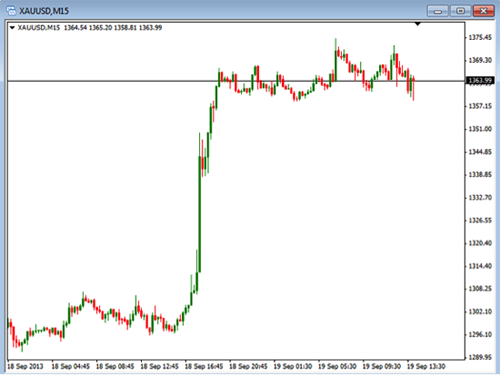
Today we are going to look at the charts of Gold on a daily and 15 minute time frame. The movements that we have seen over the last day is a result of the Federal Open Market Committee (FOMC) statements in regards to the overall economy. This is a great example of how quickly things can move and change based off of the results what the Fed talks about. Any time there is a scheduled news announcement there is the possibility of volatile moves in the market. This is even more likely when the Fed is releasing information about the economy.

In this first chart, which is the Daily chart of gold, you can see that we were in a pretty nice move back down over the past couple of weeks. This changed sharply on the Fed statement yesterday. You can see a large green candle, which shows where the big move occurred. This could be the beginning of gold moving back up again but we need to watch and see if the price is able to hold at these levels. Often times, after a big move up, we can see a retracement of the initial move. A pull back of at least part of the move up is not uncommon. If the price only retraces a little we will want to watch for opportunities to buy into this bullish strength.

As we look for the opportunities to enter into long positions, we can drop our time frame down to look for the actual entries. In the chart below we are looking at the 5 minute time frame. This could also be the 15 minute or hourly charts if you like. The key is to look shorter term for the entry setups. Here you will also see the dramatic increase in price as the FOMC announcement was made. You can also see that there has yet to be any significant pull back. Generally, you would anticipate seeing a retracement by this time. This could mean we are not going to see a big move back down. You will also want to notice the consolidation that it is moving in. This can be a good setup if we are looking to trade a breakout of the consolidation. In this case we would put our buy stop and sell stop just above and below the support and resistance levels created by the price action. Once the price beings to move again we will be able to enter into the trade and take advantage of the new direction it is going.

As you approach possible entries into gold, make sure you are using good risk management as we could continue to see volatility for the immediate future. Volatility is a good thing but we need to make sure we don’t get caught in times when the volatility is extreme due to news. Thankfully, many of the most important news announcements are scheduled and we can take precautions need to avoid potentially damaging situation. Take some time to review what is happening with gold and make sure you wait until gold begins to trade deliberately again before trading.

Fibonacci Retracements

For today, let’s look at the use of the Fibonacci Retracement technical indicator that many technical traders use to trade stocks, futures, ETF’s, and Forex.

Originally, Fibonacci numbers were discovered or developed by Leonardo Fibonacci and it constitutes a series of numbers that when you add the previous two numbers you come up with the next number in the sequence. For example: 1, 2, 3, 5, 8, 13, 21, 34, 55 and so forth. How does this sequence help us trade? Well, it is based on these numbers that give us the common Fibonacci retracement pattern.

This Fibonacci retracement pattern can be useful for swing traders to identify reversals on a chart. Looking at stocks for example, once they have moved up or down in a trend, have a great tendency to move back or retrace a certain amount, rather than to move in a completely straight line or direction up or down. Because of this common retracement pattern, stock traders use the Fibonacci indicators as reference points to predict certain retracements levels as the stock moves back and forth in a trend during a retracement or “pullback”. Often you will find these Fibonacci levels to be very accurate when analyzing chart pattern reversals. Fibonacci indicators also provide an excellent visual map and identify very accurate support and resistance levels. Some Stock trader’s will also combine Fibonacci retracement levels with common candlestick patterns to identify optimum entry and exit points. An effective candlestick pattern trading method is to look for small double bottoms or double tops and individual doji, shooting star or hanging man type reversal candle patterns within these Fibonacci levels to identify trading opportunities.

Fibonacci levels are levels where price retracements or “congestion” often form. Much like moving averages, the Fibonacci levels work like price magnets to old highs or lows and can also form good support and resistance levels. For an even greater degree of accuracy they can be combined with the major candlestick patterns.

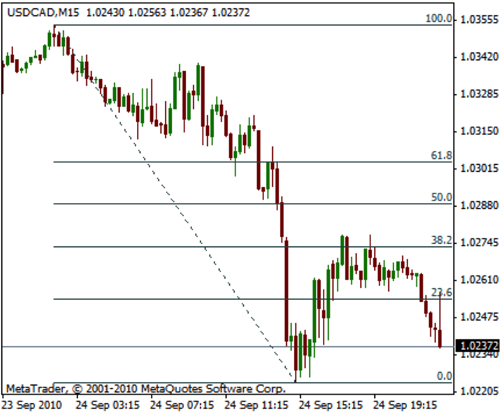
The most common Fibonacci levels used in technical analysis for drawing Fibonacci lines are 62% (61.8% rounded up), 38%, 24% (23.6 rounded up) and 50%. For existing trends, the 24% level should be the minimum retracement but can go down as low as the 62% level. As price retraces, support and resistance occurs at a high rate near the Fibonacci levels. In an existing rising trend, the retracement lines move down or “retrace” from 100% to 0%. In an existing downtrend, the retracement lines move up or “retrace” from 0% to 100%.

You can see in the USDCAD chart above that the retracement came back to the 38.2% level before continuing the downward trend.

Technical Traders use these Fibonacci indicators (Fib-lines or Fib-levels) to predict Price Targets and Support/Resistance Targets. To accurately draw the lines to identify these patterns you begin drawing from the lowest point (which equals your 0 percent line) to the highest point (which equals your 100% line). The 38%, 50%, and 62% lines will provide your reference point for targets.

While Fibonacci is not a “crystal ball” and nothing can predict the future with 100% accuracy, using the Fib-levels can greatly enhance your ability to be in profitable trades. Adding the candlestick signals provide a great advantage for being able to immediately recognize what is going on with investor sentiment at these levels.

Gaps

Gaps are an interesting part of trading and one in which you either love them or hate them depending upon the direction of the gap and the direction of your trade. If you are long and the gap is to the up side, you love it, but if it gap’s against you, then it is not so great. Today we are going to talk about the recent gapping activity that happened this last weekend.

Gaps are a common occurrence in the stock market but less common with the forex market. A gap occurs when the opening price of a candle is higher or lower than the closing price of the prior candle. If the price opens higher than the close there is a gap up, if it opens lower than the close then there is a gap down.

The reason we see them more often in the stock market is that the stock market closes each night giving the price the opportunity to move up or down based off of news during the overnight hours. If earnings or some other type of news comes out on the company, the price can move but we cannot trade it, so there can be a gap up or down at the open of the market the next day.

In the forex market, because it does not close each night, we do not see many significant gaps day by day. On occasion, you will see a small gap up or down if significant news comes out, but it is usually not too big because of the liquidity of the forex market. This liquidity keeps gaps to a minimum. The exception to the market being open is over the weekend, where it closes on Friday afternoon and reopens on Sunday afternoon. During this time you can see major movements in the price of a currency pair. If there is significant news, you may see gaps of 100 pips or more between the Friday close and the Sunday open.

The reason this becomes a problem for traders is that you can lose more than you anticipated if it gaps against you. It’s not a problem if it gaps in our direction, but since we cannot count on it only gapping in our favor, we need to take precautions against a negative gap.

This is the problem. Say you enter a trade on the EUR/USD as a long entry and buy it at 1.30000. You then place your stop at 1.29900, which is a 10 pip stop. If you base your position size on a 10 pip stop, you will come out with a certain number of lots that you can buy based on your risk. So, if you are willing to risk 1% of your account, you would calculate the appropriate lot size based on that. If we were to do this on a Friday and decide to hold it over the weekend, we run the risk of a gap. If, on Sunday, the market opens and gaps down to 1.29200, which is 80 pips below our entry we would get stopped out, not at our stop loss price of 1.29900, but at the open price of 1.29200. This means instead of losing our 1%, we are down 4% – 4 times what we wanted. Again, this is the problem of holding trades through the weekend.

So what should we do? You could close trades prior to the weekend. You could take smaller risk in trades on Friday. You could trade the same, knowing that a gap is possible. Whatever you decide to do, you just need to be aware that gaps happen and can cause you to take bigger losses than you thought you might. Take some time to review what you do to minimize the impact of gaps.

Are Emotions Sabotaging Your Trading?

Often times, traders allow emotions, not logic, to rule the day. By this I mean that we have a tendency to let our emotions get in the way and we don’t follow a systematic approach. We have all heard that “fear” and “greed” are two emotions that can destroy a good trader.

Here are three ways to avoid letting fear and greed get in the way of successful trading:

1. Don’t let greed get the best of you and lead you to risk too much per trade. A good rule of thumb is to trade of a maximum of 1 – 2% risk per trade. The first thing you should do is to determine what that risk per trade is in dollars. In other words, quantify your risk. Let’s say we have a $10,000 account we can then risk up to $200 per trade – $10,000 x 2 %. The next thing to determine would be the total share to trade or the position size based on the $200 maximum risk. The way to calculate the position size is to calculate the risk per share. To determine the risk per share we calculate the difference between the entry price and the initial stop-loss level. For example, if our entry price is $25 per share and our initial stop-loss is set at $24 (I believe that a stop-loss level based on support or resistance is better than a predetermined set stop-loss level), based on this example, the risk per share would be $1 per share. So we could trade up to 200 shares and limit our risk to a 2% maximum. This will help us limit our risk and not accept more risk than is prudent per trade.

2. The second common emotional problem we can have is to enter a trade late. If we pass up or miss a setup and the market moves in the direction of the potential trade, a trader often has the inclination to enter the trade late. Fear of missing a big move plays an emotional role on our trading. We must avoid this mistake to enter a trade late because often when we enter a trade late we have already missed some or, perhaps, even the entire move. So the rule is: Don’t enter a trade late!

3. The third emotional mistake, and maybe the most common one, is the inclination, when the trade in going against you, to say to ourselves: “I don’t want to take this loss, it will come back.” So we widen the stop-loss level on the trade. One of the hardest things for a trader to do is to sit and watch a trade go against us and be taken out by a stop-loss. If the set up was solid and the stop-loss was set at a recent support or resistance level, depending on going long or short, then we have a predetermined risk for that trade. If we widen our stops, we only increase the risk or exposure in that specific risk. So the rule is: If a trade is going to get taken out by our stop, LET IT!

If we can avoid any, or all, of these common emotional mistakes, we will be much more disciplined traders. Successful disciplined traders avoid over-trading, chasing trades, risking too much per trade, and staying in a trade after it has failed to move in the direction expected.

The Big Picture

Today we are going to take a look the concept of seeing the bigger picture in our trades. Often times, as traders, we can become myopic in our view of the market. This means that our focus becomes too narrow and we begin seeing only what we want to see; as our vision of the market narrows, we will begin to only see those things that we want to see. If we only see what we want to see, we may miss what is truly happening.

This will occur when we have decided that the market is going to go up or down and then ignore all other information that tells us otherwise. Sometimes, even if everything else is telling us the price going to move opposite our thinking, we will ignore it and try to find things to support our decision. We will spend all our time looking at different time frames or different indicators that will tell us we are correct in our thought process. We may even spend time asking other traders their opinion until we find someone that agrees with us. We may even ask 100 people what they think and, if only one agrees with us, then that is enough for us to feel we are correct.

It should be obvious that this is not a good habit to have. If we do not see the bigger or macro view of the market and our trades, we are asking to fail. Seeing what is really there, and not what we want to be there, is one of the most important things we can do as trader. As we switch our thinking for what we want to see to what the evidence on the charts shows, we will become better and more disciplined traders.

This concept of seeing the bigger picture is important in many parts of our lives, but in trading it is essential. So, the question is “How do we see the bigger picture?” Well, one of the first things we need to do is accept the fact that it is okay to be wrong. Many times our myopic view of the market is there because we do not want to take a loss or be wrong. If we put into our trading plan that it is okay to be wrong or okay to lose money, then we will be more ready to change our bias quickly. If, for example, we decide to go long on a trade but then the market turns and goes down, we need to be able to say “It’s okay that I was wrong,” and then take the loss and move on to the next trade.

Being able to say we were wrong and change directions in our trade is what successful traders do. If you can accept this as part of trading, it will stop you from trying to find reasons why you should stay in a trade when everything else tells you to get out. You will then be able to focus on seeing the whole market and what direction it is moving.

Take some time to review your ability to see the big picture.

Is the Trend Really Our Friend?!

Anybody who has been around the markets for very long has heard the phrase: “The trend is your friend.” This is a true statement because trading with the trend has a higher probability of winning and is a lot more forgiving if your entry is not perfectly timed than going countertrend.

What is the trend? Generally, the trend is defined as the price moving higher in a Bull Market and downward price movement is a Bearish Market. One of the most important things a trader can do is to determine the trend, whether Bullish (uptrend) or Bearish (downtrend).

Determining the trend (either up, down, or sideways) is the key to successful trend trading. The trend is generally divided into three different classifications: long-term (weeks to months) medium-term (days to weeks) and short-term (hours to days). There is also very short-term (minutes to hours), but this is generally reserved to and looked at by very short-term traders or scalpers, which I won’t really cover today.

How to Determine an Uptrend:

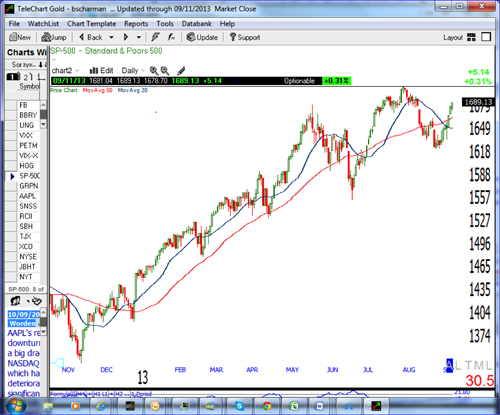
A bull market is defined as the price action moving higher by connecting higher highs and higher lows and is associated with increasing investor confidence and increased investing in anticipation of future price increases. A bullish trend in the stock market often begins before the general economy shows clear signs of recovery. For an example of a bull market, we can look at the current price action on the Standard and Poor’s market index below and can easily identify the current trend as “bullish” as determined by the higher highs and higher lows as the price action has been moving higher. Note: as with any trend, the price does not just move higher, but moving up and then down and then back up again and this price movement is what we string together to identify a general direction of the market. Also note that in a strong uptrend over the last several months, the price is generally above the 50 period moving average and the 50 period moving average is also moving up at the same time these conditions make for an easy way to identify or confirm a bullish trend. In the chart below, when there is an established trend, the movements with the trend, or uptrend legs, in this case, are longer and generally smoother than the countertrend down legs.

How to Determine an Downtrend:

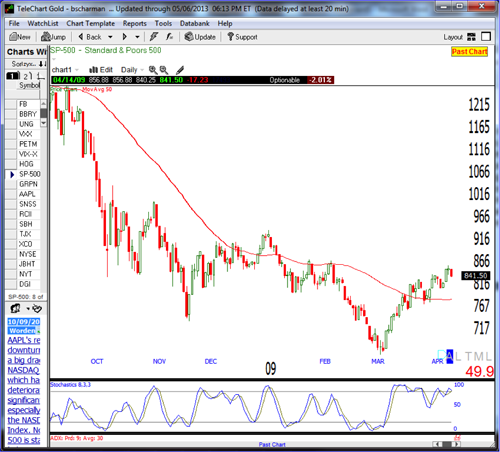
A bear market, or a bearish trend, is a general decline in the stock market in general or a specific stock with lower highs and lower lows over a period of time depending on the length of the trend. A bearish market is generally associated with a transition from high investor optimism to widespread investor fear and pessimism. In addition to the price action moving lower, you can also notice if the price action is moving below the 50 period Moving Average and Moving Average is moving lower, as well as a good indication that we have a bearish trend. Note in the Chart of the Standard and Poor’s index daily chart from late 2008 to early 2009 below to see how to identify periods with a bearish trend. Again, notice that the downtrend legs in an established downtrend are longer and generally smoother than the countertrend legs.

In conclusion, trend trading is one of the best methods to trade, especially if you are trading in the short-term and avoiding the countertrend (pull-backs) will have you out of lower probability trades. So, being able to determine a confirmed bullish or bearish trend could greatly improve our success.