The Proper Investment Type

A common question that I am asked is, “What type of investments should I choose?” or “What is the best market for me to be in?” There is a multitude of investments available that range from the very safe and, borderline, boring, to the very risky, maybe even to the point that many people wouldn’t be able to sleep at night if they had their money in them. Choosing the investment type that is the best, or the most appropriate for a person, will come down to a lot of factors, the least of which is the nature of the investment itself. There are no secrets around the risk level of investment types, so gaining that knowledge really isn’t that big of a challenge, but what can be a challenge is figuring out what type of trader or investor you are or what type you want to be. Once you determine this, matching up an investment to conform to your personality is relatively easy.

The specific investment that will meet a given investor’s needs is based on a lot of factors, most of which have to do with the personality type and the goals of the investor. Some people are aggressive by nature, so they may have a higher risk tolerance than others that may be more passive by nature. Some people want to hold on very tightly to their money, not letting it loose enough to earn a decent return, while others will allow their money more freedom so their investment choices may have more opportunities to work for them.

A common occurrence is when people feel the need to be very aggressive with their investment choices for various reasons. Some people may feel stress because they have not saved very much money, while others may be experiencing the stress of not having enough cash flow to comfortably live off of each week or month. It is not uncommon for people in these situations to ask me if they can take the $2,000.00, or whatever small amount of money that they currently have, and trade with it so they can earn a few thousand dollars per month by trading options or by trading in the Forex market. I hate to bust their bubble, but I do – I typically tell them that, though anything can happen, expecting to earn nearly a 100% return every month is simply not a realistic expectation. In this case, regardless of their personality type or what the best investment choice may be for their current situation, they are willing to do almost anything, including risking all of what they currently have by participating in investment choices that they otherwise would likely never consider.

Choosing the right investment type can be a very simple process if you identify your reason for investing or what your specific need or goal is. Some people have great cash flow, but no assets, so letting cash build up and grow over time is their primary objective. In this case, they will likely choose longer-term, growth-oriented investments. Making this type of investment choice is logical and makes a lot of sense, but a problem is when people make investment choices out of panic or desperation. Under the same scenario, if the person with the good cash flow, but no financial assets, were two years away from when they wanted to retire, and they are just thinking about their future, they may look at some more aggressive types of investments, which may or may not work out well for them.

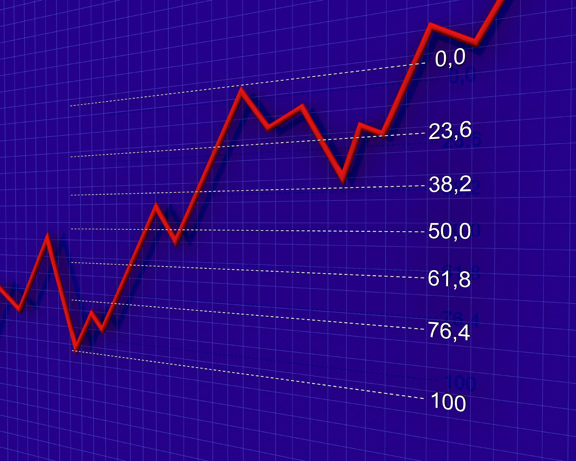
Another thing to consider, which it seems as though a lot of people overlook, is the time that must be spent on certain types of investments. If you do not have time to sit in front of a computer, looking at charts a good portion of the day to trade stocks or to trade on short-term charts in the Forex market, or if looking at charts is very boring to you, don’t do this. Don’t fool yourself into believing that you can, or will, spend the time that is required when you know it’s a lie. When it comes to trading and investing, one investment type definitely is not a good fit for everyone. So be honest about what you can and cannot do and what you are and are not willing to do. Many markets and investments take a lot of time to learn how to effectively use them and if this is something that you know you won’t do, simply choose more passive types of investments that don’t require much of your time to maintain. Investing can be a great thing, but forcing yourself to use the wrong investment vehicles will usually end up being nothing more than just a waste of time and can end up being very costly.

Fibonacci Retracements

We have spent a great deal of time in the past looking at trends and the best ways to trade the trend. Today, let’s look at retracements against the trend after a good move. One of the best ways to quantify a retracement is the use of the Fibonacci retracement technical indicator. The Fibonacci indicator is used by traders of stocks, futures, ETFs, and Forex.

Fibonacci numbers were originally discovered and developed by Leonardo Fibonacci and they constitute a series of numbers that, when you add the previous two numbers, you come up with the next number in the sequence. For example: 1, 2, 3, 5, 8, 13, 21, 34, 55, and so forth. So based on these numbers, we can get consistent retracement percentages.

This Fibonacci retracement pattern can be useful for swing traders to identify reversals on a chart. Looking at stocks, for example, once they have moved up or down in a trend, the market has a great tendency to move back or retrace a certain amount against the trend. Because of this common retracement pattern, traders use the Fibonacci Indicators as reference points to predict certain retracements levels as the market moves back and forth in a trend during a “pullback” or retracement. Often, you will find these Fibonacci levels to be very accurate when analyzing chart pattern reversals. Fibonacci indicators also provide an excellent visual map and identify very accurate support and resistance levels. Some stock traders will also combine Fibonacci retracement levels with common candlestick patterns to identify optimum entry and exit points. An effective candlestick pattern trading method is to look for small, double bottoms or double tops and individual doji or shooting star or hanging man type reversal candle patterns within these Fibonacci levels to identify trading opportunities.

Fibonacci levels are levels where price retracements often form. Often times the Fibonacci levels look like price magnets to old highs or lows and can also form good support and resistance levels. For an even greater degree of accuracy, they can be combined with other indicators like moving averages and the major candlestick patterns.

The most common Fibonacci levels used in technical analysis for drawing Fibonacci lines are 62% (61.8% rounded up), 38%, 24% (23.6% rounded up) and 50%. For existing trends, the 24% level should be the minimum retracement, but can go down as low as the 62% level. As the market retraces, support and resistance occurs at a high rate, at or near the Fibonacci levels. In an existing rising trend, the retracement lines move down or retraces from 100% to 0%. In an existing downtrend, the retracement lines move up or “retraces” from 0% to 100%.

You can see in the Forex USD/CAD chart below that the retracement came back to the 38.2% level before continuing the downward trend.

Technical traders use these Fibonacci levels, sometimes referred to as Fib-levels, to predict price targets and support/resistance levels.

While the Fibonacci indicator, like any indicator, is not perfect, using the Fib-levels can greatly enhance your ability to find good areas of support and resistance to enter and exit your trades more profitably.

Weekly Trends

Today we are going to look at the longer-term charts by using the weekly time frames. This is an important step in really getting a feel for where the major momentum and trends are currently heading. We will also use this time frame to identify where we might see the stronger areas of support and resistance. This process might be done on a weekly basis, so, as you begin your weekly trading, you will know where these areas are for the charts that you are trading. This does not mean that you will trade the weekly charts, but you will be using the trend and support or resistance in determining how and where you will be trading on the shorter-term.

We won’t go through every pair here, but the same process used on this chart can be done on any chart you are currently trading. For our example, we will be using the EUR/USD on the weekly time frame. As we start to evaluate a chart, there are several things we will want to look for. The first thing we will be trying to see is what the overall trend of the pair is doing. This trend is going to be the longer-term movement that is happening, not the immediate movements. This trend will consist of multiple swing highs and swing lows in order to create the pattern for the trend. As with any trend, the pattern formed by these swing highs and lows will determine if the trend is up or down. A series of higher highs and higher lows will form an uptrend and a series of lower highs and lower lows with form a down trend.

The second thing we will look for is to see the current momentum on the chart. This is what the price has been doing over the more recent time. If the momentum is up or down, it will tell us if we should be looking to buy or sell.

The last thing we will look for is the current area of support and resistance. So let’s begin by looking for the trend in this chart below.

With this chart we will go through and look for the three things we just discussed:

  1. Trend – As you look at this chart, you can see that I place two black arrows to represent a swing cycle in the movement of the price. There are multiple areas of these swings, which are making higher highs and higher lows. Because of this, we would consider the long-term trend as being bullish.
  2. Momentum – The momentum in this chart, over the last couple of weeks, has been down, as you can see the two weeks of red candles.
  3. Support and Resistance – On this chart, you can see the red arrow line, which could represent that the trend is up, but also the area where we can see some support. A line could also be drawn at the tops of the price highs to show where resistance may be.

So take some time to review these longer-term charts to see where these areas are located and the trend direction so you can be trading on the right side of the market. Again, look at these three things on the weekly chart of the other pairs you are trading.

Swing Trading vs. “Buy-and-Hold” Investing

With the recent bullish movement of the stock market, some are wondering if a buy-and-hold strategy is back in favor. For some decades now, many Wall Street professionals have preached that buy-and-hold investing is the best way to make money in the market. These same “experts” have claimed there’s no reliable way to time the market, so you should be fully invested at all times to benefit from the growth potential that equities offer in the long term. The truth is that the Federal Reserve Quantitative Easing stimulus programs have had much to do with the market gains over the last couple of years, more than any other reason.

As we look at a weekly chart of the S&P 500 below, as of March, 2014, we see that we are only slightly higher over the year highs of six years ago in 2008. We can also look back 12 years ago to 2000 and see that the market has not continued to rise, but has actually gone up and down and is virtually in a long run standstill, or only slightly higher over the last decade. Note there have also been periods when the market has been down significantly from the highs during the last 14 years only to climb back to the highs, creating huge swings, but not breaking a lot of new ground.

For the investors who were betting on the buy-and-hold strategy to increase their portfolio over approximately the last 14 years, they may be up some from the previous highs, but have lost more than a decade of growth and opportunity! Contributing factors to this slowdown in overall growth are the bubbles and market corrections that keep happening. First, the Internet bubble at the end of 1998, then the attacks on the World Trade Center in September, 2001 and the recession that followed, then the Real Estate Bubble in 2008, and now we see the next bubble may be forming and getting ready to burst. These bubbles create a lot of volatility in the market, which leads to large market swings and there doesn’t seem to be an end to these bubbles in sight. If you had buy-and-hold investments five to six years ago, you are only slightly higher, referring to the chart above. However, if you look at the opportunities for swing trading over the last several years, you will see much greater opportunities.

So the winning strategy over buy-and-hold has clearly been swing trading. Swing trading has also become much easier, and less expensive, with the maturing of the internet over the last few years, giving more active swing traders easier access to online brokers and broader investment choices, like ETFs and cheaper, better trading tools.

With all of the tools now available, along with the strategies and new instruments like ETFs, smart investors have all but abandoned the buy-and-hold philosophy in favor of more active swing trading strategies. In light of the fact that going back over the last 12 years, the overall market hasn’t gone up much, it is pretty hard to argue the point that buy-and-hold is better. In fact, I believe the opportunities for technical swing traders are here to stay!

Investing in ETFs

For several years now, a very popular investment choice among traders and investors has been ETFs, which are Exchange Traded Funds. They are most analogous to mutual funds in the respect that they are comprised of a portfolio of stocks or other assets, but they move more similarly to stocks and can be traded like stocks.

A mutual fund is created by an investment company or an insurance company that pools investor dollars together using the money to purchase large blocks of whatever type of securities the fund was created to invest in. There are many different types of mutual funds that are very common, such as stock funds, bond funds, and index funds. One of their biggest benefits is the diversification that they provide to their investors; however, they can be very cumbersome in some respects. They are not easily bought and sold on open exchanges, they are only priced once each day when the market closes, their internal costs can be very high, the commission structure to purchase them can be cost prohibitive for shorter term moves because it can be based on a percentage of the amount invested and, in some cases, you need to buy them through financial planners or stock brokers.

ETFs have a similar structure to mutual funds in the respect that they are diversified, there are the same, or similar, types of ETFs as there are mutual funds, they are comprised of pools of securities of individual companies or assets, and ETFs that invest in metals may actually hold the metal, such as gold bullion. ETFs are traded, just like stocks, on open exchanges with constant updates to their pricing, which makes moving into them and back out of them very easy and fluid. You can hold them for the long or intermediate-term or you can trade in and out of them regularly. Their commission structure is the same as it is for stocks. So if you use a good discount stockbroker, the commission can be so small it won’t have much of an affect on the outcome of the investment. Mutual funds can only be purchased and are held until they go up, but ETFs can be sold short.

There are a variety of ETFs that are available, such as leveraged ETFs and inverse ETFs. Leveraged ETFs are designed to move 2 or 3 times more than their underlying investments, which means that if you purchase shares of a leveraged gold ETF, the price movement, on a percentage basis, will be a multiple of times greater than the actual price moves of gold. Inverse ETFs are an interesting concept because their entire portfolio consists of short positions; this means that, as the underlying positions that are held in the ETF drop in value, the value of the ETF itself goes up, which can be very useful under certain circumstances in some specific types of accounts.

Generally speaking, when it comes to investing in ETFs or trading them, you really can get the benefits of both worlds. You can get the fluidity and low cost of trading stocks, while you have the diversification of the pooled investment concept of mutual funds. They also make trading or investing in specific sectors very easy, which includes the S&P 500, the Dow 30, European stock averages, gold and silver and other, very specific commodities and industries. Most of the larger, high-volume ETFs will be optionable, which can also be a huge benefit over mutual funds.

While there is no “one size fits all” when it comes to investing, ETFs should at least be considered as possible additions to investors and traders portfolios, due not only in large part to the aforementioned benefits, but also because of the simplicity of trading them and the wide variety of opportunities that they provide. If it is likely that there will be something good or bad happening in a given industry, economic sector, or region of the world, ETFs can allow you to participate in whatever opportunity comes from it without a lot of difficulty and without having to take the time to follow specific stocks from the region or industry.

Know your Strategy

Today we are going to discuss the importance of knowing your strategy. Your strategy tells you the reason why you enter and exit a trade. It will give you the conditions you need to see in order to buy and sell. If you don’t know your strategy, you will never develop the confidence or discipline you need to be successful.

Many new traders begin with the idea that they will make lots of money trading. In thinking this, they will spend lots of time trying to find a strategy to trade. This constant search for the perfect strategy causes them to spin their wheels, while going nowhere. This can also be a problem with experienced trader as well. They have tried many strategies but have never focused in on one in order to become profitable with it. The problem is not a lack of strategies, the problem is a lack of understanding of the strategies.

If we did an experiment and gave everyone only one indicator to trade and told them to develop a strategy with it, what would happen? Then, if we told them that it was the only indicator they could ever use for the rest of their life, what would happen? Well, if we could actually do this, we would find that traders would either quit or find a way to make it work. Those that decided to make it work would look at how they could trade with the indicator to make it profitable. Now, I’m not suggesting you do this, but what I am suggesting is that you take a strategy you have and begin working with it so you can make it profitable. Stop looking for the next best strategy to trade. If you do this, you will find that you will likely be more successful faster than if you spend the rest of your life looking for a perfect system.

Once you decide on which strategy you are going to trade, you will want to get to know it. You will want to know how it works in good conditions, as well as bad conditions. You will want to know exactly what your entry conditions are so when you see them, you will know you should take the trade. You will want to know the exits and any adjustments you will make to the stop and targets. You will want to figure out when it is most likely to be profitable and when the least likely time will be. You will also want to know what external condition might affect the strategy, such as news or geopolitical events.

Once you know the ins and outs of your strategy, you will be able to trade it with confidence and once you are confident with it, you will develop the discipline to trade it so you can be profitable. Take some time to look at your strategy and make sure you know it in and out. If you are still looking for a strategy, pick one and begin to get to know it so you can trade it profitably.

Trailing Stop Loss Orders

We all have probably used stop loss orders to limit our risk in a trade, but how can you use the stop loss order to help manage your trades? You can adjust the initial stop order or “trail” the stop as the position moves in your favor. The initial stop loss orders are an important tool to manage your initial risk. However, let’s discuss using trailing stops on your trades once they are made.

So what are trailing stop loss orders and how do they work? Just like initial stop loss orders, the trailing stop promotes trading discipline by taking most of the emotion out of the exit decision, thus helping you to protect profits and capital. There are two different kinds of trailing stops – first, automatic trailing stops and, second, manual trailing stops. The benefit of an automatic stop order is that it can be set at a predetermined percentage away from the current market price. A trailing stop for a long position would be set below the position’s current market price. For a short position, it would be set above the current market price. A trailing stop is designed to protect profits in the security by enabling a trade to remain open and continue to profit as long as the price is moving in a positive direction, either long or short, but then closing the trade if the price changes direction by a specified percentage, letting the trade exit or being “stopped out” at the trailing stop level. With a manual trailing stop, you would move the stop up or down, whether going long or short, in the direction of the trade, using some method, such as the low of the last 3 bars for a long trade, or the high of the last 3 bars for a short trade, for example. The advantage to using a manual trailing stop, depending on the method used, allows you to scale the trailing stop using current market ranges, instead of preset percentage as in an auto trailing stop.

An example of an automatic trailing stop is a stock that is $50 dollars at market and you place an entry order. At the same time, you place a trailing stop 5% or $2.50 away from the market price. As the stock price moves 5%, the trailing stop will move to break even and then continue to trail on up every time the stock moves another 5%.

One of the trickier things about a trailing stop is where to place it away from the market. In our example, if you place the trailing stop at 5% and that is too tight for the market, you will often get stopped out prematurely. Or, on the other hand, you place it too wide, you run the risk of losing too much capital if it starts to move against you. This issue applies to either a manually adjusted trailing stop or to automatically moving trailing stops.

In conclusion, the real advantage to using trailing stops is that you will be able to reduce your risk as the stock or other security moves in your favor and, once you move to breakeven, you can start to protect profits along the way. So always use an initial stop loss order and then trail it in order to extend the potential profits; instead of using a fixed target, use a trailing stop loss to exit your trades. This can potentially improve your winning trades as they move.

Too Many Indicators

I have seen a lot of trading methods over the years. Some of them have been created by traders that are supposed to be leading trading experts in specific markets, some are from wannabe experts that purport to be expert traders, and some are from regular people, like myself, that are just trying to figure out how to make money. There are two broad categories that I put them in when I see them; there are methods that are templates and methods that flow with the movement of the markets.

The methods that I consider to be templates would be methods with very rigid rules that are not very forgiving; they are very dogmatic in their nature and, when applied to a given chart, the security either passes or fails. They will typically have a lot of rules and conditions and they can be very complicated and time-consuming to apply and analyze. When they were created, they very likely worked well under the market conditions at the time and they would have looked good when they were back tested, which, often times, will make the past data conform to the methodology, justifying its existence and usefulness for its creator.

One of the consistent problems that I see over and over again with this type of method is that, as the market changes, the method cannot. Due in large part to their rigidity when the flow of the market fits the method, it is like fitting a round peg into a round hole. But when the movement of the market in general, and specifically of the price action, changes, it becomes more like trying to fit a square peg into a round hole, which can result in a long string of losses; they simply no longer fit together. The normal ebb and flow of the markets will make this cycle repeat itself, whereby the market changes to fit the method, and then changes to go out of sync with it, and then changes back to fit. This type of method requires the market to fit the method, but the market doesn’t know or care anything about the method; it just goes where it goes based on the supply and demand of traders and investors. Investors and traders make their decisions based on some knowledge, some current events, and some emotions.

The other type of method that I see will have a way of flowing with the market, getting into its rhythm. This type of method fits the market regardless of what the market is doing, versus trying to make the market conform to it. Methods that flow with the rhythm of the market can expand as the breadth of the market expands and contract as the breadth of the market contracts; to an extent, they are subservient to the market, rather than trying to make the market subservient to them.

In the past, I believed, to a certain extent, that using a lot of indicators was a good thing because the more of them that were used and that came into line meeting specific criterion, the more likely a predictable outcome would be. But, as time goes on, I notice that I am using fewer and fewer indicators. All technical indicators are lagging indicators because they are based on the price action, which, of course, must occur before the data can be interpreted to create the indicator. I also notice that of the very few indicators that I still use; they are typically shorter-term indicators, which more closely reflect what is actually going on in the market at that specific time. From trading in the markets for many years and seeing a lot of ways of trading from others and, of course, myself, I have come to believe that, with regard to the number of indicators that are used in trading methods, less is definitely more.

Trading Fibonacci Levels

Today we are going to discuss a bit about trading using the various Fibonacci retracement levels. We won’t get into all the details of what Fibonacci numbers are or how they are derived, just know that this is a commonly used indicator by many traders and something we can use to look for possible entry and exit points. As you know, the forex market is one of the largest markets for traders, so we have a lot of traders using this indicator. If only because of this reason, we should look at this as a potential strong tool to use in our trading.

When using the indicator on our charts, the simplest way to apply it is to draw the indicator beginning at the start of the trend. Then as the trend comes to an end, you will end the line you draw. So, start at the beginning, and stop at the end of the trend. That means, in an uptrend, you would draw it from the low point to the high point on the trend. On a downtrend you would draw it from the high point down to the low point to get your Fibonacci retracement levels.
Take a look at the chart below and you can see an example of both an uptrend and a downtrend.

The chart on the left shows where to start and finish in an uptrend, while the chart on the right shows where to start and finish in a downtrend.
Once we have placed our Fibonacci levels, we can now look at the retracement areas to help us identify possible areas of support and resistance. These levels will act as areas for where we can look to enter and exit trades.

You will notice on the chart that the indicator will draw various lines on the chart, representing levels based on the Fibonacci sequence that will show where there may be a retracement back down to. As the price retraces back down, we can look to buy and sell at these points. So if we see the price retrace back to the first level of retracement at the 23.6 line, we can look to do two things.

First, we can look to see if it will act as an area of support or resistance. If it does, we will look to buy or sell on a bounce back off of it.

Second, we can look to see if it will be broken support or resistance, which will give us an area to go long or short as the price tries to move to the next level.

Regardless of how we use these levels, they can give us an idea of what we should be doing. This should not be any different than trading regular support and resistance where we look to enter a trade on the bounce or break of the support or resistance.

Take some time to review the Fibonacci retracement indicator to see how it might help you in your trading.

Japanese Candlestick Patterns (continued)

Last week I discussed a couple of basic candlestick patterns, i.e. the doji and engulfing patterns. These are some of the most basic reversal patterns to identify areas of indecision and potential reversals in the market.

Today I am going to discuss some additional reversal patterns as follows:

1. Shooting Star Candlestick Pattern

The shooting star is an uptrend reversal pattern, meaning this pattern will be found at the top of the market or bullish trend. It is associated with a trend reversal from a long trend to a short trend, or Bullish to Bearish. In the diagram above, you will notice that it has a small body at the bottom of the candle and a longer wick or shadow on the top of the candle, with no lower wick or shadow beneath the candle body. The long upper wick or shadow indicates the bull’s inability to close higher and the bear’s rejection of the bullish trend. It is not important to the shooting star whether it is an actual up or down candle, either one tells the same story. This pattern indicates, in an uptrend, the loss of momentum to the upside and, perhaps, a potential reversal to the downside.

2. Hammer Candlestick Pattern

The hammer candlestick is a downtrend reversal pattern, which is the opposite of the shooting star. As illustrated in the picture above, the hammer has a small body on the top of the candlestick and a longer wick on the bottom of candlestick. It indicates a potential reversal in a bearish, downtrending market to a bullish uptrend. The long shadow indicated the bear’s inability to close lower and the bull’s rejection of the bearish trend. Also, as with the shooting star pattern, it does not matter if the actual candle is an up or down bullish candle, it is the wick and body relationship that is important.

3. Evening Star Candlestick Pattern

The evening star is a bearish reversal pattern, consisting of 3 bars in an uptrending market. As illustrated in the picture above, the first candle is a long-bodied, bullish candle, extending the current uptrend. The second candle is a short-middle candle that gapped up in the open. The third candle is a bearish, long-bodied candle that gapped down on the open and closed below the midpoint of the body of the first candle. If the pattern is found in a strong uptrend, it may be a very good indication of severe weakening of the uptrend and potential reversal.

4. Morning Start Candlestick Pattern

The morning star is the opposite of the evening star and is a bullish reversal pattern, which occurs at the bottom of a market. As illustrated above, the pattern consists of three candlesticks in a downtrending market. The first candle is a long-bodied bearish candle, extending the current downtrend. The second candle is a short-middle candle that gapped down on the open. The third candle is a bullish long-bodied candle that gapped up on the open and closed above the midpoint of the body of the first candle.

Conclusion
These four additional candlestick patterns are good indicators of a change in market sentiment and, when they occur at the either the tops or bottoms of the market, indicate a very good possibility of a change in market direction. Look for these patterns and identify any possible reversals in the charts that you follow.