Technical Indicators: The Good, Bad, and Useless

Technical indicators are not all created equal; some are good to use, some are not much help at all, and some are just plain useless. I notice that there are a lot of online brokers that advertise on television touting their trading platforms and all of the information that that they provide to investors and traders. They will state that they have all of the indicators that you could possibly want, or need, to be an effective trader, giving you the ability to grow your assets. One of the first questions that pops into my mind when I see these commercials is, “Why?” The longer I trade and invest, the more and more convinced I am that, to a large degree, technical indicators can be a diversion that can take you away from what is actually happening in the market at any given time. They’re akin to sleight of hand in some respects, or a big magic trick. The things that makes magic tricks successful is the setup, the diversion, and then, finally, the “Gotcha!” The reason that I say this is because people can get so caught up with what technical indicators are supposed to tell them that they can lose sight of the most important indicator, which is the price action itself.

If you look at charts enough, you will see that the price action can tell you most of what you need to know. Generally speaking, trading is simply recognizing repetitive patterns that occur on a chart, as early in their development as possible. The earlier you recognize what pattern is likely to develop, the more advantageous it is. Since all technical indicators are lagging indicators, the price action must have already occurred before they can be created, so what do they really tell you and how predictive are they? Traders that are pure technicians may have an issue with this, but facts are facts. Technical indicators are like anything in the trading world, they work great until they don’t. When they stop working, or at least working to the level that they have worked in the past, we either need to make some adjustments or we need to wait until how we were using them becomes effective again.

Think about something as basic as a moving average based on any time period. Period moving averages are typically important to traders because they tell you where the middle of the market is for a specific time period. Many traders will only buy above a specific average and they will only sell below a specific average. They are an indication of the general direction of a security over the given number periods, which may be indicative of which way it may go in the near future, but why are moving averages so important? My opinion is that they really aren’t by themselves. Averages are interesting because they do tell you where the middle of the market is, but, like most technical indicators, they are only important because so many traders and investors believe that they are. It is very common for a lot of people to place entry orders, profit targets, and stops around specific averages. So when those levels are reached, a lot of orders get triggered. The average itself isn’t important; the fact that so many people believe that they are important and regularly use them in their trading is what makes them important.

A very common question that comes up, especially for newer traders, is around the default settings – are the default settings that are on the trading platforms good to use or should they be adjusted? If you are using technical indicators, I believe that the default settings can be very useful in some cases; however, do not be afraid to change them and experiment with them. Depending upon the market being traded and the goal of the trader, I find it is usually best to find a setting that is fast enough to reflect the market moves, but not so fast that the indicator will turn with every bump in the price action. When you do this, there are some technical indicators that can be useful, but don’t let yourself get sidetracked and bogged down with so many indicators that you can’t make a trading decision.

Get Out of Your Mind

The other day I was watching a basketball game of some young people and what started out as a good game quickly turned into a complete blow out. The teams were actually fairly matched, so I was wondering why the one team was able to completely dominate the other. Afterwards, I was looking at the players and it was quite apparent what happened. It was written all over their faces. While physically they were equals, mentally they were much weaker.

I quickly turned my thoughts to how this might relate to trading. As traders, our opponent is not only the market, but, sometimes, ourselves. Just like this basketball team allowed the other team to beat them, both physically and mentally, sometimes, we let the market get into our heads. This can be the difference between winning and losing. Good traders spend as much time working on their mental strength as they do their trading skill.

While this basketball team started out playing well, soon, as they began making mistakes, they let the mistakes get into their heads. One mistake turned into two, and then three, and so on, until they felt they could not do anything without making a mistake. In the end, the game was lost, not because of lack of talent, but because they could not get these mistakes out of their heads.

As traders, we need to recognize that we will make mistakes in our trading. What we cannot do is let them get in our heads and stay there. We must have a way to “flush” our mistakes out of our minds so we can move forward and continue to trade well. This, of course, is easier said than done, but we do need to figure out what we need to do to clear our heads. One simple way that we can do this is to simply turn off the computer and walk away. Go get some fresh air, go golfing, bake a cake, call a friend, or whatever else you like to do. The important thing is that you take a break from your trading and get your mind clear.

Once you do this, you will be ready to trade without the distraction of the mistakes lingering in your mind. As I listened to the coach talking with this team after the loss, I did not hear him yell or scream about how bad things were, rather, he told them to clear their heads, forget about the game and talked about what they can do in the next game to execute better. The focus became what they will do well in the next game in order to win.

As traders, we can do the same. Focus on what we can control by executing properly in our next trades and forget about the past. By staying out of our own heads, we can quickly turn a poor trade into something positive going forward. Take some time to outline your plan to get out of your own head when you make mistakes.

Swing Trading in Deliberate Markets

Today I will discuss the best way to identify a swing trading market and how you can trade these market swings long or short. Swing trading works better when trading in more deliberate markets. Deliberate markets are defined as markets that move more systematically, with fewer gaps and more narrow ranging bars. In a deliberate market you will see price action that is fairly regular, with fairly equal ranges moving in one direction or another.

Normally, the market moves in cycles, from expansion (moves up or down) in a trend, to a consolidation, or ranging market. These cycles will generally swing, or trend up, and then consolidate, or transition to another swing, generally, back down to another support level. To identify the uptrend, or bullish swing, we can look to the price action, identifying higher highs and higher lows in the uptrend. If we connect these higher highs and higher lows together, we can from a bullish channel. In a downtrend, or bearish swing, you can identify the lower highs and lower lows as the market moves downward. These points can also be connected showing a bearish channel. From a technician’s point of view, you can also use the 50-period simple moving average to identify the trend. If the moving average is moving up and the price action is above the moving average, you can, generally, call this a confirmed uptrend. In the case of a downtrend, the 50-period moving average would be going down and the price action would be moving below the moving average for a confirmed bear trend.

As the market swings higher and then transitions to a bearish swing lower, it can almost look like a roller coaster as it moves up, rolls over, and then moves back down. Swing trading systems rely on these swings back and forth as part of the price pattern to enter and exit trades. As the market swings to a high and starts to run into resistance, we might also notice a double or triple top, indicating we are running into resistance (this is the consolidation phase of the cycle), and start to look for the beginning of a swing down or a bearish swing to enter a market short. When the market swings to a low and starts to hit a lower support (double or triple bottom) when the market confirms breaking a higher, this would be a possible long entry. It is important to wait for the price action to confirm the new direction before entering the trade.

Now remember, as with a roller coaster there may be some unexpected twists and turns in our market swings, which is why you should always use appropriate stop loss orders and proper risk management by using appropriate position sizes, just in case it doesn’t swing the way we want it too.

This brings us back to the beginning – swing trading works much better in a more deliberately trading market where the price action is a bit more steady and smooth. This will reduce the potential for unexpected moves.

In conclusion, using the swing price patterns and trading between major support and resistance levels in a deliberate market can generate some very nice trading opportunities for good trades, both long and short.

When to Enter

In our article today, we are going to discuss some of the key things we look for when looking to enter a trade. We are not going to give you any new or unheard of things; we are just going to reinforce those things you know to be true. Without these basics, you may find that you are not doing as well as you would like.

First of all, we need to know if we will be looking to enter into a short or long position. If the market is bullish, we will be looking to buy (go long) and, if the market is bearish, we will be looking to sell (go short) our trade. Again, nothing earth-shattering, but something we had to learn at some point. The old saying “buy low, sell high” is what we are trying to do.

So let’s define some of those things we will need to see when entering our trades:

  1. Identifying the Trend: This is a topic that is discussed on a regular basis, but one that is key to trading successfully. If we do not know the trend, it will be difficult to know the direction we should be trading. Knowing that the trend is bullish will lead us to buying, while knowing that the trend is bearish will lead us to selling. Simple enough, but many traders forget to apply this simple concept when looking to trade. Another old saying, “the trend is your friend”, is one that you have likely heard many times. The reason you have heard it so many times is that it holds true. If you know the trend, it can be your friend.
  2. Knowing Support and Resistance: This will also be a key concept to learn, as knowing where the support and resistance levels are keeps us from getting into a trade when the price is likely to begin reversing. If the trend is up, but we are near a resistance area, we will want to be cautious of getting in. If the trend is down, but we are near support, we will also use caution. Ideally, we want to have the trend up and price near support or the trend down and price near resistance.
  3. Seeing Your Trigger: The trigger is what tells you to get into a trade. If the trigger has happened you will have the green light to enter. If the trigger is not there, you must wait. This can be difficult, especially if we really want to be in a position. Having our trigger means that we have identified rules to show us when to enter. If you don’t have rules, you can’t have your trigger.

Once you have identified the trend, support and resistance, and the trigger you will be ready to enter your trade. This may seem like a very basic idea to many traders, but if you are not currently trading as successful as you would like, you may want to go back and see if you are clearly looking at these things.

Using Bollinger Bands to Trade the Market

Today I’d like to discuss the use of a technical indicator that we haven’t really discussed in the past, but is very popular, namely, the Bollinger Bands, named after John Bollinger. Bollinger, a longtime, famous trader, in the 1980s, developed the idea of using a moving average with bands above and below the moving average, creating a trading envelope of sorts. Unlike a normal moving average envelope above and below the median, or middle, moving average band, the Bollinger Bands use standard deviations to calculate the upper and lower limits of the range, or bands, by adding and subtracting the standard deviation to create the upper and lower levels of the band.

Unlike a regular moving average band, where the bands follow the moving averages, the standard deviation calculation used in the Bollinger Bands is a mathematical formula that measures the volatility in the market above or below the moving average. By measuring this price volatility, the bands adjust themselves to market condition; in other words, they widen or narrow as the market expands or contracts. This is what makes the bands work well for us; at a glance, you can see the price movements between upper and lower bands.

Bollinger Bands consist of a center line, based on a moving average and two price channels (bands) – one above and one below it. The center line consists of an exponential moving average and the price channels are the standard deviations of the stock, or other instrument (e.g. ETF, options contract, Forex pair, or futures contract), that is being charted. The bands will expand, or widen, and contract, or narrow, as the price action of a stock or other issue becomes more volatile or becomes bound into a tight trading pattern or less volatile.

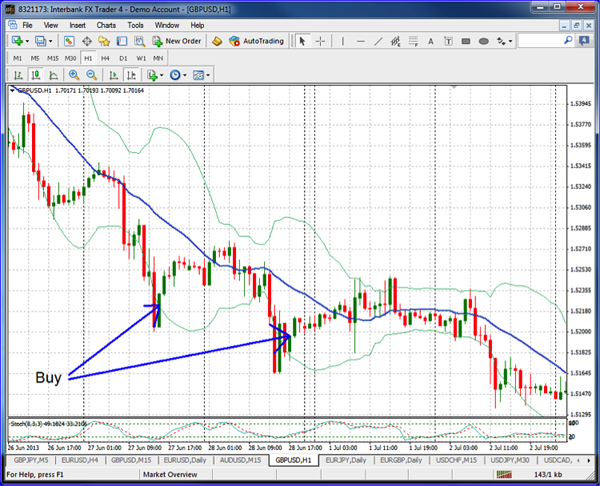
Let’s look at a chart with the Bollinger Bands illustrated. See the chart below and note how the bands contract and widen as the market moves and consolidates. Notice the counter trend entries illustrated to buy and then exit at the center moving average.

Now let’s discuss how you can apply the Bollinger Bands to your trading. As illustrated in the figure above, often, traders use the Bollinger Bands indicator to trade retracements by buying when the price touches the lower band and then hold long until the price touches the moving average in the middle, or, conversely, selling when the price touches the upper band and holding short until the price reaches the middle moving average. This is generally referred to as “counter-trend trading”. Other traders may look for “breakouts” and trade long if the price moves above the upper band in a strong uptrend or trade short if the price moves below the lower band in a downtrend. These strategies are best done in conjunction with other indicators, such as price patterns and trendline breaks to help confirm the breakout, not relying only on the Bollinger Bands. In fact, it is always a good idea not to use Bollinger Bands, as well as any indicators, by themselves, in isolation, but use several together to get confirmation before you enter any trade.

Bollinger Bands are a very popular way to identify a potential reversal as the price moves further away from the center median moving average and, when used in conjunction with other confirming indicators, can be a very good tool to use in your trading. Apply them to your charts and try them out!

Are You Ready for the Next Big Market Crash?

Lately, a question that I’m seeing regularly on the internet is, “Are You Ready for the Next Big Market Crash?” Well, what do you think, are you? I’m not sure that I am and I’m not sure that one is actually coming, but the question is everywhere right now. Two of the most common comments that I have seen is that many experts state that they cannot believe the market is still advancing in light of the weak economy, and some seem even more surprised that it is advancing even with all of the government intervention and manipulation propping it up. Expert after expert states that the market is overpriced by almost any technical indicator that they look at, so it is basically a ticking bomb just waiting to go off, which in this case, means to drop like a rock.

What prompted me to think about this enough to write this article is that I read some information that was sent out today from an internet marketing company that states that they have been correct over 91% of the time when it comes to their market predictions. They predicted the dot com bubble, the real estate bubble, and a multitude of other times when the markets made big moves in both directions. This sounds good, and is very intriguing, that is until you get to the part where they state that you can get, and need to get, their regular predictions by signing up for their newsletter service. I have to say that any company that can boast of having greater than 91% accuracy in their market predictions is a company that should get some attention because it is a really good hook right up until the sales pitch begins. When the sales pitch begins, it leads me directly back to my natural thought process, which is simply to follow the money to find someone’s motivation.

This thought process started for me several years ago and it occurs whenever I hear about all of the ridiculous things that our employees do – our employees being our politicians. The first thing I want to know is who profited from a seemingly dumb decision and how? I tend to think this way when I see things being done that do not make sense at all levels of government, from local municipalities, right on up to the President. I tend to believe that, for every seemingly dumb decision, there’s a corresponding profit of some kind being made by the people making the decisions. Certainly every politician can’t be stupid and, in fact, some seem to be highly educated and very intelligent. So the ignorance that they display has to be linked to some sort of benefit to them or to someone or some group that they are close to.

This is the same thought process that I have when I see the doomsayers stating how the market will crash, while giving multitudes of reasons to support them. They can be very believable until the sales pitch comes. Once the sales pitch begins, it becomes very clear why they would benefit from making people believe that the market will crash, telling people that if they pay the doomsayer enough money, he’ll show them how to protect themselves and maybe even profit when the market and the economy falls apart. The funny thing is that, at some point, the market will begin to reverse itself and the same doomsayers will try to sell other products showing you how to find the bottom of the market and make huge, unrealistic returns when it begins to rise again.

I don’t believe that a market correction, or even a mini market crash, is out of the question at this point, but I do believe that, regardless of when or if this happens, a good, common sense approach to money management, risk management and portfolio management will guide most people through just fine. All of these things are, basically, common sense. You do not need to pay for an expensive service to tell you what to do and when to do it, you just need to pay attention, watch your assets, and be ready to make a move into cash, or whatever it is that you use for safety, when the market drops. Another thing to keep in mind is that, for every person or company that is trying to scare you into subscribing to their service because our economic world is coming to an end, there are just as many people and companies stating that the bull market will continue to run until, at least, well into 2015.

This Week in Gold

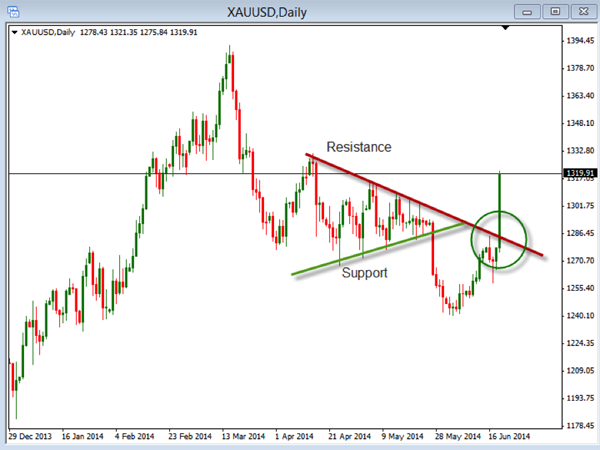
In today’s article, we are going to look at what gold has been doing this week. Gold has been dropping the past month, but, with recent developments in Iraq and the Ukraine, we saw on Thursday that it moved up more than 3%. With this move, we need to know what setup might be coming up. Obviously, if we see a strong bullish move we would like to take advantage of it, but we also need to be concerned about a possible retracement.

Take a look at the daily chart of gold:

You can see a few things here that should be looked at to help us determine how we might trade this. The red line represents an area of resistance and the green line represents an area of support. Between April and May, we saw a significant area of consolidation where we were looking for a price breakout. In this case, it broke to the downside and continued to move down through the first part of June. As the price moved back up and approached the old resistance line, we saw a bit of a bounce down, at least for 2 candles. This looked like it might be a point of entry to go short, but, with the news of the last 2 days, we saw it jump up and smash through the old resistance line.

I will note here that even if you think everything is lined up to go long or short, news can have a major impact on what happens. This is shown with the big green candle that happened on the last day of trading.

The question you need to ask yourself is, “How can I take advantage of this price action?” Do you continue to look for bullish opportunities, do you trade the pullback, or do you just simply wait until the price settles down a bit? The fact is, any way you decide to trade it is ok. You just need to know what you are doing and how you are doing it.

If you are going to trade the bullish momentum, you will need to know what your setup is and when you will enter into the trade. This could be accomplished in many different ways, so make sure you have your rules down.

If you are going to trade the pullback, you will have your rules for that entry. Even if you don’t trade the pullback, you will still want to watch for it, as it is likely to happen after such a big move up.

If you are going to wait for the market to settle back before getting in, you will want to determine when this has happened. It will generally occur after the price pulls back.

Regardless of what you are trading or how you are trading gold, you will want to have your plan of attack before proceeding. Being prepared for the unexpected is a good thing when taking our trades. This can be done by keeping our risk under control and exiting out of a trade when our rules tell us to. Take some time to review gold to see what you might do to take advantage of this current movement.

What is a Non-Deliberate Trading Market?

For our article today, l would like to discuss general market trading conditions that are better or worse for trading. We can refer to these “better” trading market conditions as a deliberately trading market and a “worse” trading market as a non-deliberate trading market. In general, a deliberate market is a more consistently trading market that is smoother and is generally easier to trade. A non-deliberate trading market is more choppy, volatile and riskier to trade.

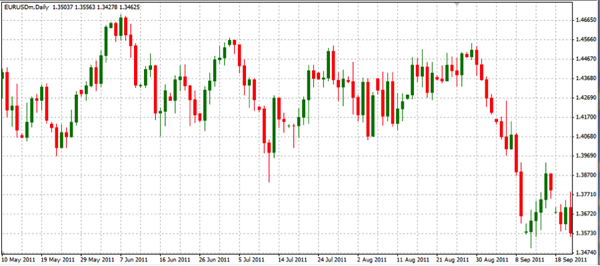
How can we define what a deliberate or non-deliberate is and whether the current market is deliberate or non-deliberately trading? To put a more specific definition on a non-deliberate market, you can look at the chart for about the last 20 bars or candles. In a non-deliberate trading market, you will notice that there will be more and bigger gaps. There will also be more, unusually wide, candles indicating higher ranges as identified by these wider candles. Generally speaking, a more deliberate trading market will have no unusually wide trading days, with no unusually long candlewicks or unusual trading gaps.

Let’s take a look at a couple of charts that will demonstrate the difference between deliberate and non-deliberate markets. You will notice in Figure 1, as a non-deliberate trading market, the market is more range bound and choppy.

Figure 1: Non-Deliberate Trading Market

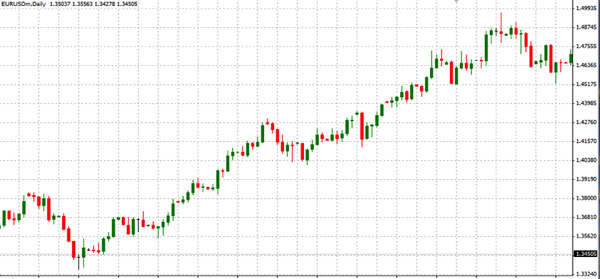
This is the opposite of a nice, deliberate trading market, which is, generally, a more trending, less gaping, more systematic trading market, as in Figure 2 below.

Notice how much more smoothly the market is trading. This is how a more deliberately trading market looks, with a good trend, narrower bars, and the lack of unusually long candles and wicks or gaps.

Figure 2: Deliberately Trading Market

Now we would all prefer to only trade when the market is more deliberate. There is no doubt that during these non-deliberate times of market uncertainty, these can negatively affect your trading psychology or mindset, leading to fear and anxiety over your trading style and methods. Certainly there are times, like the present, when the market is more uncertain or non-deliberate than you would want. But, if we allow the market to get into our heads, you can really find yourself overly anxious and even too discouraged to trade.

If we had a choice of which market we would trade in, we would chose a more deliberate trading market every time, as we get more trend with less volatility. The problem is that we can’t control the markets; therefore, we have to take the market as they present themselves. We can always decide to “pass” on the more non-deliberate markets; however, we may lose a good deal of trading opportunities if we only trade the more deliberate trading markets.

Since a non-deliberate trading market does carry increased volatility and, therefore, more risk, the best strategy for trading these non-deliberate markets is to reduce your position sizes, look at the ranges, and adjust your stop loss orders to be just outside of the choppy trading ranges. These actions will allow you to continue to trade in a non-deliberate market while maintaining proper risk management.

Look for these different markets and adjust your trading according to maintain proper risk management.

As always, happy trading!

Know Your Targets

In one of our articles last week I discussed the idea of knowing where your stop losses are to be placed. Today, we are going to look at the other side of things and discuss where we may want to place our targets. It would be nice if this was the only thing that ever happened, but the fact is, all traders have trades move against them and they are stopped out. This is a natural thing that happens and something that should be expected and planned for within our trading plan. By focusing on knowing how to take our losses, we can be prepared to control our risks. By focusing on knowing how to take our winners, we can be prepared to make money.

Similar to placing our stops, knowing where to place our targets can be a tricky thing. We need to have our rules defined so we can know exactly where to exit with our profits. We don’t want to get into the trade and then begin to “guess” where we should get out. We need to be very specific with how we approach our winning trades. We want to be able to exit with as much profit as possible.

This may be different for you with the different strategies that you trade, so make sure you are customizing your exits based off of what you are trying to accomplish. An example would be that your exits on a scalping trade might be different from your exits on a swing trade. Regardless, you need to make sure they are well defined in your rules.

In addition, you might be using multiple exits to close profitable trades. For example, you might close half the trade when the price moves up to a certain profit point, then adjust the other half to break-even. You may then trail the stop until the price moves back down. There are many different ways you can manage your exits. Just make sure you understand and are comfortable with how you are doing it.

No matter how you choose to exit, you need to know what those target points are going to be. There are several different ways that might help you know where those targets are located. The first one is to look for areas of support or resistance. Knowing these will help you know where the price may stop moving and where you might want to exit the trade. Another way is to look at drawing trend lines to help you see where the price might extend to as it continues to trend up or down. Another way would be to use an Average True Range, or ATR, to see what the average movements might be on the chart you are trading.

These are just a few suggestions of things we can look at to see where we might be taking our profit. Take some time to review what you are currently doing in your trading to identify your profit levels. If you have not defined them well, take the time to write down exactly when, where, and how you are going to exit your profitable trades.

Setting up Exits for Your Trades

Today, let’s look at the best way to exit your trades. Many traders spend a lot of time concentrating on trade setups, looking for all the best ways to get into a trade. However, the success or failure of a trade often lies more in the in the decision of when and where to exit a trade.

Once you have identified a good trade to enter, the next question is, “What about the exit?” What is your exit strategy? The best way to set up a trade is to structure it by setting up both a profit target order, to capture profits, and a stop loss order, to minimize your risk. That way, the emotions of your exit are reduced by setting up your exit in advance. These emotions are what will often get a trader into trouble. Trying to decide your profit target and stop loss during the trade, while “on the fly”, will often result in bad decisions and bad trades because emotions can throw off your judgment. Therefore, you should always use a profit target and a stop loss order when setting up a trade.

The best way to set up your stop loss orders and profit targets is by identifying relevant support and resistance levels appropriate for you your trade.

Where should you place your stop loss?

The best place to put a stop loss order for a long trade is just below the support level.

What is a support level? A support level is a price level where the price tends to find support, or a market floor, as it is going down. It is where demand is strong enough to prevent the price from declining further. The idea is that, as the price gets cheaper, investors become more interested in buying and are less interested in selling. This will often result in a bounce off of the support level. So if we are going long, we would want to place our stop loss order at a previous significant low, just below the support level.

Where would you place your target?

The best place to put a profit target for a long trade is just below the resistance level.

What is a resistance level? A resistance level is the opposite of support – it is a level where the price tends to find a market ceiling, as it is going up. This level is where demand weakens enough to prevent the price from increasing further. The idea is that as the price gets more expensive, buyers become less interested in buying and sellers are more interested in selling. This is often the best place to find a market ceiling. So, in a long trade, you would place a profit target just below the resistance or price ceiling.

For a short trade, we would do just the opposite – our stop would be just above the resistance level at the top and, as the trade moves down in our favor, we would put our target just inside the support level at the bottom.

In conclusion, it is always best to structure your trades with both a stop and a target. The best way to do this is to use the support and resistance levels right on the charts. This will do more good than just using random or arbitrary points that we think are good. Remember to use the support and resistance levels on the charts to help guide you in placing these exit orders, both stops and target.