What Short-Circuits Our Trading?

In the recent market volatility, many traders are confused and are trying to second-guess their strategies. Emotions are running high. When I ask traders how they are doing, some are curtailing there trading, some are in cash and have stopped trading all together. This is understandable; however, it is impossible to know when the next best trade will be. So letting emotions control our timing could keep us out of potentially good trades. The main emotions that traders deal with are fear and greed.

FEAR

Fear is the emotion that will keep us out of the market or delay market entry. Here is an example of how this plays out over and over. A trader is fearful and nervous about the market and may have had one, or even several losses, thereby heightening the emotion. So when a trade setup occurs, the natural tendency for many traders is to hesitate and pass on the trade. What we don’t know is how that trade will play out. If we have a good system with good probabilities, we need to trust the setups, as the next trade may be the best trade of the week, month, or year.

The other scenario is, because of fear, a trader hesitates to enter the trade when the setup occurs, then the trade starts to do well, the trader then jumps into the trade late, just to have a good trade go bad because the trader didn’t enter according to the rules when the original setup occurred.

How do we overcome the emotional response of fear? The best way to deal with this is to go ahead and take the setups that occur and make sure you are controlling your exposure to market risk. Risk management is the key to not letting a bad trade get out of hand and turn into a bigger problem, which can only makes your psychology worse.

GREED

The second emotion that can potentially throw a trader off is greed. Greed can play out in a number of ways. For example, earlier I discussed the scenario when a trader hesitates to get into a trade because of fear that the trade may be a loser. But when the trade starts to work out or move in a profitable direction, greed is the trigger that makes a trader want to jump in late and not miss the good trade. This is a tendency that must be overcome. It would be like someone who goes to the train station to catch a train and the train is sitting there ready to board, but the potential passenger is unsure about its destination and once the train moves out and leaves the station, the passenger tries to run down the tracks to catch it. This seems silly; however, that is actually closer to what happens, that trade often doesn’t work out well because of the late entry. The best way to counter greed is to not “chase” trades and to keep your position size at a proper level. The best thing you can do is to reduce your position size. In a good market, supersizing your positions because of greed can also lead to larger losses if the trade doesn’t work out as expected.

Remember – it is very important to control your emotions to become the most disciplined trader you can be. This is possible by using good risk management with stop losses and keeping your position sizes smaller during more volatile market conditions.

DJ-30 Overview

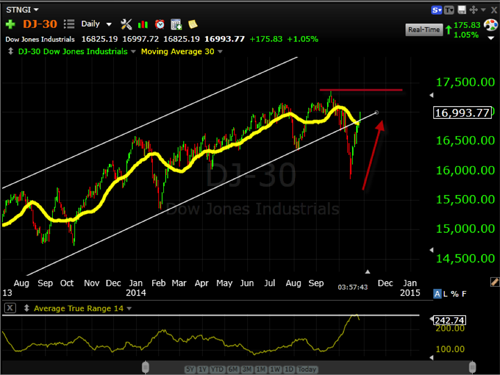
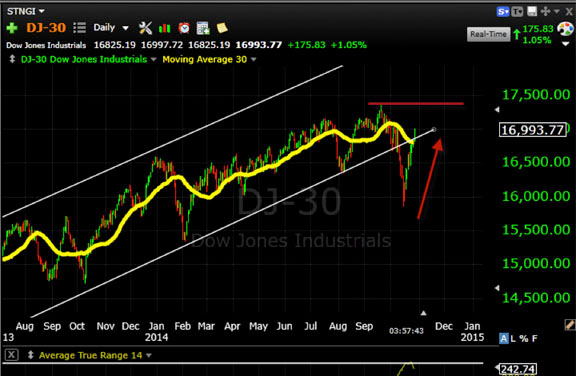
Today we are going to evaluate what is happening on the daily charts of the DJ-30. This index contains 30 of the biggest companies in the US. It is one of the most commonly used and recognized indexes in the world. Although not perfect, it is a benchmark that many use to identify overall market strength or weakness. Take a moment to look at the daily chart of the DJ-30 shown below. Whenever we look at the chart of the index or other individual stock, we want to identify several components. When you look at this chart, first determine the trend that it is moving, then look for the current momentum, and, finally, find where support and resistance is located.

In this chart, we have drawn two white lines, one red line and one red arrow. These two white lines outline the overall trend that is happening on the chart. In the past couple of years, we have seen a very strong bullish trend happening on the DJ-30. These two white lines form an upward moving channel, which shows that the price has been trending up. This upward trend has changed over the last few weeks as the lower white line was broken.

These two white lines can also act as areas of support and resistance. As this lower line of support was broken, you can see the quick drop to the downside. Once the price moved outside of this support, the market became a bit more fearful as it looked like the market might continue to drop. This was a short-lived move only to see the price return back to the support line. With this approach to the old support area, we need to remember that the old support can act as a new area of resistance.

You will also want to notice the red arrow, which indicates the current momentum on the chart. Over the last two weeks, we saw a strong change in momentum as the price began to move higher once again. This movement back to the new resistance is going to be important in the continuation of the price action. If the bulls are going to push the market higher, it will need to push through the bottom white line and move back into the channel. If the bears are going to take control, we will see the price move back down and continue to make lower lows. Only time will tell.

The red line represents the old high on the DJ-30 and an important price level where the market may experience added resistance. If it is able to break through this area, the bulls will clearly be back in control. The other possibility is that we will see the market just consolidate and move sideways for a while. After such a long-term bullish move, it would not be unreasonable to see the market take a break and just go sideways. Knowing the trend, support and resistance, as well as current momentum, we will be able to better identify what the price on the chart may do. Take some time to evaluate the chart of the markets to make sure you have confidence in what may happen.

How to Trade the News

This week we have the Federal Open Market Committee (FEDRAL RESERVE) data coming out and next week the Non-Farm Payroll Report comes out. These are major economic reports that are released periodically, at very specific times which are known well in advance and are found on any economic calendar. These releases have a tendency to especially move the FOREX markets as the FOMC report directly relates to Macroeconomic policy from the Federal Reserve and the non-farm Payroll data is used heavily by the FED to set economic policy. There are many other economic reports and data also being release constantly, however these two reports are some of the largest movers of the markets and therefore, can create some large and profitable moves if you are prepared and setup properly. Having said this, trading these news releases is not a strategy for everyone. The additional volatility that generally goes along with these releases can be more risky than steadier deliberate trading conditions. This is why some traders avoid “trading the news” altogether. Therefore trading during new announcements is something you will have to decide for yourself if you are ready for the volatility that comes. If you set your trades up properly with good risk management rules, these trades can not only be exhilarating, but also profitable.

First thing is to properly set up your trade. Once you have determined the day and time of the news release you can be ready for it. The FOMC data is always released on the WEDNESDAY afternoon at 2:00 P.M. EASTERN, generally with a press conference following at 2:30 P.M. EASTERN. So all you need to do is determine the date of the release as the FOMC meets about every 6 weeks. The Non-Farm Payroll release is generally on the first Friday of each month at 8:30 a.m. EASTERN. Again double check a good economic calendar for exact dates and times.

Once you have the date and time, you will want to set up a “straddle” to trade the market. We have no idea of what the news announcement will actually be, therefore the market could react either positively to the announcement or negatively to the announcement. I generally use the EUR/USD Forex pair to trade these news announcements. So you place a pending BUY STOP order above the market and a pending SELL STOP order below the market. Depending on the ranges in the last 30 minutes before the trade you generally want to place your trades about 10 to 15 pips above and below the current market about 15 minutes before the announcement time. This will keep you from getting whipped into both sides of the trade too easily. After you set your buy stop above and the sell stop below you will want to place your STOP LOSS orders just the market moves against you. I generally put my STOP LOSS order about 15 pips from the entry, so that is the maximum you would lose if that trade goes against you.

Generally, the market will take off in one direction or the other, triggering into that side and they you can cancel the opposite pending trade. Generally the initial move will be over in 1-3 minutes, so once the move starts to retrace just close manually and take that profit. Remember: it is possible that both sides could enter and then go against you if the volatility is too great. That is why it is imperative to use STOP LOSS orders.

CAUTION: Until you are used to this setup, be sure to place several trades in a demo account before trading live money and have fun with it!

All Parties Must Come to an End

All parties must come to an end – the Fed ended their bond buying party, which pumped billions of dollars into the US economy, artificially propping it up, and propping up the stock market along with it. I’m not saying it was a bad idea, I’m just saying that is the result of their actions. Throughout the time that our “Free Market” has had the guidance and control of “Big Brother”, the economy has seemed to stabilize or at least the information we are given generally tells us that it has. It may be a very good idea to question the information that the government publishes in their economic reports because simple common sense will tell us that some of them cannot be correct. You don’t have to be a mathematician to figure this out, but what’s really amazing is that if they make enough people believe that everything is getting better, oddly enough, it will get better. This has been proven time and time again and it’s being proven yet again.

I’ve decided that I’m on bored with this. I’m becoming fascinated with people or groups that can say something long enough and loud enough until it becomes a fact. When this is done, it is a great example of speaking a reality into existence, which, of course, does not need too much, or maybe even any, truth at all behind it. In a way, this is what we’ve seen occur in the stock market. Generally speaking, it was clipping along at a decent pace, rolling up and down like it normally should do, even though, this time, it was largely based on the Fed indirectly propping it up. This was going nicely until the Fed stepped in and ended everyone’s fun. Ending the economy’s welfare program caused some upheaval in the markets, but when they stated that interest rates may not rise until later in 2015, this sent a chill through the markets, which is still being felt today.

The Fed’s control over short-term interest rates is what controls our money supply – the value of the US dollar relative to other currencies; it determines the level of imports and exports and also helps to determine the amount of foreign investments that flow both into and out of the economy. This also affects longer-term interest rates in the interest that banks pay to depositors, mortgage interest rates, along with all consumer loans. It also affects the rates on longer-term notes and bonds. What the Fed says is incredibly important and has very far-reaching effects, not only on people living within the US, but also people from all over the world.

When the Fed indicates that they will be raising short-term interest rates, it is an indication that there will be more foreign dollars invested in the US to earn the higher interest rates. At some point, money will flow out of stocks and into interest-bearing investments as they become more attractive, mortgage rates will rise, which, of course, effects the real estate and housing markets in general. When they stated that interest rates might not rise as quickly as the market had hoped, it created a situation. Possibly the most affected area this time was in the stock market, which has been experiencing an unusual amount of volatility since the Fed’s future intent around interest rates was made public on October 8th. The market dropped in 5 days about 7.50% and has gotten almost all of it back over the next 7 days. It has been very volatile by almost anyone’s standards and the ride may not be over yet. The Fed will have to increase the interest rate at some point, there is virtually no other option, and, when that happens, we may see even more volatility than what we are seeing now. Since all of this is so obvious, I believe that the best thing that we can do, as investors and traders, is to be prepared for times like this, knowing that they are coming. Our investments and our trades don’t have to revolve around what the Fed does, but we may consider putting ourselves in a position so we can react quickly to what they do next, whenever that actually does happen.

Setting Up Swing Trading Profit Targets

I write a lot about risk management and using stops to limit risk, but today I am going to discuss setting good and reasonable profit targets for your swing trades. I think it is best to set up a good, structured trade with both stop loss orders and profit targets. Setting up a trade this way is important because you can then sit back and let the trade develop without emotions short-circuiting the trade early. Also, there is little to no need to micro manage or “babysit” your trade, allowing you to do other things and not get emotionally attached to any one trade. I do not recommend a “one size fits all” target, based on a preset or predetermined percentage or price movement. The best way to set a profit target is to look at the ranges of the market and look at the current ranges to set a specific target for the specific security and the current market. Let’s look at determining where to set a good profit target.

First, let’s look at the chart and find the current support and resistance levels on your chart. Often, we use support and resistance channels to give us good trade entry levels; however, you can use the opposite side of the channel to help determine the best profit target. The first thing to discuss is how you set up your support and resistance levels on your chart. Remember the support level is determined by connecting up the significant market lows, as support is always a price floor and sets the bottom of the channel, and then connect the market highs to set the upper resistance, or market ceiling. These support and resistance levels should be parallel to each other. One hint is that you only need two good highs or lows to set the channel. If the market is in an uptrend, start with setting the bottom or support level and then set the parallel resistance level at 2 to 3 significant market highs. In an upward moving channel with a solid upward trend, look to set your profit target just INSIDE the upper resistance level, as the probability will be greater to hit that target as the market moves or swings up the resistance. In a downward trend, if you are selling short the market, you can do the opposite by placing a profit target just INSIDE the lower support level, as the probability of the market running back down to the support line is a good probability. Remember that sometimes this method takes patience and time to allow the trade to develop and move back to the top or back to the bottom of the market once in a trade. Caution: DON’T GET GREEDY and place your target too far away from the market or beyond the support or resistance channel, as the market may move in your desired direction, but not as far as you need it to in order to exit at a more aggressive target.

In conclusion, set up and use your support and resistance channel to determine and set your profit targets inside the channel where the market is more likely to achieve that price level and be happy with a profitable exit.

ATR – What Is It?

The Average True Range, or ATR, is an indicator that was introduced by a man named Welles Wilder who also introduced the indicators called Relative Strength Index (RSI), Average Directional Index, as well as the Parabolic SAR. The ATR is a measure of volatility, which gives a higher reading when the volatility is high and a lower reading when the volatility is low. In this article, we will not go into all the details about how this is calculated; rather, we will look at several ways that you might use this indicator in your trading.

The first thing that you can see with the ATR is that it forms a line that moves up and down as the volatility increases or decreases. Generally, you will see a pattern formed where, during certain times on the chart, it will increase and, other times, it will decrease. This can be useful when looking to take a trade on an intraday basis. If we can see that, at certain times, the price moves more, this might lead us to taking trades during these times. This can especially be useful if we are looking to trade a breakout when the price is not moving much, but we know that the ATR is beginning to increase. This time when the ATR usually moves would be an ideal time to look for the breakout to occur. While this won’t specifically tell us when it will move, or where it will move, it can tell us when it is more likely to move.

The other thing we may want to use the ATR for is our exits. If we know that the ATR is 20 pips for the EUR/USD, then we can use that to help make sure our stops and targets are placed appropriately. For example, if I take a trade on the EUR/USD and the ATR is 20, but I put my stop 10 pips away, then I am likely to get stopped out because that is within the average range that the price will move. By placing our stops too close, we may get stopped out on normal movements within the trading range. Likewise, on our targets, if we place them too close or too far away, we may be missing getting out at the best place. Many traders tend to close out of trades too soon when the price is likely to move more. With the ATR, we can have an idea of the likely move for a given trade. If our ATR is 20 pips but we are getting out with 10 pips, we may be selling ourselves short.

Although there are no perfect indicators out there, the use of the Average True Range can give us an insight that we might not otherwise have. Take some time to look at how this indicator might help you in your trading. It can simply be added to any trading strategy to help you know when the best time to enter might be, as well as how much movement you can expect.

Have a Written Trading Plan

One of the most important steps to becoming a consistent and successful trader is to establish and use a solid written trading plan. One problem that many traders have is not using a consistent trading plan. One of the biggest advantages to following a good trading plan is that you will rely less on emotions and more on your system. A good trading plan should include several elements.

First, a trading plan should include a specific tested trading method or strategy. Regardless of the strategy you use it should include easy to follow rules. This applies to all markets regardless of what you trade. These rules should include trade set ups, entry rules, trade management rules and also exit rules to know how when to get out of a trade. They should also be repeatable. The rules should be easy to describe and should be easily repeatable, so that you can back test the results on past data. Now this will not guarantee success into the future, but back testing over a period of time will allow you to become more confident in the system under a variety of different market conditions.

One way to understand if your rules are easy understand is to teach someone else the strategy and see if they can understand and follow along with you. Also the more you back test the system the more confidence you will have in the system. Being more confident in your system, you will allow you to be more patient when you are in a trade, to give the trade enough time to reach the profit target. It will also be easier to recognize when a trade has failed and therefore be will be easier to cut your losses and move on to a more profitable trade.

Second, your trading plan should include a consistent routine. When you set up your trading routine you should keep several things in mind. You should before anything else make your trading routine practical to your individual situation so you can be consistent in the long run. Some of the elements you need to decide are what you trade, how you trade, where you trade and even why you are trading.

Also, a good routine will allow you to be more organized, which will allow you to be more confident in your trading. This will help you control your emotions and trading psychology. If you allow emotions to rule your trading, this can sabotage your trading success.

Third, the most important element of a trading plan are your risk management rules. A good risk management plan should include a specific set of risk management rules with defined risk levels including position size calculations in order to control the risk exposure for each and every position entered. Even if you have a good system that works well most of the time, no system is perfect and can remove all of the market risk. A recommendation for risk management is to set your maximum risk per trade at 1-2% and then how many positions you will have at one time. For example if you have 5 trades at 2% risk each you will carry about 10% maximum risk or exposure. Regardless of the risk you carry you should be very determined not to violate your risk management rules.

In conclusion, if you don’t have a written trading plan, sit down and take the time to write down your rules, your routine and risk management parameters. Once you have a good written trading plan, it is important to use it consistently. This will help you to be much more consistent with your trades.

An Obvious Reversal

Over the past several days, stating it mildly, the stock market has been a little volatile. We have seen wild gyrations both up and down in the stock indices and of course some individual stocks have taken even more of a wild ride. I would like to just be able to say “So what about it, you should have been all in cash before this happened”, but I know that allot of people didn’t make it into cash in a timely fashion. Let’s just be honest about this, the big drop that we have seen over the past few weeks was not a mystery and should not have been much of a shock or even a surprise. The S&P 500 clearly made a double top bearish divergence or reversal type pattern that completed itself on 9/22/2014 with the Dow 30 and the Nasdaq Composite Index making the same pattern with identical timing. This reversal pattern in all of the indices at the same exact time along with the fact that the second leg up, the higher high in the price action, was also an all time for the S&P 500 and the Dow 30 should have been an indication that the indices, the overall market, was more likely to go down than it was to test or make new all time highs.

If an astute investor or trader had seen the completion of this pattern they would have almost had to exit the individual positions that they had open at the time or minimally move their stops up much tighter than they likely would have been before the pattern emerged. My definition of trading is simply recognizing a repetitive pattern as early in its development as possible and then of course taking advantage of it. The divergence pattern that developed is one of the more common and accurate patterns that you can follow as a trader or as an investor so seeing it and doing nothing about it would have been a huge mistake. Riding the market from an all time high back down to where it was 8 months ago can add time to an investment or to a trade due to the time it will take to come back up to the breakeven level. If the original investment was purchased earlier in the year at a better price getting back to even may not take that long but for investments that were purchased at or near the high of the market there is no telling how long it may take to break even or to regain some of the unrealized gain that was given back when the bottom fell out.

Not recognizing that the long position was over would be bad enough but anyone that did not see a short opportunity at or around that same time probably should have. Not every trader or investor will take short positions so even if you didn’t enter the market with a short position at least recognizing it should not have been that difficult and should have been enough to make you close a long. It is very likely that most or at least many long positions were stopped out during this drop which is a good thing. This should give us the opportunity to get back into some positions at much lower prices so that when the market does rebound and we eventually get back into the territory of new highs we should be able to realize some nice gains.

I believe that one of the biggest differences between average or below average traders and successful traders is the ability to see and then to take advantage of the opportunities that present themselves as they occur. Being able to recognize what the market may be doing or what it may be about to do can be the difference between the success and failure of your portfolio.

How to Trade in Uncertain Markets

The markets hate uncertainty. This is because the uncertainty creates more volatility and volatility makes trading much more difficult. Often, I refer to more volatile markets as less deliberate markets. When markets are less deliberate, they are more jumpy, volatile and more unpredictable. The only way to trade in these kinds of markets is to trade with more discipline. There are a couple of key elements to trading with discipline.

Use Proper Stop Loss Orders

First, reduce emotions by setting up your trades with a protective stop using your exit rules. Use initial stop loss orders and let a trade that goes against you go ahead and exit. Sometimes it is tempting to widen your stop to stay in the trade until it turns around. This is possible, of course; however, you will generally find that, more often, these trades will turn into bigger losses than the initial loss would have been. The best way to set your stop loss it to use a recent significant support level, if going long, or a significant resistance level at the top of the market, if going long. Depending on your trade management rules, you may want to move your stop loss order as the trade moves in your favor to reduce risk or lock in profits if the market moves back against you. One caution in more volatile markets is not to move your stop loss too tight or too close to the market, as this may exit the trade prematurely as the market moves back and forth. One trick is to use the ATR, or average true range, for the time period you are using to trade. For example, if you are trading on a 1-hour chart, you would not want to trail your stop tighter than 1 times the ATR on the hourly chart. Same if you are using a daily chart, you would use the ATR level set by the daily chart. I like to view the stop loss orders as a form of insurance. Nobody likes to take a loss; however, if you have a protective stop loss order trigger and exit, you have exited the trade at a predetermined level with a predetermined risk or exposure. However, make sure to give the market some “wiggle room” to move within the market average true range.

Reduce Positions Sizes

Position sizing is also a critical element of any successful trader’s risk management. With good risk management, you are more likely to control the emotions that come in non-deliberate markets. Reducing position sizing will also reduce your market exposure, instead of putting too much risk into fewer, larger positions, which may go against you and put your entire account at too much risk. Keeping your position sizes within about 1-2% risk per trade will keep your individual positions small and risk at a smaller, more acceptable, level. In addition to small position sizing on individual trades, you should limit the total trades you have at any one time to 5 or so positions, which will never allow your total risk to exceed 10% at any one given time, even if all of your positions go against you all at once. In more non-deliberate markets, I would recommend 5 max trades at 1 % risk per trade. You need to live with the possibility, each time you trade, that each trade could be a loser; therefore, you need to be aware of the specific percentage risk you take with each position.

In conclusion, the bottom line, when trading in more volatile markets, is reducing risk, by using stops and, instead of tightening the stops, reduce your positions sizes, as well as the total number of positions.

Learn to Place Stops

One of the most common questions asked by new and experienced traders is, “Where should I place my stop loss?” This is one of the most important things we should know and also one of the most difficult things to figure out. Many traders will equate the amount of risk they are taking in a trade with the placement of their stop losses. While this has something to do with our risk we need to remember that we should risk the same percentage amount regardless of our stop placement. What this means is that if our stops are placed 10 or 20 pips away, our risked amount will be the same. So my maximum risk will be 2%, regardless of where my initial stop loss is placed.

With this in mind, we need to recognize that the important thing is not that our stop is placed at 10 or 20 pips, but that it is placed in the appropriate place. This placement may be 20 pips in one trade and 50 pips in another; the key is that it is placed where it is going to give us the best opportunity to be profitable in the trade without getting stopped out too early. This is one of the most frustrating things for traders and one that can be avoided by looking at a few things on the chart. Avoiding early stop outs will help you build your profit, as well as your confidence.

There are a couple of basic things that we can look at on the charts to help us identify where these appropriate levels may be located. Of course there is not a perfect way to do this that will guarantee profit every time, but there are some guiding principles to follow. The first thing to look at is to identify prior levels of support and resistance. If we know where the price will stop moving, we can know where to place our stop loss. If we are looking at a bullish entry, and can identify where the prior level of support or resistance held the price, we can place our stop loss just below this area so the price will have a chance to bounce off of it in our direction. If the price breaks these old support or resistance areas, we will want to exit the trade immediately. So the first thing to draw on the chart is support and resistance. Remember that these lines can be both horizontal as well as diagonal.

The next thing we can use is a moving average. For example, if we use the 40-period simple moving average, this can help us know where to place our stops. If we enter a bullish trade, we can place our stop loss below this moving average line. Oftentimes, using this, as well as the support and resistance lines, can give us a good idea where the most appropriate stop placement will be.

Take some time to review how to use these and you will find that you are placing your stops in a more appropriate place.