Hi everybody, Bill Poulos here about an indicator that many stock trading systems use, including many of my trading systems. Many trading systems often use many different indicators, but the one I’m talking about today is: Stochastics. Now in the financial world, Stochastics represent the seemingly random behavior of assets such as stock, ETF, or forex prices. Which is just a fancy phrase for it measures volatility. And when I say volatility, I don’t mean the bad type that we talked about last time. No matter what your stochastic information is telling you, if you see wild bars appearing and the market is moving in a helter skelter fashion: Stay out! Just wait for it to start trending in a more predictable fashion.
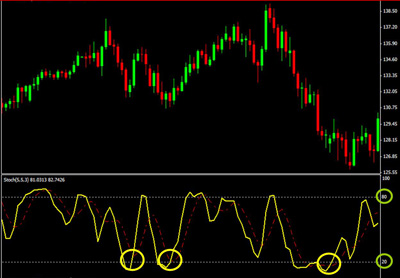
No, what stochastic indicators measure is the every day volatility that stocks, ETFs or forex go though on a regular basis. And it can help us determine if a certain security is moving in a tradable fashion. And what I like to use it for is as a marker for change. Take a look at this chart here:
What those circles represent is where a certain security was overbought or oversold, which let’s us know if we’re in an up or down market. In an upward-trending market, prices tend to close near their high, and during a downward-trending market, prices tend to close near their low.
So at the end of the day, at the very least, you can use the stochastic indicator to help you determine the direction of the market. And that’s what I want you to take away from all of this. Because knowing the direction of the market can make or break a trade.
That’s also why many trading systems use this indicator in their methods… it does a great job at what it was inteded to do. So go ahead, take a look at the stochastics next time you trade and see if it can help you get a better grasp on where the market is going.
