In the world of forex trading you will find all kinds of various ways to take trades.  Many of these way use specific indicators to identify these entry and exit points.  Some of them even use multiple indicators to identify these points.  The problem with some of these is that they become so confusing with all the indicators that they are not very effective for most traders.  Another problem of multiple indicators is that they often times take our attention away from the most critical part of trading.  This most critical part is to look at the price action that is currently happening.  Price action should be the most important thing we look for and indicators should be secondary to this.  By keeping our priorities straight when looking at charts we will be able to better use indicators along with the price action.

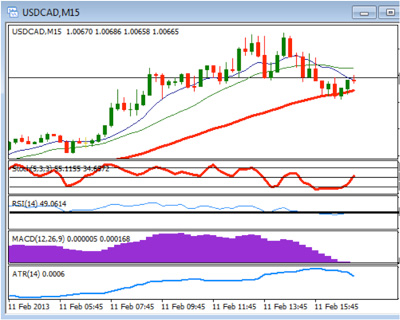
Take a moment to review the two charts below.

This first chart has multiple indicators being uses.  Notice that the chart if fairly cluttered and a bit confusing to look at.  Now this does not mean that you cannot use multiple indicators but you need to make sure that they do not take the place of simply looking at the price action.  The indicators should be able to improve our entries based on price action, not replace the price action.

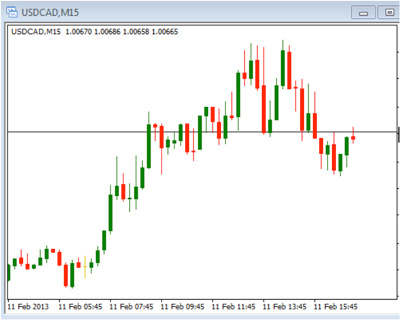
Now, take a look at the chart below and notice that there are not any indicators, just a clean and clear looking chart.  This chart allows us to see what the price is doing and to be able to identify where an entry may occur without the indicators cluttering up the charts.  Once we have identified a possible entry we can then add indicators to support our decision to enter or exit a trade.


By knowing and using this order of importance when looking for an entry, we can focus on what is the most important part of trading – price action.

Once we become familiar with the price action and begin to rely less on indicators, we can begin to see things as they really are.  Indicators often times give us a false sense of security and can lead us in the wrong direction.  As you start to see the price action you will begin to pick out specific price patterns that can be used in your trading.  These patterns are generally created as the trend is established and the areas of support and resistance are defined.

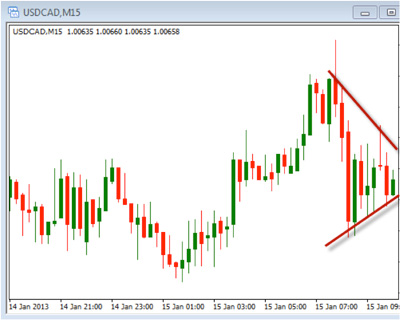
Price patterns are simple ways to learn to enter and exit trades.  There are many types of price patterns and include continuation and reversal types.  The one type I want to look at today is the price pattern called a triangle.  This is a simple pattern and one in which every trader should be familiar.  Take a look at the chart below.


Notice that the lines of support and resistance here are pointing towards each other forming what looks like a triangle.  This converging of support and resistance is created as the price is consolidating in a tight range.  This consolidation will, at some point, break out of the area.  This move with be either above the resistance or below the support line.  The entry would be to look for this breakout and to enter either long or short, depending on the direction it moves.  A stop loss is place at a point back inside the triangle, in case the price decides to reverse.

Simple price patterns like this can be a clear way to identify your entry and exit point when trading.  Take some time to simplify your trading by focusing in on price action and avoiding too many indicators, then look for price patterns such as triangles to enter into trades.
So far this year the price of gold and gold ETFs have drifted in a downward fashion but is that likely to continue or is it on the verge of presenting us a with a great buying opportunity?  Unfortunately just like many economic questions the answer to this question depends upon whom you talk to.

The value of gold has historically been very volatile.  To a large extent its price movement works inversely with the stock market. When there was trouble in the world; a war, a natural disaster or a stock market meltdown, it was said that the smart money moved to gold.   Consequently it had been successfully used as hedge against a drop in the stock prices of portfolios for many years.  This did change several years ago when some investors in very wealthy oil producing nations began to flock to the US dollar instead of gold in stressful times but in recent years it seems as though there may have been shift back at least partially to gold. 

When the collapse of the real estate market began in the US around 2007 and 2008 and was made public in August of 2008 the stock market quickly followed.  It isn’t too surprising that for a few months after that there was a tremendous amount of volatility in all markets until there was a beautiful bullish divergent pattern that emerged in the spot price of gold and many gold based index funds and ETFs in October and November of 2008.  After that time there was a steady and very strong rise in the price of gold and many investments having to do with gold that didn’t reach its peak until almost two years later.  Since the peak in September of 2011 the price of gold has been basically range bound fluctuating up and down but not really going anywhere while the S&P 500 has remained range bound with an upward bias.  The price of gold today is basically in the middle of its recent range though it is slightly in the lower half of the range. 

Most experts believe that this will continue with a likely downward bias for the rest of the first half of this year.  The predictions for the second half of the year are where there seems to be a lot of differences of opinion.  Some gold experts believe that the price of gold will continue to drop while others believe that it will rise sharply.  The reason that some are looking for a rise in the metals value is due to the looming potential currency wars by industrialized nations from around the world.  Many countries are interested in devaluing their currencies to increase exports and to lessen trade gaps. 

If an actual currency war does break out and we see the largest nations make attempts to devalue their currencies this could create havoc in the world markets, just about all of the world markets.  We have seen several hundred pip moves in the Forex market within minutes of an announcement of intervention by the central government of a highly traded currency but what happens if all of these countries begin to announce their intention to intervene to weaken their currencies?  We could see ups and downs in the markets all over the world like we have never seen before with a likely steady and rise in the price of gold throughout this time.  Stay tuned because it could be a fun year and don’t forget about what gold could potentially do for your portfolio in the relatively near future.   

Today we are going to look at the concept of deliberate markets when looking to trade.  A deliberate market is one in which the price action is moving in a consistent and careful pattern.  As trades are identified we need to consider the volatility that is currently happening with the market.  Gold and silver can become volatile at times and especially when news is pending.  Knowing what to look for to identify volatility can help us avoid times when the market may become less deliberate in the movements.

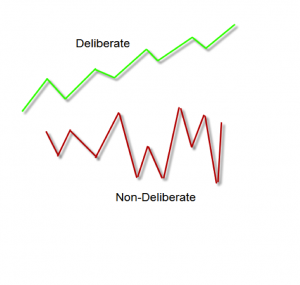
Take a look at the picture below which shows both a deliberate and a non-deliberate price action:

Notice that the deliberate movement consists of a pattern of higher highs and higher lows while the non-deliberate price action has a not distinct pattern of highs and lows.  By avoiding these non-deliberate patterns and looking for the deliberate ones we can place our trades in the best situation for a profitable outcome.  When trying to trade in a non-deliberate market we can anticipate seeing quick moves which can cause us to take quick losses on our trades.

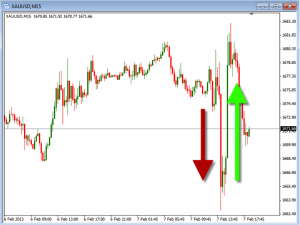
Take a look at the chart below.  This chart was taken from today’s price action before and after the ECB Press Conference.  You will notice that the price action was extreme and quick in the moves that happened during this announcement.  The initial swing was to the downside, followed by a large up move which ended up selling back off.  This type of move can be expected but we cannot anticipate the direction or timing of the moves very quickly. 

When looking to trade we must always look for the upcoming news that might impact our position.  If the news is happening soon we may decide to hold off on entering the trade until after the announcement.  If you are looking to take a trade in anticipation of a big volatile move then you need to make sure you are using good risk management rules.  The only way to avoid the possible negative move is to avoid trading during these times.  If you are determined to trade you can simply adjust your risk level down when determining your position size.

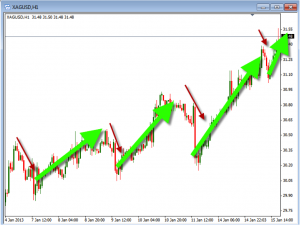
Now take a look at the 1-hour chart of Silver and you can see a more deliberate pattern that it was making.  This deliberate pattern of higher highs (green arrows) and higher lows (red arrows) is what we want to see to trade.  These deliberate movements can give us confidence that we are trading during the right market conditions.

We are not looking for perfection, just to trade during times where the market is less volatile and more deliberate.  The charts will seldom look like the picture above where it is moving perfect but you should be able to eliminate when the market is too volatile.  This can be done by knowing when the news is going to be reported and by looking at the charts to see the times when it is going through extreme moves.

Take some time to review your charts and become comfortable with identifying deliberate moving markets.  Also, make sure you have access to an economic calendar from your broker.  Doing these few things can help you avoid non-deliberate markets.

Today, I want to give you a really important stock market trading tip: Don’t replace a bad decision with another bad decision. Generally speaking it is said that most people travel in social circles with others that have an annual income that is within approximately $5,000.00 of their annual income.  This of course means that if you are successful financially you most likely will spend time with other people that are financially successful but if you struggle financially your friends are probably struggling too.  I notice that the same holds true with traders in the respect that good and successful traders will likely talk to other good and successful traders while inexperienced or unsuccessful traders will spend their time with other unsuccessful traders.  This leads to an obvious problem when an unsuccessful trader looks to change trading methods getting new ideas from other traders they know, those traders are very likely just as unsuccessful so they are basically swapping bad ideas back and forth.

Rather than regularly changing trading styles or methods and incorporating bad ideas from others into their trading traders may consider working their current ideas to the fullest extent, massaging them and adjusting them as necessary until they get them to work or until they know for a fact that they will not work and only at that point change.  Just because an idea doesn’t work perfectly all the time doesn’t mean that it can’t or won’t work better with a few adjustments.  Play with adding and subtracting indicators, adjust currently used indicators and trade the method consistently in a practice account until you know for sure that it won’t work and then overhaul your approach.

Treat your trading business as a business, just like any business your trading business needs a business plan or in this case a trading plan.  Many traders seem to want to skip the part about running a business that includes creating a business plan; they seem to want to go right to the part where they count their profits which in many cases will never come.  Very methodically plot out your trading style, plan or method one step at a time from the very first thing that should be done each time you are looking for a good entry point onto the market to thing that will make you exit the trade.  This may start by determining what kind of trading day or market environment it is that you are seeing; is it a nicely rolling market up and down, is it a long nicely trending market or is it a choppy sideways market that really isn’t going anywhere.  The reason for doing this is to determine if the trading method you are using will succeed under the current market conditions.  You may have developed different methods for different types of markets and if that is the case you must determine which one to use.

Keep track of the type of market your methods work best in and only trade specific methods in the type of market that they are likely to succeed in.  What does the recent price action need to be doing, how are the technical indicators lining up and specifically what do they need to be doing.  If you use a moving average or averages do they need to cross or turn or be at particular levels and are the other indicators in the position or at the level that they need to be at.

Once you have achieved a good clear trading method that will work a good percentage of the time when it is applied then you will be faced one of the most difficult things a trader must do and one of the few things that we may actually be able to control; we have to discipline and control ourselves.  We must dogmatically and unemotionally apply our trading method with no regard or real picture on the outcome.  The outcome only matters if we make it matter and if we make it matter we have become emotional about it which means that it is very likely that we will fail at some point.  If you know that your trading method will work about 70% of the time you also know that it will not work about 30% of the time, so what’s the problem, make your trades with no attachment to the outcome while monitoring your progress making sure that the 70% – 30% percentages continue to apply and make some money.  If you win 70% of the time you should be profitable.  Each trade in our trading business is just a business decision.  Some business decisions work out and some don’t, appreciate the ones that work, learn from the ones that don’t and leave the emotions out of trading, my observation is that emotional traders rarely succeed. 


In today’s article I would like to talk a bit more about the topic of trends.  Specifically, how we can use moving averages to help us know if a trend is moving up or down.  It is critical in your trading to be able to identify whether or not the trend is bullish or bearish.  In the past we have discussed using price action as a way to identify these directions but today we will look at using a simple indicator to help in clarifying what we are seeing on the charts.

First, I want to review the moving average indicator.  This is an forex indicator that has many uses and can even be used to look for entry and exit points.  The basic idea of a moving average is to show us what the average price is of the currency, stock or futures chart we are looking at.  Moving averages can be both short term or long term and can give us an idea of the bullish or bearish nature of the chart.  A short term moving average would give us the near term momentum while a long term moving average will give us a longer term view of the direction the price has been moving.  With this indicator you can choose the amount of time the moving average is using.  The simple moving average is the most commonly used average and simply takes the closing price of the chosen time period and adds them together, then divides by the time period chosen.  So with the 20 period simple moving average it would take the closing price of the last 20 bars, add them together, then divide by 20.  This number would then be plotted on the chart to give you this average price.

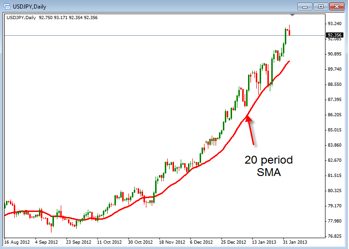
Take a look at this chart below which show a red line.  This red line is the 20 period simple moving average and shows us where the average price currently is located.  It also show you if the average price is getting higher or lower.  This movement, up or down, is what we can look at to help us identify the trend of the chart we are trading.  This chart is a daily chart of the USD/JPY.

One thing to remember is that this moving average line will change base of the the time frame chart you are using.  In this chart the period we are using is the daily chart, this means that the simple moving average is looking at the past 20 day to give the average price.  If the chart had a period of 15 minutes, then the simple moving average would represent the average price over the last 20, 15 minute bars (or last 5 hours).  In either case it give us the direction price has been moving during the chosen time period.  You can simply look at this line to tell you if there is a bullish up trend or a bearish down trend.  The you can look to trade in that direction.

Knowing that the average price has been going up or down is no guarantee that the it will continue to move in that direction, but it does give us the suggestion that it can continue to move in that direction.  This is what the trend tells us, not that it will, but that it is likely to continue in the current move.  Bullish and bearish trend come as price is pushed up or down and using the moving average is one way to help us better see these trends.

I have heard it said time and time again that the first thing that you need to do to succeed at anything (including internet stock trading)  is to show up, some say that everything after that is just details.  This is a very true statement when it comes to trading regardless of the market or markets that you are trading in.  Generally speaking if you are trading right or if everything is going well for you with your trading it can be quite boring.  You can trade very short term which can create allot of excitement but if you are in a longer term trade that is working other than monitoring and moving stops as necessary or whatever your management model tells you to do, generally speaking there isn’t much to do around it sometimes for extended periods of time.

Looking at a daily chart day after day or any time period chart period after period and not seeing any investment opportunities that have setup according to whatever your trade setup criterion are can be frustrating and little defeating in a way sometimes seeming like it is a waste of time.  When you look back at your charts however you may see specific entry points for trades that would have worked out well that you did not participate in for one reason or another very possibly because you did not see them when they first presented themselves.    If you would have looked at the charts at the close of every time period that you are trading on you would have never missed a trade setup however looking at the charts only when it is convenient is much easier.  Unfortunately it is also a very lazy way to trade which may take what you think is you’re trading business away from being a business and making it more of a trading hobby.

The first line of this article states that the first thing you need to do to succeed is to show up so showing up at the end of each period that you are trading on is essential.  The choices that you make after that are the details but physically being in front of your computer to know if there is an opportunity for you is essential.  Looking at the charts for a few minutes at the end of each interval can get to be a hassle especially during very flat or quite times in the market but getting into the habit of being there regardless of the result is not much different than placing a trade order that meets your requirements regardless of any other external factors.  It is very easy to come up with a multitude of reasons why you shouldn’t enter the market often times many traders can do this even if they get a setup that they like. 

Being as unattached and unemotional as possible is the best way to succeed as a trader knowing that regardless of what else happens you will succeed X% of the time.  As long you know what X% is and you can actually achieve it there isn’t allot of thinking that we need to do we just need to show up, follow our rules, realize a successful trade or an unsuccessful trade and then go on to the next trade.  Over thinking about why it is a waste of time to look at the charts at every interval and then over thinking about the trades themselves are two of the surest ways you can fail as a trader.  If you can be disciplined and get yourself out of your own way you are a lot more likely to succeed.


As with most things, it is generally wise to start with things you are familiar with and understand first, then branch out to other things as your interests and portfolio warrant it.  So the best way to get started with ETFs is to become aware of what is available. Generally, I separate the ETF market into three broad categories:

  1. Equity  ETFs
  2. Bond ETFs
  3. Commodity ETFs

Now within each broad category there is generally a broad selection and no shortage of creativity on the part of the issuers.  There are bull market ETFs that follow the uptrend of the market. There are bear market or inverse ETFs that are constructed to follow the downtrend of the market.  There are leveraged ETFs that are leveraged to double or triple the market’s average move.  There are sector ETFs that follow a basket of stocks in a particular market sector like technology or real estate, for example.   In the category of Index ETFs, there are ETFs that cover large caps, medium caps, small caps, international index funds and emerging market funds. The choices almost seem endless and just when you think you know them all, more ETFs pop up.  Especially with the international ETFs, while the U.S. ETF market is fairly mature, the international markets are just getting started.

My best advice to those getting started in ETFs is first, start with something you know and are familiar with.  If you are involved and have knowledge of certain industries, say “high tech” look at one of the Technology Sector ETFs.  If you follow the broader market, a good index fund could be the place to start.  If you are looking for international growth, look to one of the established international equity index funds.  Secondly, make sure you know the “true” objectives and goals of the fund.  With so many ETFs now available, be sure to check out the fund’s holdings with a little bit of research.  Sometimes the official title of the fund can be a bit generic or the funds can alter their course from their original objectives.  One can find out much about a fund with a 10 second search on the internet and can save a lot a second guessing and stress down the road.  But a word of CAUTION concerning “leveraged” ETFs,  some have performed very well in the most recent market rally, but as always, what goes up quickly can do down just as fast or faster, when the market reverses and  all your profits  can quickly evaporate, so beware!

So like any investment, first identify your investment objectives.  Make sure your objectives are clear and practical.  Second, do your homework to make sure what you are investing in will meet your objectives!  Third,  don’t put all you “eggs in one basket,” in other words, even in the ETF world, spread you risk around by diversifying, so that you are not putting all you money into just one or two Funds.   Portfolio Risk Allocation rules should be used when investing in any market including ETFs.  With so many choices, have fun with the huge variety of funds.  ETF investing can become enjoyable as well as profitable.  Remember to enjoy the journey as well as the destination and ETFs are a good place to start.

Today I want to discuss a commonly looked at and used price pattern called the head and shoulders pattern.  This price pattern falls into the category of a reversal pattern.  A reversal pattern is one in which the price action that has been occurring is likely to reverse the direction.  These reversal patterns typically occur after a larger move in one direction a happened.  Once these patterns have been formed you would look for a major change in the direction of the price. 

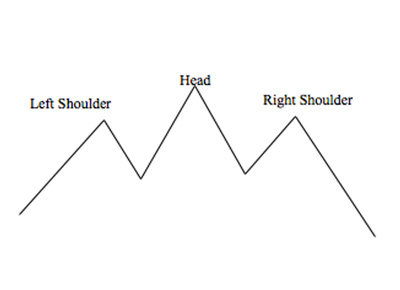
In order for the head and shoulder formation to occur you will see the price make a pattern that looks like a head with a shoulder on either side of the head.  In theory the price pattern should look something like this picture below.

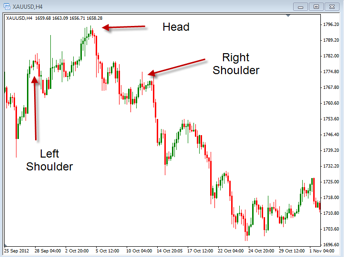
The first part of this pattern in created by making a swing high that creates the left shoulder followed by another higher swing high creating the head then ending with the lower swing high forming the right shoulder.  This is a textbook picture of the head and shoulders pattern but may not be what is seen normally in the real market.  Compare the picture above with the actual market below to compare what it might look like in reality.

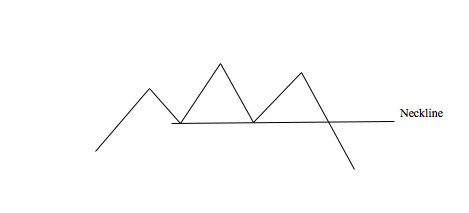
So you can see that there is quite a bit of difference between the actual chart and the theoretical chart.  When you are looking for these you need to be able to pull the price pattern out of the chart.  Even though they may not look exactly like the drawn picture above, you will occasionally find some that look pretty close. Finally, in order to know when to enter a trade you would wait for the price break below what is called the “neckline”.  Notice that the picture below shows where this would be located. 

Once the neckline is broken you can set a target the is the distance between either the left shoulder and neckline or the head and neckline.  Remember, this is a price pattern that can give us an idea that a change may be coming.  But, we do not trade it until the neckline is broken to confirm the reversal is happening.  Take some time to review this pattern and see if it can help you better identify times when the market is likely to reverse.

Today I would like to give you a bit of stock trading training and discuss looking for clues to find good entries when trading with the trend.  A trend in the markets can be a very fickle; they go on runs then fizzle, start and stop, continue and reverse.  Once a trend forms is won’t go straight up or down but will have areas of retracement or pull back. The very nature of the market forces of supply and demand assures that there are natural levels of profit taking in most market moves.   One of the most important elements of successful trading is identifying these “resting” points and if they are just “resting places” or are they are actually a market reversal or a “change in direction.” This is where analysis of price action comes in.  We can use certain price patterns based on this price action to help determine if these pull backs are possible setups for an entry.

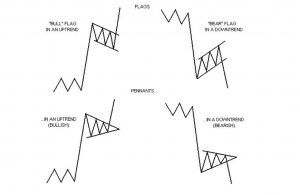
One type of price pattern we can use is a continuation pattern such as a Bull Flag or Bull Pennant for an uptrend continuation or Bear Flags and Bear Pennant for a downtrend continuation.  These patterns help us to identify areas of continuation, looking at a pull back or a consolidation and resumption of current trend after the pull back. Here are some examples of what these continuation patterns look like:

Flags and pennants can be generally categorized as continuation patterns. These price patterns usually show brief pauses in a strong trend.  They are usually seen right after a larger quick move. The market will often pick up again in the same direction. Over time these continuation price patterns are very good at identifying potential entry points.

Bull flags are characterized by lower tops and lower bottoms, with the pattern slanting against the trend. But unlike wedges of a Bull Pennant, their support and resistance lines run parallel.

Bear flags are comprised of higher tops and higher bottoms. “Bear” flags generally slope against a strong down sloping trend.

Pennants are similar to flags but are not parallel and look very much like symmetrical triangles. Pennants are also generally smaller in size or volatility and duration than Flag patterns.

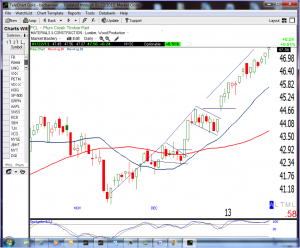
Here is a recent example of a classic bull pennant and a bull flag in an Uptrend market for symbol PCL:

Note in the graph above that after a move up, the Bull Pennant is formed by the lower highs and lower lows in a triangle pattern and once it broke above the pennant it resumed the bullish uptrend and then a Bull Flag formed by more parallel lower highs and lower lows running against the uptrend, and once the pullback is “broken” the price breaks out and continues the previous up trend for a very positive gain.  The best way to take advantage of this pattern is to set a “buy stop” entry order close to the top of the pullback so that if the trend resumes to that level you would be triggered into the trade to take advantage of the continuation.  The same patterns apply to a bearish trend but in the reverse pattern and with a “sell stop” entry order.

Trader’s Challenge:   Look for these Flags and Pennant price patterns as a great way to identify entry points after they break out of the pullback.


Whether traders really think much about it or not they must overcome the question, “Is trading an art or a science?”  Different traders will give you different answers with technical traders likely stating that it is a science and fundamental traders likely stating that it is more of an art.  I believe that if you do not look at trading as an art and a science at some point in your trading career you may hit a roadblock and you may even end up losing on some trades when you really should win.

I believe that traders that strictly view trading in one way may hurt themselves in the long run because not only is trading about how indicators line up and what the price action is doing relative to them it is also in part based on the experience and feel that the trader has for trading.  Trading is just like anything else; with experience you will know when it is likely that something will work out even though it may not look good on paper.  You will also know based on past experience which situations have worked for you and which have not regardless of what anyone or anything may say should or should not work.  The more you look at charts the more you will see because you will begin to recognize recurring situations.

Generally speaking trading is recognizing a move that is taking place in the market as early in its development as possible.  It may sound a little painful but studying charts will help you to recognize moves that are likely to take place so you can take advantage of them.  You will get a feel for the ebb and flow of the market or the specific issue that you are watching. 

I have always noticed that traders in general are habit forming in the respect that they seem to go back to the same issues that they have traded in the past looking to trade them again.  It seems as though once they have traded a security and have succeeded with it they get the feel for how it moves, they get to understand a little about the range it trades in and its tendencies and it seems as though it is a little easier to pull the trigger to trade an issue that they have traded in the past.  It seems as though traders almost believe that they have created a relationship with specific stocks or whatever security it is that they are trading.  This is definitely not a bad thing because if you believe that you are in tune with a security you may well be.

One my first lessons in trading stocks happened when I was in my late teens, I had a friend that was dating an older woman that was an experienced stockbroker so I mentioned to her a specific stock that I was interested in buying.  When she asked me why I wanted to buy it I couldn’t give her any other reason than because the way the price movement looked to me I believed that it looked like it would go up.  She told me that if you have a gut feeling about buying a stock that is strong enough for you to actually buy it more times than not you will probably be right; fortunately we were both right in that situation and the trade worked out well.  The point is that including your intuition into your trading can be just as important as any indicator or any trading tool that you will ever use.  I know there have been plenty of times when I have not traded a given issue because it didn’t feel right to me regardless of what the technical’s have told me to do and there have also been times when I jumped into the market when the technical’s were not very strong.  I’m not saying to constantly break your own trading rules but I am saying to pay attention to your gut and to the little voice in your head when it speaks to you.