Yesterday I showed you two longer term forex charts for the Euro and the GBP. I want to continue with a few more charts so you can see first hand what kind of momentum we’ll be working with to start the year.
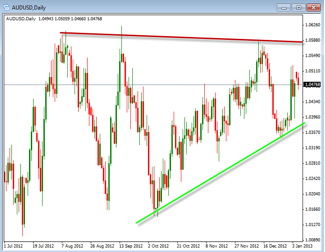
AUDUSD
The AUDUSD is a bit more in consolidation and where we might look for some shorter term trades as the price moves between support and resistance. This is also where we will be looking for a break out either above the resistance or below the support area. On a break out we will look to trade in that direction as the new momentum is likely to continue moving the price for some time.
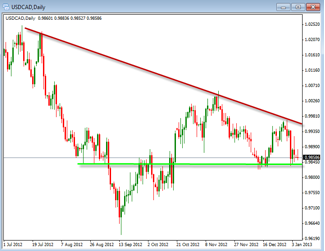
USDCAD
The USDCAD is really looking like it wants to break out as the converging of the support and resistance lines are becoming tighter and tighter. On a break out of these two area look for a nice continuation move either higher or lower. This type of pattern is nice to trade because it is simple to know when to look for entering into a position.
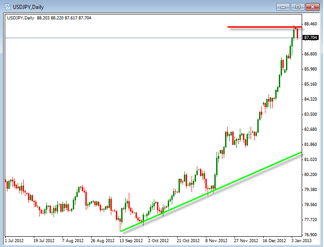
USDJPY
The USDJPY is a difficult one to trade right now as the momentum has been so strong to the upside. After a big move like we have seen it is usual to see some type of pull back into the trend. This will be one that we should look for a trade after the pair moves back down. This may be several days or weeks before this happens so keep an eye out for this move. Also, you may consider going to a shorter time frame in order to take advantage of this strong bullish momentum.
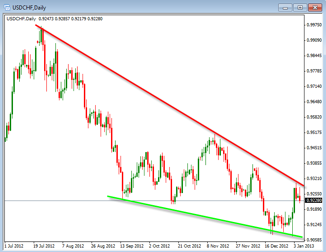
USDCHF
This pair is also forming a bit of a long term wedge as the support and resistance lines are converging on each other. This tightening pattern is where we can also look for a breakout but is also good to look for a bounce down off of the resistance area where it is currently hitting. Look to short this as it begins to move down from this point. Should a break out occur, look to trade in the direction of the move.
In the end we want to be able to see the trends and support/resistance areas on the longer term charts in order to determine how and when we should be trading. Take some time to do the same analysis on the weekly charts to see how they confirm the daily charts. The goal is to find good places to enter the trade by using trends and support and resistance in our evaluation of the charts.


