Today we are going to discus the concept of evaluating a chart based off of technical fundamentals for trading stock. What does that mean? Well there are certain things that need to be looked at on every chart in order to properly evaluate it for trading. As you trade your preferred strategy you will need to first identify some common technicals about the chart. These common things begin with looking at the trend, then following that by identifying the areas of support and resistance. Once these things have been identified you can then apply your rules to trading.
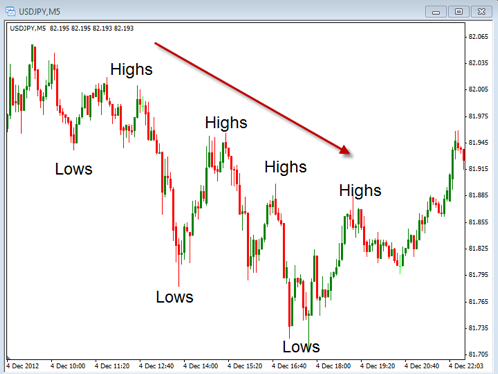
So, lets begin by looking at the charts below to see what we need to look for when identifying both the trend and support / resistance. In this first chart you can see an example of how to identify the trend by using only price action on the chart.
Notice that the action of price on the chart forms consecutive areas of lower lows and lower highs. This situation provides us with the information needed to consider this as a down trending pair. The opposite would be true if the prices were making higher highs and higher lows. In this situation the trend would be considered up. Regardless of what else you use on a chart to help you identify the trend you will always use price action to help confirm your conclusion as to whether or not the trend is up or down.
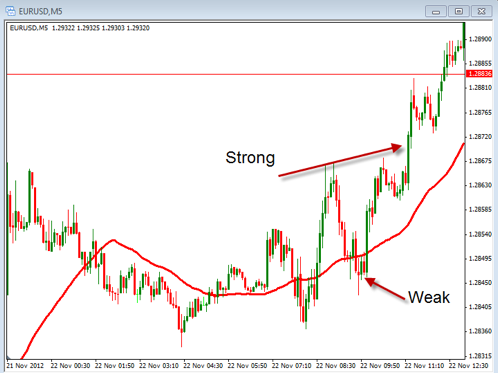
The next chart illustrates the trend by using a simple moving average with a period of 40. Here you can see and easily identify the direction that things are moving. An up trend would be in place if the simple moving average was going up and a down trend would be in place if the line is going down. You can also use the location of the price to determine the strength of the trend. If the line is going up and the price is above the line then the trend would be considered stronger than if the line was going up but the price was below the line. The reverse would be true for a down trend. Take a look at the chart below to see both a strong up trend and a weak up trend.
The other part of evaluating the chart from a technical stand point is to look for the areas of support and resistance. These can be discretionary in applying them but necessary as we look for places to enter our trades. The main idea for identifying these are to look for places on the chart, either horizontally or diagonally, that act as a barrier to price movement. If this barrier is stopping downward movement then it is acting as support. If the barrier is stopping upward movement then it is acting as resistance. In future articles we will discuss more about the topic of support and resistance.
As we learn to properly identify trends and support and resistance we can look to enter our trades at the best possible times. In the end we want to be entering in the direction of the trend when the price is near these areas of resistance or support. To go long we would want the trend up while price is sitting near support and is we are looking to go short we would want the trend down and sitting near resistance. Take some time to review this and apply it into your trading and while you’re here, check out a quick video I did on yet another easy trading method:

