Last week we introduced some of the basic concepts that are needed in order to properly analyze a chart. Today we are going to look a bit further into the first topic which is that of chart types. Chart types are important as they are what you are going to be looking at in order to determine if you are going to buy or sell. Being comfortable with the type of chart can also make it more enjoyable to look at and trade. There are several types of charts to choose from including bar charts, candlestick charts and line charts to name a few. As a side to the chart types you will also want to determine the chart time frames that you will be trading. Take a look at the chart types below to see what each one looks like.
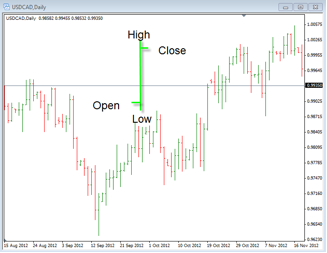
A bar chart is one of the most commonly used types of charts. Notice how it is formed with the open price as indicated by the left side hash mark while the close is the right side hash mark. It is also a way to show the high and the low with the top and bottom of the vertical line. With this chart type we can see where the price is moving and the momentum associated with each bar.
Another type of chart that can be used is the line chart. This type of chart is limited in what it shows us because it is only based on the closing price of the time period. These charts can give us a good idea of the momentum in that it is bullish when the line is going up and the momentum is bearish when the line is going down.
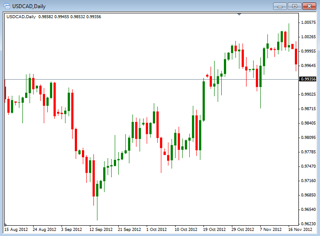
The candlestick chart is another one of the most commonly used charts. These are popular in part due to the fact that they are visually easy to see what the price movements have been. Similar to the bar charts but easier to see what is happening with the price movement.
Regardless of the chart type you choose you can get valuable information about the price action by looking at the charts. You need to become confident at looking at the charts and one of the first things to do is to pick which type of chart you will be using. Once this is done you can move to the next layer of evaluation which is to identify trends and support or resistance. Take some time to review what you are doing and make sure you can read your charts properly.


