What Are the Geopolitical and Economic Reasons for Oil’s Sell-Off?
In August, the global supply of oil hit a record high of 100 million barrels per day, as some of the world’s top producers attempted to “make up” for the supply lost from Venezuela and Iran. But judging from oil’s recent slide into bear market territory, this may have been an ill-conceived and unnecessary course correction.
Concerns over Venezuela and Iran were overblown: Fears that Venezuela’s implosion or Iranian sanctions would lead to higher oil prices seem to have been greatly exaggerated. Venezuela’s supply has been picked up by other players with ease, and the U.S. has exempted major oil importers like China from new Iranian oil sanctions.
Saudi Arabia and Russia haven’t said they’re cutting output: The rumors are circulating that they will, and OPEC appears ready to pull the trigger on cuts. But so far, the world’s top oil producers—mainly Russia and Saudi Arabia—are maintaining oil production as is.
The U.S. Continues to Expand Production: The U.S.—the largest petroleum producer in the world—has no plans to stop drilling. On Friday, the oilfield services firm Baker Hughes reported that 12 new rigs had been added to U.S. oil fields across the country. Meanwhile, advances in fracking have allowed U.S. drillers to profit from much lower oil prices.
And Here Are What Technical Indicators Are Telling Us
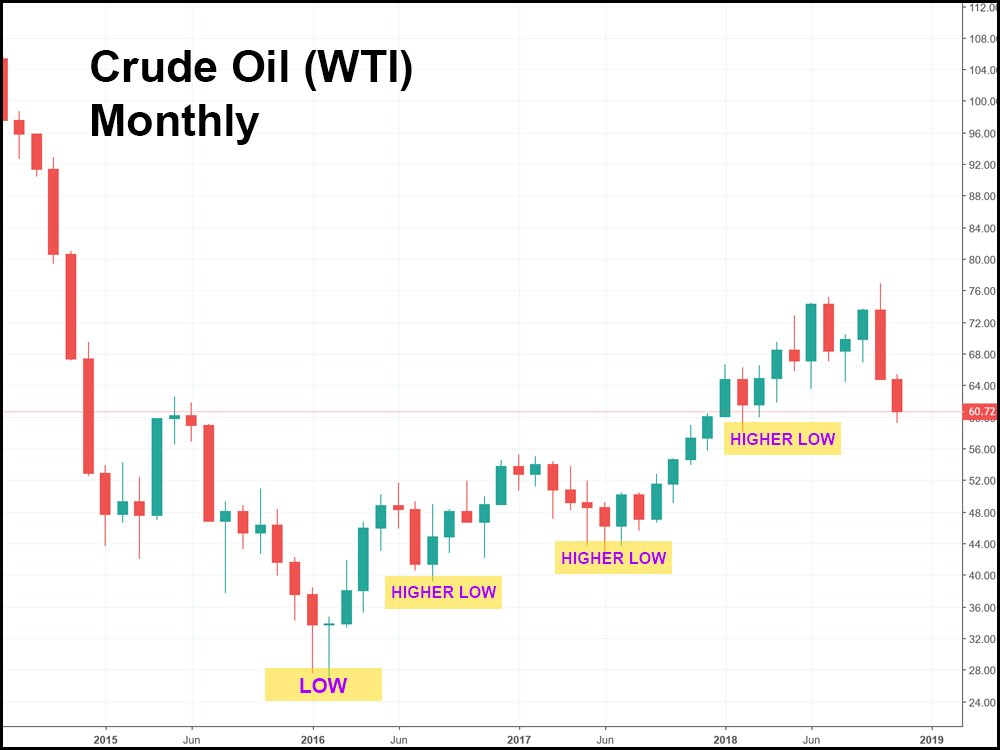
WTI has made a pattern of higher highs and lower lows since February of 2016, when the market fell to $26 a barrel. By July the price of crude had found support around the low $40s. And in September of 2017, a new bull market pushed the price back up to $80 a barrel—a price not seen since November of 2014.

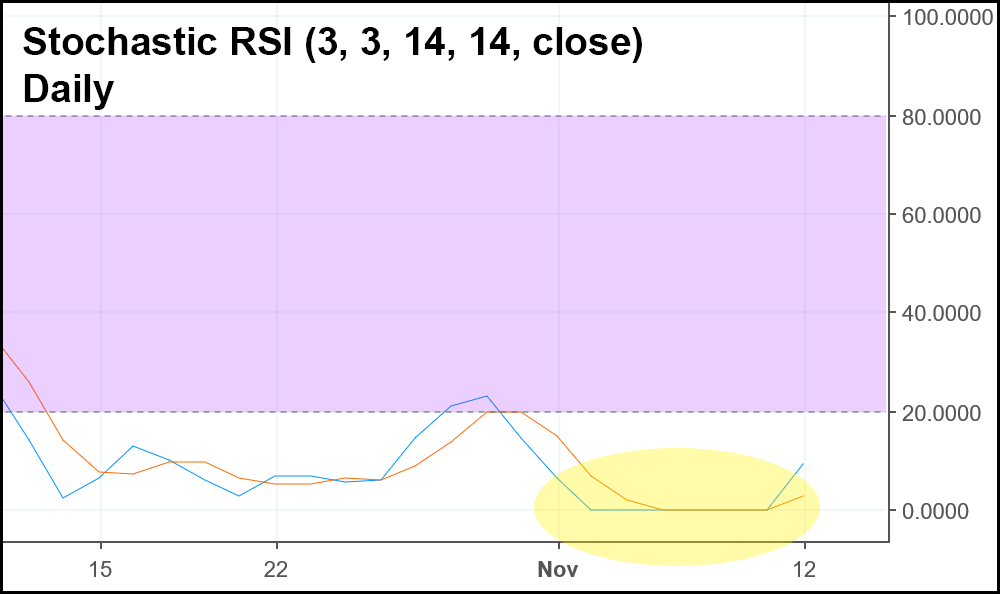
And after two weeks in the red, WTI crude looks oversold on key technical indicators:
Stochastic RSI on the daily has flatlined at 0 for 5 days in a row. The last time it did that was May of last year – where we saw a big jump back up.

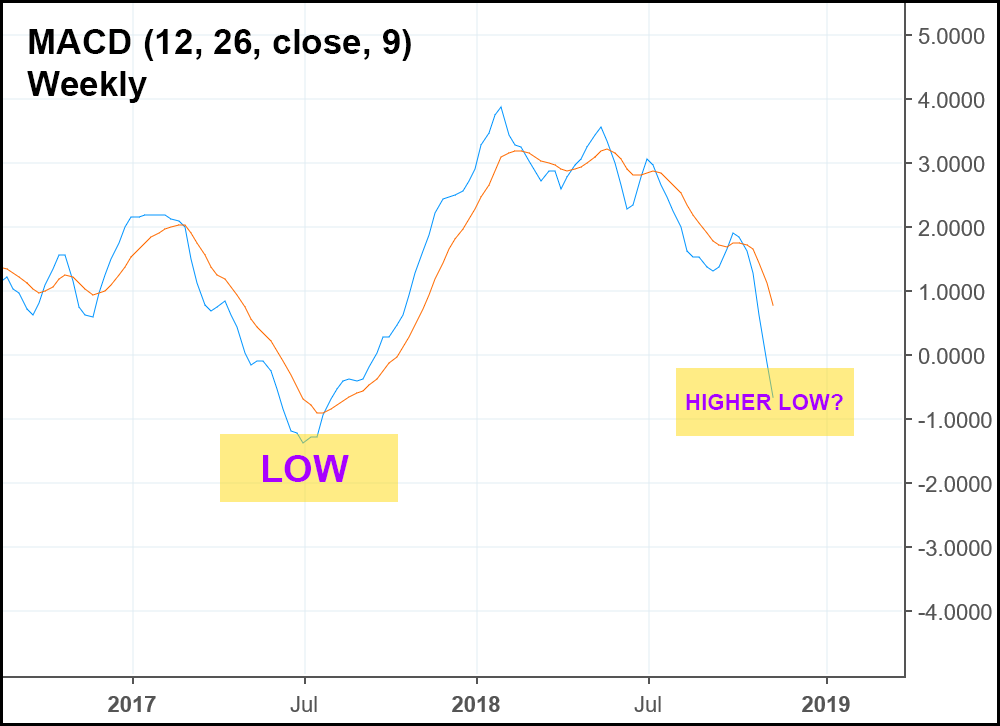
Meanwhile, MACD on the weekly charts has dropped to levels unseen since July of last year. Over the last few months, the MACD has set a series of lower lows – but a tick back upwards over the next week or two could set a higher low in the grand scheme of things. If a lower low is achieved, however, we would have a case of positive divergence (that began in July 2017), provided prices don’t plunge below $40, meaning that a steep recovery could be in order.

Searching for Support: Key Price Points to Watch
For two weeks now, WTI crude has been on a collision course with support located at $58.00 per barrel. That’s the low made by the market in February of this year.
With most indicators oversold and support in sight, this could be a turning point for crude to reverse—at least for the short term.
However, if the market blows through this price, it means the geopolitical and economic fundamentals mentioned earlier are simply too risk-heavy for traders to take a bullish stance. The price may then consider a bounce at around $55 a barrel, the location of past resistance (which could now be support) or even lower, to key support in the low $40s.
Regardless of the price action, this is definitely a market to keep an eye on throughout the next few weeks. WTI crude has a major effect on market sentiment, and if this commodity takes a turn for the worse, U.S. equity markets could quickly follow.


