Important Disclaimer: All Profits Run programs are delivered in self-paced, digital format. We do not provide personal coaching, one-on-one mentoring, or individualized trading advice. Our educational materials are designed for independent study and application.
Risk Disclosure: Trading involves substantial risk of loss and is not suitable for all investors. Past performance is not indicative of future results. You should carefully consider whether trading is suitable for you in light of your circumstances, knowledge, and financial resources. You may lose all or more of your initial investment. Opinions, market data, and recommendations are subject to change at any time.
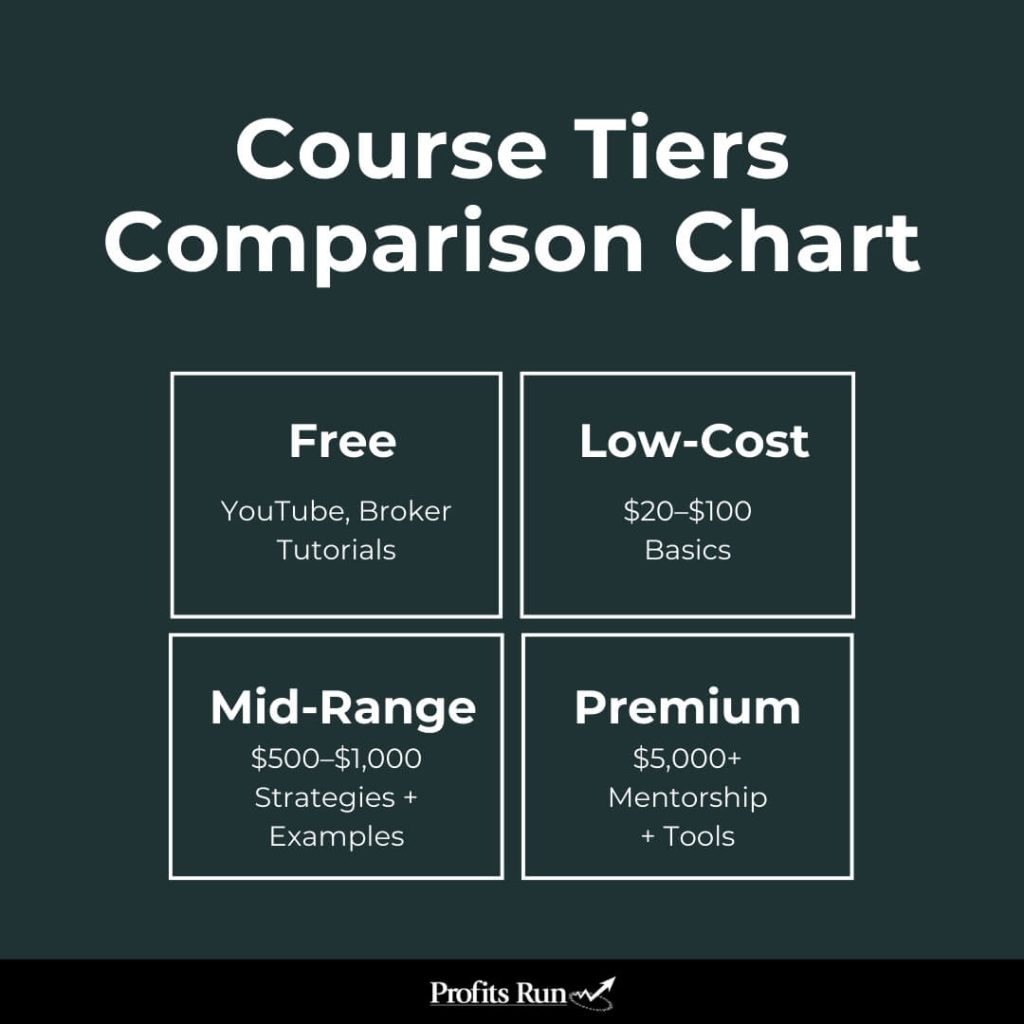
Before we look at paid programs, it helps to understand what you can get for free.
Many traders begin with resources like YouTube tutorials or the educational sections offered by major brokerages such as E*TRADE or TD Ameritrade. These resources provide a no-cost introduction to options trading and can give beginners a basic understanding of concepts like calls, puts, and strike prices.
What free options trading courses usually include:
Advantages:
Limitations:
These limitations aren’t just inconvenient. They can be costly. FINRA, the Financial Industry Regulatory Authority organization that regulates trading, warns that “important regulatory concerns arise when investors trade complex products without understanding their unique characteristics and risks.”
This shows why learning just the basics from free videos might not be enough to trade options safely.
For newcomers who simply want to “test the waters,” free education can help clarify whether trading options is right for them. Free education is a helpful introduction, but without structure or feedback, most traders eventually find themselves stuck at the surface level.
If you’ve looked on platforms like Udemy or Coursera, you’ve probably seen options trading courses priced anywhere from $20 to $99.
These budget-friendly programs are attractive to beginners because they promise a structured introduction without a big commitment.
What’s usually included in low-cost courses:
Who benefits most:
Limitations to keep in mind:
These courses can provide a solid overview at a low price point, but they are best thought of as a first step, not a complete solution. For anyone serious about developing a repeatable process, low-cost courses often fall short of providing the structure and guidance needed to succeed.
After beginners move past introductory material, many look toward mid-range options trading courses priced around $500 to $1,000.
These programs usually offer a more complete roadmap than budget courses, and some include interactive elements that help bridge the gap between theory and practice.
What’s typically included in mid-range courses:
Who benefits most:
Limitations:
Mid-range courses strike a balance between affordability and depth, but their effectiveness often depends on how much personal support and practical application they provide.
A trader can learn solid strategies here, but without consistent coaching, it’s easy to struggle when real market emotions come into play.
Remember: All trading involves risk of loss. Never risk more than you can afford to lose
At the top end of the market are premium options trading courses and memberships, often starting around $5,000 and extending well beyond that. These are designed for traders who are fully committed to making options a core part of their financial strategy.
What’s typically included in premium programs:
Who benefits most:
Considerations:
Premium programs provide the most comprehensive education and support tools, but they demand both financial commitment and the mindset to treat trading as a serious business.
For motivated traders, this investment can accelerate learning and build a stronger foundation for long-term results.
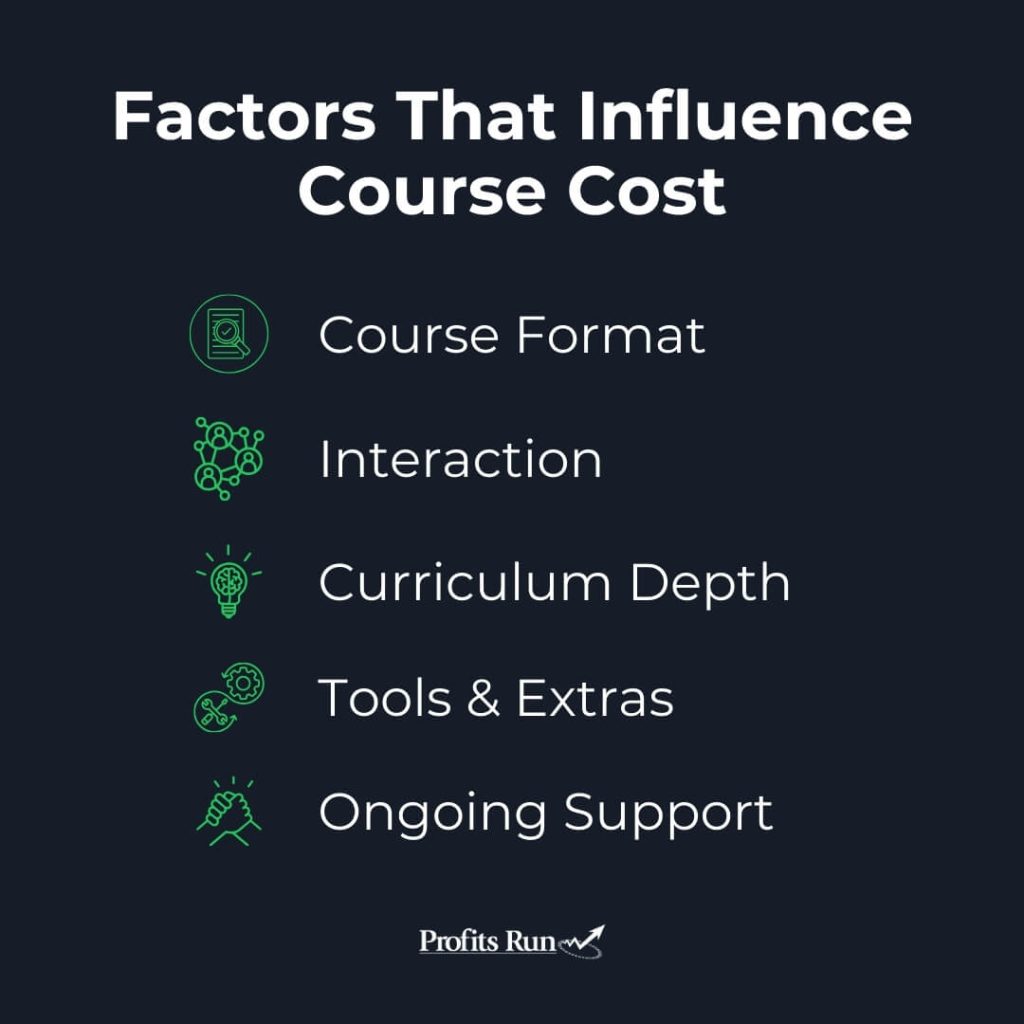
The wide price gap between courses isn’t random. Several factors directly affect what you’ll pay, and more importantly, what you’ll get in return. By understanding these drivers, you can better judge whether a course’s cost matches its actual value.
Self-Paced Video Lessons
Courses that consist of pre-recorded modules are the most affordable. They’re easy to scale because thousands of students can watch the same videos without added effort from the instructor.
This keeps costs down, but you sacrifice interaction and feedback.
Live Classes & Workshops
Programs that include scheduled webinars, live Q&A, or real-time trading sessions often cost significantly more because the instructor’s time is limited, and live interaction adds accountability and clarity.
For example, a trader struggling to understand spreads might get their question answered immediately in a live class, something a video-only course can’t offer.
The degree of interaction varies widely between courses. At the lower end, you’ll only get pre-recorded videos.
At higher price points, programs may include group discussions, trade examples, or interactive sessions. The more hands-on the delivery, the higher the cost.
A budget course may stop at basic definitions like what a put or call is and when to use it.
A more advanced program, however, might cover spreads, volatility strategies, portfolio hedging, and income generation.
Many also emphasize risk management and trade planning, key skills that separate casual learners from consistent traders.
The importance of comprehensive risk management education is so critical that the Federal Reserve requires extensive options risk management training even for professional bank supervisors who regulate the industry.
It may also layer in practical skills like setting stop-losses, scaling into trades, or balancing risk across positions. The broader and deeper the curriculum, the more likely you’ll pay toward the higher end of the spectrum.
Some programs include valuable add-ons like stock screeners, options analytics, or alert services.
For example, receiving text alerts when a specific trade setup occurs adds immediate, practical value. These extras can save traders hours of research and increase confidence, but they raise the overall cost of the program.
Many traders need reinforcement beyond the initial lessons. Membership programs that provide communities, regular strategy updates or trade alerts often carry a higher cost. At the same time, they help students stay engaged and continue refining their process over time.
In the end, options trading course costs scale with access, personalization, and support. A lower-priced course gives you the basics, while higher-priced programs charge for the mentorship, tools, and structure that accelerate your growth.
The price of an options trading course tells you part of the story, but cost alone doesn’t guarantee results. What matters more is the value you get and that depends on how well a program translates theory into real-world trading skills.
One of the strongest indicators of value is feedback from past students. Programs that consistently receive positive reviews often emphasize clarity, real-world application, and ongoing support.
On the other hand, a course that looks polished on the surface but has little evidence of helping traders succeed may not be worth the investment.
Paper trading accounts, trade simulators, or structured practice exercises add enormous value. These tools allow students to apply strategies in a safe environment before putting real money at risk. Without practice opportunities, even the best lectures remain abstract.
Trading options requires managing emotions under pressure. Finance studies show that psychological factors significantly impact trading decisions and explain many market patterns that pure logic cannot.
This is where quality courses with mentorship or coaching components provide enormous value. When real money is at stake, fear and greed can override even the best-planned strategies.
Programs that address the mental side of trading help students recognize emotional triggers and stick to their rules when markets get volatile.
Trading options requires more than memorizing strategies. It demands a disciplined process.
The importance of structured learning goes beyond just trading. Research from Oxford University shows that people who learn financial skills from trained instructors do significantly better than those who try to figure it out on their own.
The study found that guided learning led to 20% fewer financial mistakes even three years later.
This backs up what successful traders already know: having a clear plan and expert guidance beats trying to learn everything yourself.
Markets evolve, and so do strategies. A valuable course keeps pace with changes, offering fresh lessons, updated examples, and guidance for new market conditions.
Static content can become outdated quickly, especially in a market where volatility and liquidity shift over time.
Ultimately, a course proves its value if it helps traders make better decisions that protect or grow their capital.
A $1,000 program that prevents costly mistakes could be worth far more in the long run than a cheaper course that leaves gaps in your knowledge.
The most effective programs don’t just deliver information. They provide the structure, tools, and support to help traders develop confidence and stay consistent over time.
Remember: All trading involves risk of loss. Never risk more than you can afford to lose
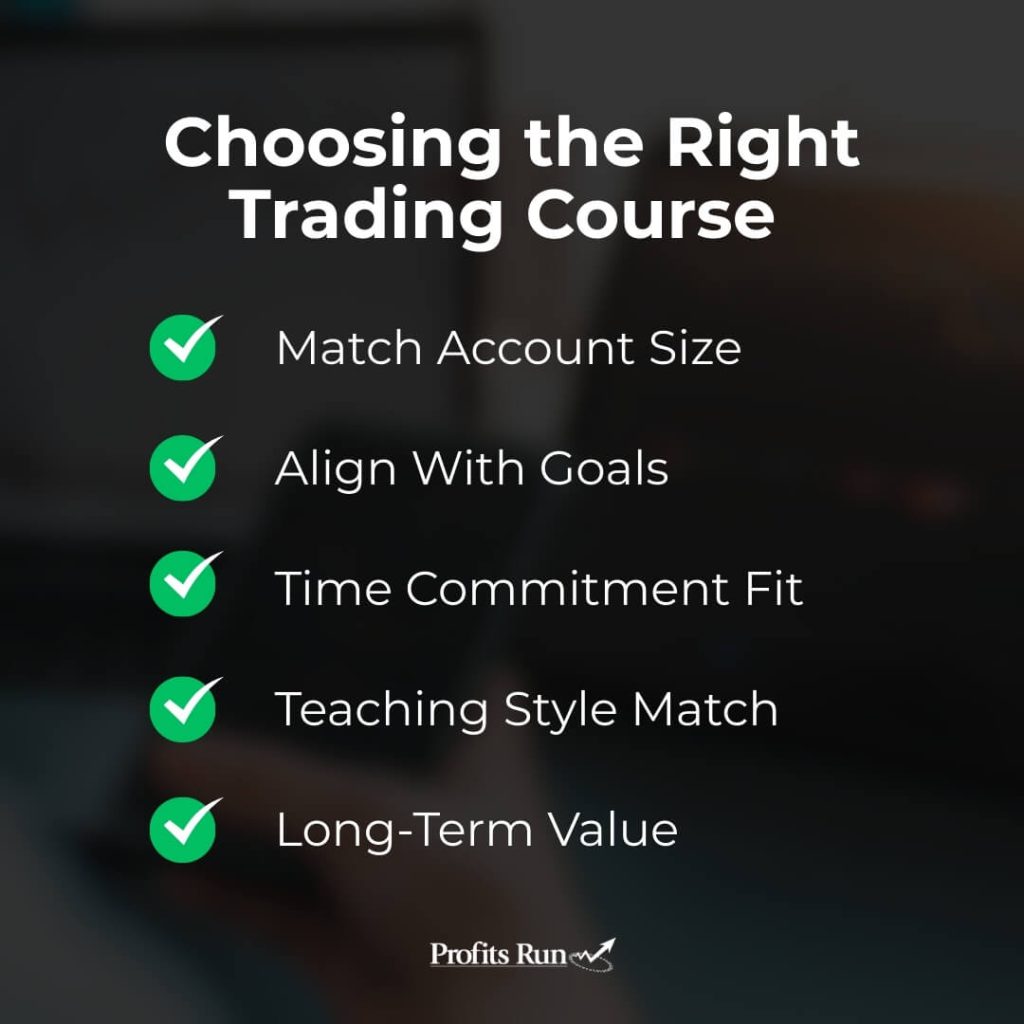
With so many courses available, from free videos to multi-thousand-dollar memberships, the real challenge is figuring out which one fits your situation.
The best choice depends on where you are today and where you want to go.
Some strategies, like covered calls or spreads, work best with larger accounts, while others can be applied in smaller portfolios. A course that matches your account size ensures you’re learning strategies you can put to work.
Are you looking for steady supplemental income, long-term retirement growth, or a chance to replace your 9-to-5 income?
Different courses emphasize different outcomes. The clearer you are about your goals, the easier it is to pick a program that supports them.
If you only have a few hours each week, a self-paced course with short, structured lessons may fit better.
If you’re ready to dedicate more time, a comprehensive program with daily examples and updates can provide more depth.
Some traders learn best through video examples, others through step-by-step checklists and frameworks. Reviewing course previews or outlines can help you decide if the format matches how you learn best.
Instead of focusing on price alone, ask whether the course provides strategies and tools that will stay useful over the years of trading.
A one-time crash course may give you information, but a program built on rules and repeatable processes will deliver more lasting results.
Choosing the right course is about aligning your current resources and future goals with a program that teaches strategies you can realistically apply.
Options trading courses range from free resources to memberships costing thousands of dollars. Each price tier offers something different, whether it’s introductory knowledge, structured strategies, or advanced tools.
But cost alone doesn’t determine success. The real measure of value is whether a course gives you the clarity, structure, and discipline to trade with confidence.
That’s where Profits Run stands apart.
If you’re comparing the true value behind course costs, Profits Run delivers a strong balance between affordability, structured education, and long-term usefulness.
Start your journey today and discover why Profits Run is one of the most trusted names in options trading education.
Ready to Start Trading Smarter Without the Guesswork?
Get the exact same strategies we use to help thousands of everyday traders trade with more clarity, confidence, and control.