In today’s article I would like to talk a bit more about the topic of trends. Specifically, how we can use moving averages to help us know if a trend is moving up or down. It is critical in your trading to be able to identify whether or not the trend is bullish or bearish. In the past we have discussed using price action as a way to identify these directions but today we will look at using a simple indicator to help in clarifying what we are seeing on the charts.
First, I want to review the moving average indicator. This is an forex indicator that has many uses and can even be used to look for entry and exit points. The basic idea of a moving average is to show us what the average price is of the currency, stock or futures chart we are looking at. Moving averages can be both short term or long term and can give us an idea of the bullish or bearish nature of the chart. A short term moving average would give us the near term momentum while a long term moving average will give us a longer term view of the direction the price has been moving. With this indicator you can choose the amount of time the moving average is using. The simple moving average is the most commonly used average and simply takes the closing price of the chosen time period and adds them together, then divides by the time period chosen. So with the 20 period simple moving average it would take the closing price of the last 20 bars, add them together, then divide by 20. This number would then be plotted on the chart to give you this average price.
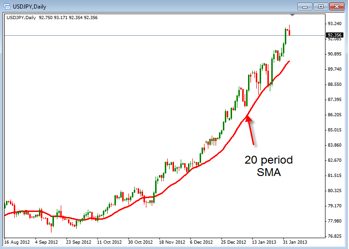
Take a look at this chart below which show a red line. This red line is the 20 period simple moving average and shows us where the average price currently is located. It also show you if the average price is getting higher or lower. This movement, up or down, is what we can look at to help us identify the trend of the chart we are trading. This chart is a daily chart of the USD/JPY.
One thing to remember is that this moving average line will change base of the the time frame chart you are using. In this chart the period we are using is the daily chart, this means that the simple moving average is looking at the past 20 day to give the average price. If the chart had a period of 15 minutes, then the simple moving average would represent the average price over the last 20, 15 minute bars (or last 5 hours). In either case it give us the direction price has been moving during the chosen time period. You can simply look at this line to tell you if there is a bullish up trend or a bearish down trend. The you can look to trade in that direction.
Knowing that the average price has been going up or down is no guarantee that the it will continue to move in that direction, but it does give us the suggestion that it can continue to move in that direction. This is what the trend tells us, not that it will, but that it is likely to continue in the current move. Bullish and bearish trend come as price is pushed up or down and using the moving average is one way to help us better see these trends.
