Find The Momentum of Trending Forex Pairs With Stochastics

The Stochastic Oscillator is a technical indicator that looks at the closing price of the currency pair and compares it to the price range over a specific period of time.  As this time period is lowered, the more sensitive the indicator becomes.  If you are interested in knowing the formula it looks like this:

%K = 100[(C – L14) / (H14 – L14)]

C is the current closing price

L is the low of the last 14 bars

H is the high of the last 14 bars

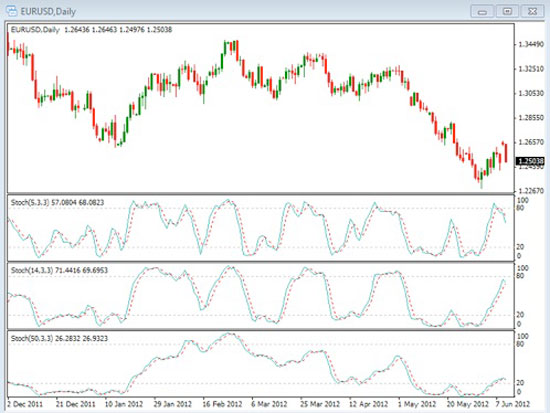
The number 14 is used as an example.  This can be any number of time periods you would like to use.  In the chart example below you can see an example of 3 different time period of the stochastic indicator.  The top is the 5 period, the middle is the 14 period and the bottom is the 50 period time frame.  Notice that the shorter term (5 period) stochastic is much more sensitive than the longer term ones.

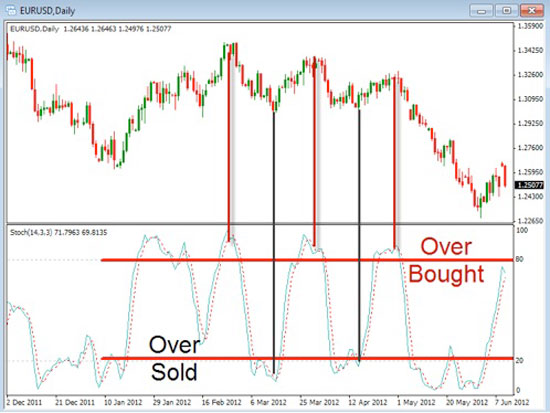
The idea of using the stochastic indicator is to help us identify the momentum that is currently happening on the price chart.  The way that we read the stochastic indicator can be varied depending upon what we are trying to do.  One of the most common way is to look for the indicator to enter into the areas of overbought or over sold.  This can give us an idea of when the price may be slowing down or beginning to reverse the current direction.   In the chart below you can see an example of what happens when the indicator enters these areas.

Notice the red vertical lines show where the price has entered the Over Bought areas and the black lines show the Over Sold areas.  When the price moves into the Over Bought area look for the price to slow the upward momentum and when it enters the Over Sold area look for the price to slow the downward momentum.  Although it does not guarantee the price will change direction, it is a good indication of where things may slow down.  When you use this in conjunction with the trend it can give you an even better idea for how things may move.

Take some time to review and practice using the Stochastic indicator to see if is can help you in your trading.

Do You Know What the 3 Keys to Trading Succes Are?

I know that as traders, we tend to over complicate things. We’re always on the hunt for the next indicator, or the next hot tip, or the next whatever it may be that gives us an advantage in the market. It’s in our nature, and in most cases, it’s not a bad thing… it just shows that we’re a group of driven people with common goals.

BUT, sometimes, you just need to take a step back. Take a step back and look at the big picture. In this moment of “Trading Zen” things can become clearer and you can have the open mind to concentrate on what’s important. Not to sound hokey, but I recently took a little moment to refocus my trading goals, and did some deep thinking about what really makes a successful trader. Now, I’ve been around the block a few times, and I consider myself to be not only a veteran trader, but a successful one.

What I came up with is this: My Three Keys to Trading Success:

  1. Be Smart by diversifying.  Do not put all your “eggs in one basket.” In volatile market conditions like we are in right now, it is more important than ever to diversify your portfolio.  I like to use ETF’s for this purpose, as you can enter into one trade and be diversified across an entire sector or in the case of index fund across the broader market.
  2. Be Patient.  It is critical that we focus on long term success.  Many small gains can lead to overall success in the long run.  Avoid the temptation to “go for it” all at once.  The traders who fail are generally the traders who lose a lot on just a few large trades that go against them.  Keep your risk per trade very low (1 to 2 percent max).
  3. Be Realistic.  The key here is to trade with reasonable expectations. It is important to understand that not even the best systems are perfect and will have losses. Also, we can never time the market perfectly. The best systems identify the trend and look for confirmation before entering the trade.  Even a 50% winning ratio can be very successful if we can cut our losses short and let our profitable trades run so that we can earn more on the winners than we lose on losers.

If we diversified in our positions, use proper risk management by trading small positions with the long term in mind, and are realistic with our wins/losses we set ourselves up for long term success.

Sure, it can always be more complicated than that, but it doesn’t have to be. If you follow my advice, I’m certain your trading will improve along with your account size.

This Happens Right Before The Bulls Take Over…

Hi everybody, Bill Poulos here and today I want to go over yet another candlestick pattern that I think can really benefit your trading. Now we’ve all heard the term “the trend is your friend” and boy, does this one do a great job of pointing out an upcoming trend.

The pattern I’m talking about today is none other than: The Bullish Engulfing Candlestick.

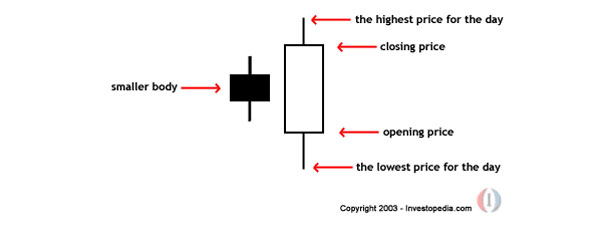
Now these patterns are most likely to show themselves at the bottom of a downward trend, and they consist of two candlesticks that look like this:

Another way of describing a Bullish Engulfing Candlestick Pattern is it’s a bullish “reversal pattern” as in, “look out, it’s about to go the other way!” When we see a pattern like this, it’s a STRONG indicator that the bulls are about to take control of the market. This gives us a great heads up to trade accordingly.

Now of course you should always stick to your trading plan and utilize your trading method’s trade criteria before you jump into a trade. But seeing a pattern like this can be a very important confidence booster that the trade you’re about to make is going to go in the right direction.

The Bullish Engulfing Pattern is one of the strongest candlestick reversal patterns out there. It works great, and for your homework assignment this week, I’d like you take a look at some historical charts and see if you can identify any of these patterns. I’ll bet once you find one, you’ll see that most times, it worked very well and the market reversed very shortly after that.

Next week I’ll go over the opposite of this indicator (The Bearish Engulfing Pattern), but until then, Good Trading!

The Truth About Lot Sizes

In today’s article we are going to discuss the topic of lot size is in the Forex market.  Generally speaking lot sizes are divided up into standard lots, mini lots, micro lots and nano lots.  Different brokers may offer other types of lot sizes so make sure you check with your own broker to confirm the sizes you are trading.

A standard lot typically represents 100,000 units of the base currency being traded.  The base currency is the currency that is located in the first place of the currency pair.  So for the EUR/USD the base currency is the Euro, for the GPB/USD the base currency is the pound.  So if we were trading one standard lot of the EUR/USD we would be trading 100,000 euros.  If we were trading the USD/CHF we would be trading 100,000 U.S. dollars.  As we move down lot size is we move down by a factor of 10 the unit sizes we are trading.  So if we were trading a Mini lot we would be trading 10,000 units of the base currency.  If we were trading micro lots we would be trading 1000 units of the base currency and if we were trading nano lots we would be trading 100 units.

As we trade the smaller lot size is we decrease the amount we are both making and are risking in our trades.  For example, if we are trading the EUR/USD and are using standard lots we are trading a 100,000 units size which means for every one pip movement we either make or lose $10.00.  As we move to smaller lot sizes the amount that we make or lose will also drop by a factor of 10.  So if we trade a mini lot we make or lose $1.00 per pip, if we trade a micro lot we will make or lose 10¢ per pip and if we trade a nano lot we are making are losing one penny per pip.  So you can see that the smaller lot sizes we use the smaller amount we make but also the smaller potential loss we might take.

With our example above our pip value on a standard lot was valued at $10.00.  This is because the quote currency is the USD.  Each pair that has the USD in the second position will have this same  value.  If the quoted currency or the currency that is in the second position is something other than the USD then the pip dollar amount may be different.  Even though the pip amount is different the decrease by a factor of 10 still holds true.  Check with your broker to get the current value per pip of each currency pair your trading.

Finally, remember that one of the goals in trading Forex is to control our risk in every trade we take.  Understand that lot sizes are critical in keeping your risk under control.  As we identify the amount of risk we want to take in each trade and as we identify where are stops are placed we will be able to determine the correct lot sizes to use when entering into our trades.  It doesn’t matter if we use standard lots or nano lots or anything in between as long as we are following proper rules for managing our risk.  As you become more consistent with your trading your account size will grow and your lot size is will naturally increase with this.  Remember it’s a OK to start small in order to build your account size.  Take some time to review lot sizes and make sure you understand how your broker calculates them.

Which Way Is The Price Action Moving?

So today I would like to spend a few minutes discussing a topic of extreme importance when trading gold or silver.  Oftentimes we get so caught up with trying to find the perfect technical indicator that we end up ignoring the most important aspect of trading: Price action.  This most important aspect is the price action occurring on the actual charts.  If we can become proficient at reading the price action on a chart then our technical indicators become less necessary.

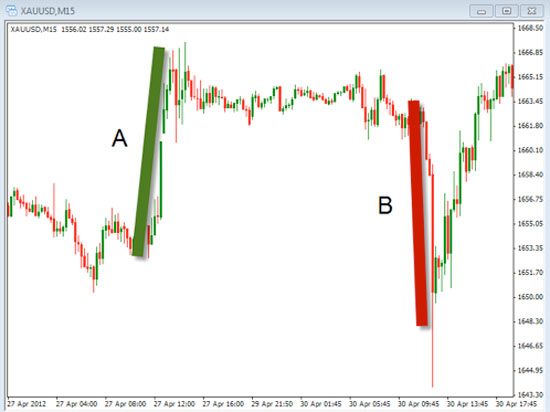
When we talk about price action we are referring to the movements that occur on a chart with the price.  These movements can be vertical movements or horizontal movements.  Vertical movements occur when the price is making a strong move to the upside or a strong move to the downside.  These vertical movements are what make up the trend of the chart.  Horizontal movements occur in times where the price looks like it’s moving sideways on the chart or in an area with out a trend.

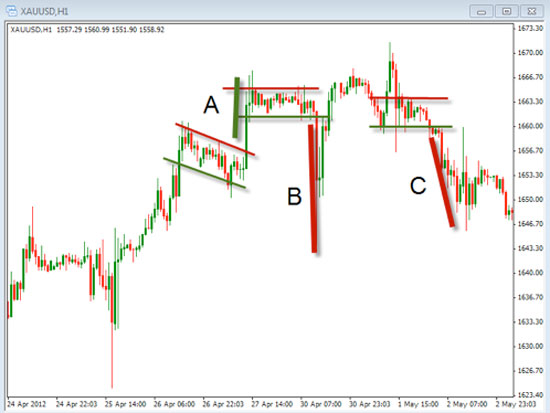
In the chart below we have identified areas where the price is making vertical price movements.  Notice we have identified an uptrend with the letter “A” and a downtrend with a letter “B”.  The reason why we want to identify vertical price movements is that these are the areas where we want to be either long or short gold.  If we are long gold and the price action becomes vertical to the upside we will profit from that movement.  If we are short gold and the price action becomes a vertical to the downside will profit from that movement.

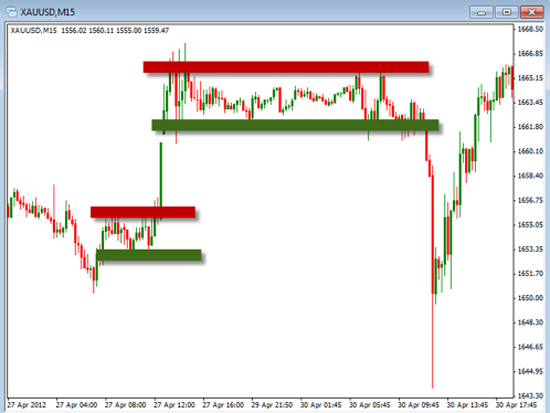
In the chart below we also identified areas of horizontal price movement as indicated by the sideways trend lines.  Oftentimes these areas of sideways price movement can be identified by drawing upper and lower horizontal trend lines.  It is during these sideways price movements we should begin to look for opportunity’s to go long or short as the price begins to show a directional vertical movement either to the upside or to the downside.  You can also see that sometimes these sideways moves are short and sometimes they are long.

In both the examples above we are using the 15 min. charts but the rules hold true for any time frame you are trading.


The key now is to be able to find and identify the areas when this vertical price movement is going to occur.  Generally, these vertical price movements occur after a period of a horizontal price movement or consolidation of the price in a sideways trend.  Notice in the chart below how the vertical uptrend “A” was preceded by a horizontal price movement and how the vertical downtrend “B” and “C” were also preceded by this sideways movement.  You will also want to recognize that the sideways price movements do not always move exactly horizontal.  Sometimes you will see them moving at a bit of angle as it did prior to letter “A” below.

Take some time to practice drawing these horizontal lines on your chart to identify these sideways movements.  Also look for the breakouts to occur as vertical movements to the upside or downside.  As you become better at identifying these areas you will see an improvement in where you should be both entering and exiting your trades.  Remember as we watch gold swing up and down we can look for these areas to help us know when the best time to trade will be.