Increase Your Winning Percentage With Your Current Method

A very common theme that I see among traders, especially Forex traders, is that many of them seem to believe that you need to hit a homerun on every trade.  I fully understand the need and the desire to hit the occasional homerun but every trade doesn’t have to be huge winner.  One thing that I have finally begun to appreciate in my own trading is consistency.  The big moves in the markets will come and we will be able to capture many of them but consistently making a steady profit is just as important and in many instances even more important.

When you take a position in a given market you have a 50/50 shot at success because whatever market it is will likely go up down.  It may go sideways for a time but that won’t last forever, the markets trend in one direction or the other roughly 70% of the time.  Picking a long or short position is of course a start but what if you can find something that occurs in the market somewhat regularly just before it goes up or down.  This is similar to what gamblers call a “tell” which is something a gambler will do consistently when they are bluffing or possibly when they have a good hand.  The point is can we detect something that occurs regularly just before a market moves, does the market have a “tell”?

Interestingly enough the answer to this question of course is yes the only question becomes how accurate is it.  It will certainly need to be better than 50/50 but we really can’t make much money at or near 50/50 unless our wins were larger than our losses. This is possible though it is very unlikely to be consistent.  What if we can detect moves in the market with an accuracy of 60/40 or 70/30 or better.  Now we may be getting somewhere but it is still very common to see traders with a pretty good method that has a decent winning percentage but they still break even or lose money.  This is where the part about trying to hit too many homeruns comes into play which in a way may also be looked at as greed to an extent.

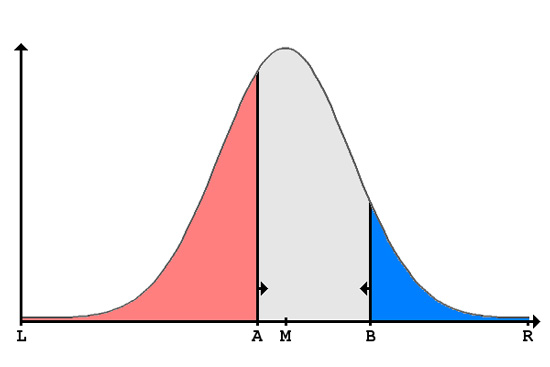
We cannot control the markets, though it would be nice if we could, nor can we necessarily expect regular big moves that our methods detect.  If we have a method that we determine is 65% accurate with a return of 80 pips in the Forex market or 15% in the stock market, which isn’t too bad, what happens if we reduce our profit objective on each trade.  In looking at a good sized population of trades that we make based on our method list the trades in order from highest to lowest by the amount that the trade went in the money before reaching our protective stop.  It is entirely likely that many of the losing trades were in the money before the market turned around and stopped them out which will be very important to know.  Next to this list starting at the bottom of the list make different levels in 10% increments showing the percentage of trades that went in the money by at least that level.  The highest percentage of wins level, the 100% section, will show the lowest return but it will show at what level you can always win at.  After we do this all we need to do is to go down the list to determine what percentage of trades made it to an acceptable level meaning that if we reduce our profit target by X% the accuracy of our method increases by X%.

If we can reduce our profit target to a still acceptable level while increasing our winning percentage we will begin to trade with much more accuracy and much more confidence.  How would it be to place a trade order and enter into a position knowing that we will win 85% of the time or greater?  As long as we are able to keep our risk/reward ratio in check we almost have to trade consistently profitably.

We can also go through this same exercise the other way looking at how far out of the money our trades go before they win which will tell us on average how far our initial stops need to be away from our entry points.   We may determine that we are able to keep our stops allot tighter than we thought while not giving up that many trades.  There will be trades that just don’t work out and are losers from the beginning which are the ones we want to end as quickly as possible, this exercise may make it easier to see those early on allowing us to exit as soon as possible minimizing the damage to our accounts.

What’s Up With The Average True Range (ATR)?

The ATR or Average True Range is a technical indicator used by many traders to help identify the range or volatility that is present in the market.  In relationship to the Forex market it can help us identify the volatility of the currency pairs we are trading.  This indicator was originally created by J. Welles Wilder, Jr. and is calculated with the following formula:


true range = max((high-low), abs(high-prev.close), abs(low-prev.close))

So what does that mean?  Well luckily we don’t have to calculate this, we just need to basically know what it means.  Another way to look at the True range is this:


The True Range is the greatest of the following 3 numbers:

  1. The difference between the current maximum and minimum or the high and low
  2. The difference between the previous closing price and the current maximum price
  3. The difference between the previous closing price and the current minimum price

The ATR indicator is a moving average of these values.

So now the we are totally confused on how it is calculated, let’s take a look at what is important with this indicator.


There are a couple of things we can identify when looking at the ATR.  One thing the ATR can help us see when looking at the charts is whether or not the currency pair is becoming more or less volatile.  Notice in the chart below that you can see how the ATR is oscillating up and down as the volatility or range of the pair goes up and down.

Metals This Week

Today we are going to look at both gold and silver and see what they have done this past week.  In doing so we will see if we can get an idea of the direction that they maybe going in this upcoming week.  When we evaluate a chart we are looking to identify several things.  The first thing we want to evaluate is the trend that is occurring on the longer term charts, the second thing is going to be to evaluate the support and resistance levels.  Once we have done this we can get a fairly good idea for what is happening with them.  Let’s begin by looking at the Trend of both gold and silver.  In the charts below we can see what is happening with their trends.


The one of the left is the chart for Silver while the one on the right is for gold.  On this chart the 40 period SMA is on to help give us an idea of the direction things have been moving and where they may be going.  A simple way to help define the trend is to look at the direction it is moving to show if it has been bullish or bearish.  Notice that both of these charts have the Moving Average pointing up and the price is currently above the line.  This would suggest that the movement wants to move up.  If the trend is moving up that is the time we want to consider buying.  If it is going down we want to consider selling.  We need to be careful with just saying that we will buy if it is up and sell if it is down.  In the current chart we can see some bullish direction with the trend but we would still need to have our rules tell us when to enter into a trade.


Now let’s look at the charts below to determine where there may be some areas of support and resistance.  In these charts the red line represents areas of resistance and the green line represents areas of support.  The idea is to look at buying when we are near support and selling when we are near resistance.  Currently with these charts  we can see that the price is sitting near the resistance area and may not be at the ideas location to be buying.


So when we combine these two thing we get an idea of when to look to buy and sell.  What we would like to see is the moving average moving higher while the price is moving up off of the support area to buy and when the moving average is going down we want the price to be coming down off of resistance to sell.  In the current situation we have the moving average going up but we are sitting near resistance.  This does not put us in the best situation to be looking to buy.  The most likely entry for the  current charts are to look for a break back up above the resistance levels to confirm a bullish breakout.


Bearish Divergence: Are the Bears ready to roar?

One of the best ways to determine a possible change in market direction is to look for Divergence.  What is Divergence?  The textbook definition of Divergence is as follows:  In technical analysis, divergence is considered either positive or negative, both of which are possible signals of major shifts in the direction of the price. Positive or bullish divergence, as it is commonly referred to, occurs when the price of a security makes a new low while the indicator starts to climb upward setting new highs. Negative divergence, commonly referred to as bearish divergence happens when the price of the security makes new highs, but the indicator fails to do the same and instead closes lower than the previous high.  Using divergence, traders can make transaction decisions when divergence is observed, where the price of a stock and a set of relevant indicators, such as the Stochastics, Relative Strength Index (RSI) for example, are moving in opposite directions.

Notice in the chart below, the technical indicator is making lower highs at the same time the price action is setting higher highs.  This is considered negative or Bearish divergence, which could be used to indicate a possible move lower, which actually did occur.


If we look to the current markets, Note the chart below of the SP-500 over the last few month has had some volatile swings but has been in a clearly upward moving channel, setting higher highs and higher lows.  At the same time notice the Stochastics Indicator has been setting lower highs setting up Bearish divergence.


This setup is generally a strong indication of a possible counter trend move or correction to the downside. With the markets nothing is guaranteed of course, but is looks like the potential upside to this market is less as we are keep bouncing off of the resistance level.   This indicates that the bulls may be weakening and the bears may be ready to take over the market.

Using Stops

In today’s article I want to spend a few minute talking about stop losses and why they are so important.  Stop losses are simply exit points where you would close out your trade when it moves to a specific level.  The idea of a stop loss is sound and is something that every trader should be using.  The problem that many traders run into is knowing where they should place their stop loss.  If the stop loss is too close you may get stopped out earlier than what you may want and if it is too far away you are potentially risking too much.  So the question should be, “Where is the appropriate level to place my stop loss?”


As you try to identify this ideal placement you will need to take into consideration several things.  The first thing to consider is how to use the trend in placing the stop and the second is how do you use the support and resistance to place the stop.  The trend of the currency pair will give us the direction it will be placed.  If the trend is up, we will place the stop below the price and if the trend is down we will be placing the stop above the price.  This should be obvious but take a look at the picture below.


The other way to look at this is that if we are buying the pair in an up trend, we are going to place our stop loss below the price.  If we are selling in a down trend, we are placing our stop above the price.


Once we know where we are looking to place the stop loss we will then want to determine the exact level it should be placed at.  There are several things we can look at to help us in figuring this out.  One is to look at past levels of support and resistance.  If we are trading by buying a pair in an up trend, we would simply look for the area that has most recently acted as support.  If it is in a down trend and we are selling we would look for the most recent area of resistance.  Then we would place the stops a few pips beyond those areas.  In the chart below you can see an example for placing a stop in an up trending pair just below the past support area.


In this example notice that the stop loss was placed just below the prior area that acted as support.  Because this can be a bit subjective and many traders may look at support differently you may have placed it at a different level, but the key is that we are placing in an area the would definitely be moving against why we initially entered the trade.  So the goal is to place it at that level where the initial trade setup is no longer valid.  No too close and not too far away.


One thing you can do in your demo account is to set up several practice trades on the same setup but using different stop loss points to help you see where it might be too close or too far way.  In the end you will want to use stop losses in every trade you do.  The better you can become at placing them the more confident you will become with your trades.


Quantitative Easing (QE) – Do We Really Care?

What is all the fuss around Quantitative Easing and how does it really affect the individual investor?  If there is any form of Quantitative Easing in our economic future the affect it will have on individual investors is far more likely to be indirect rather than direct.  Quantitative Easing will come in the form of the US government getting money into the hands of large banking and financial institutions which is supposed to make money available for small businesses through loans easing credit and producing cash that will flow throughout our economy.  The big question is will the easing actually result in more loans and more money flowing throughout the economy, the likeliest answer is that it probably will not, at least not anytime soon.  There are allot of reasons that I say this but in looking at recent economic data it is a little obvious what is going on.

Unemployment is believed to be somewhat stabilized though not going down, personal income is up and  consumer spending is down with the interesting exception of auto sales.  This translates into an economic stalemate.  If the banks do receive more money somehow through Quantitative Easing to loan to small businesses, the small businesses are not likely to ask for it until their sales increase which won’t happen until consumers begin to spend more money which probably won’t happen until unemployment begins to drop which won’t happen until businesses begin to hire more people which won’t happen until their sales increase which of course won’t happen until consumers begin to spend more money.

This is clearly just a big circle with nothing really happening until something, anything breaks loose economically giving us a clear indication one way or the other of what is likely to happen going forward.  Factoring in the European issues is another mess that will muddy things up even more but regardless of all of this the question still remains; how does Quantitative Easing affect the individual investor?

My thought process is that it won’t, at least not directly.  Based on recent past history with banks getting huge chunks of government money to lend we know that they actually have to want to lend it before any loans can be made.  Now we see that businesses actually have to want to borrow it which may not be the case right now based on their lower sales due to the lack of consumer spending and where we are economically.  However, the way that the individual will be impacted in the future and has already been impacted in the very recent past by the latest potential round of Quantitative Easing is almost entirely emotional.  When there is talk of potential easing the stock market rises making traders and investors feel good for a few days but then when we see signs that easing may not occur the stock market drops erasing those gains making those same traders and investors feel that the recovery has stalled at best.  Traders and investors are a very emotional bunch which is partially why we see the gyrations in the market from day to day with the good news bad news scenario.

One way to combat this is to take a very defensive stance and stay in cash unless there is a reason to enter the market.  Entering the market with a long term horizon at this point may not be the best strategy but entering near or as close the bottom of one of the drop offs as possible and holding for a quick smaller gain is certainly possible.  In looking at a chart of the S&P 500 one can see that those highs and lows really do exits and they are tradable.  There is absolutely nothing wrong with being in cash a good amount of the time because when people get emotional there is no telling what they are likely to do so when the market is largely riding a wave of emotion if there is an opportunity to benefit from it take advantage and if no opportunity exits there is no reason to risk anything, stay in cash.

I made an earlier comment about auto sales still being strong which seemed somewhat odd.  It seemed allot less odd to me after I read an article yesterday that stated that GM has more than doubled the amount of cars they are selling that are financed through sub-prime loans.  Remember the financial crisis that began to be recognized in the 3rd quarter of 2008, there was allot of culpability but one of the main reasons for it was sub-prime debt in the mortgage industry but also in the consumer lending market.  Maybe we really are getting smarter fiscally as a nation, the lack of consumer spending may be an indication that even the average person without a finance degree or a ridiculously high paying job with bonuses that most people could retire off of know that going back to sub-prime lending may not be the path we want to take again.

Nonfarm Payroll Report… how does it affect trading?

Jobs, Jobs, Jobs:

For you new traders out there, this is Nonfarm Payroll week.  While this does not sound as good as, say… National Ice Cream Week (if there is such a week,) the employment numbers can give the market an idea of the relative strength of the US Labor Market. The NFP report, as it is commonly referred too, is generally released on the first Friday of each month.  I thought we would cover the ins and outs of the payroll report.

What is nonfarm payroll employment? Nonfarm payroll employment is an influential statisticreleased monthly by the United States Department of Labor as part of a comprehensive report on the state of the labor market.  It is a report that covers the employment numbers for goods-producing, construction and manufacturing companies for the previous month. Typically, the Bureau of Labor Statistics releases the report at 8:30 a.m. Eastern Time on the first Friday of each month and covers the numbers for the previous month. The U.S. Nonfarm payroll number is an important factor which can affect the U.S. dollar, the Foreign exchange market, the bond market, and the stock market.

The data released also includes the change in nonfarm payrolls (NFP), as compared to the previous month. The NFP number is meant to represent the number of jobs added or lost in the economy over the last month, not including jobs relating to the farming industry.

In general, increases in employment means both that businesses are hiring which means they are growing and that those newly employed people have money to spend on goods and services, further fueling growth. The opposite of this is true for decreases in employment.

While the overall number of jobs added or lost in the economy is obviously an important indicator of what the current economic situation is, the report also includes several other pieces of data that can move financial markets:

1. The unemployment rate. The unemployment rate in the economy is reported as a percentage of the overall workforce. This is an important part of the report as the amount of people out of work is a good indication of the overall health of the economy, and this is a critical number that is used by the Fed when determining any action that might be needed in the economy.

2. Which sectors the increase or decrease in jobs came from. This can give traders a heads up on which sectors of the economy may be primed for growth as companies in those sectors such as housing add jobs.

3. Average hourly earnings. This is an important component to know, because if the same number of people are employed but are earning more or less money for that work, this has basically the same effect as if people had been added or subtracted from the labor force.

4. Revisions of previous month’s data. An important component of the report which can move markets as traders re-price growth expectations based on the revision to the previous number.

Overall, this is one of the most watched economic indicators, because employment drives every aspect of the economy.  If the NFP comes out better or worse than expected, the markets can really react, (many times overreacting and settling down close to where they started.) So check out the release of the NFP report this coming Friday morning a 8:30 am eastern and see how it effects the market.