If Everyone Places The Same Stock Trade, Does It Matter?

I got a question today from one of my students that I’ve been mentoring, and it was probably the 100th time I’ve been asked this, so I figured, why not put it up here on our blog since it appears to be a pretty common inquiry.

So his question was: “I’m using a Profits Run Online Stock Trading System. Now when the trade alert software sends me a signal, I place my order and I’m done. It’s one of the things I love about this system, but aren’t all of your other students making that exact same trade at the exact same time? Won’t this shift the market and ruin some of our profit opportunity?”

My answer is: NO. As much as we think that we can move markets with our trades, we simply can not.

Why not? Well, the market is just to enormous for us regular traders to make a difference. Heck, it’s difficult for multi-national, multi-billion dollar companies to even make a dent. The stock markets are just too vast!

Just read this stat (and notice, this number is form 2008… it’s gotten much bigger since then) the average daily volume on the NYSE is $153 Billion, with a B. And that’s a DAILY number. And just the New York Stock Exchange. When you look at it globally, your minuscule foot print becomes microscopic!

So long story short, as important as we think we are, we simply are not able to change the market incomes with our trades, even if there are thousands of others using the same methods as you.  At the end of the day, this is a non-issue that you simply don’t have to worry about.

How Do We Use The ADX To Trade ETFs?

The ADX indicator stands for Average Directional Index and it measures the strength of a trend and can be useful to determine if a trend is strong or weak.  If there are high numbers it indicates a stronger trend and low numbers indicate a weaker trend.

When this indicator is showing a lower number, the trend is weaker and a range or channel is likely to develop. Since we are always looking for good trends to trade, it is best to avoid trading stock, ETF’s or Forex Pairs with low ADX numbers.  You would rather look for investments that have higher readings thus indicating a stronger trend.

Some charting packages may have two other lines on the chart, +DI and -DI (the DI part stands for Directional Indicator). I don’t pay any attention to these additional lines, when determining the strength of a trend, for this purpose we are only concerned with the main ADX number.

It should be noted that the ADX indicator measures the strength of a trend not the direction of the trend either bullish or bearish. Therefore, a high ADX number could indicate either a strong uptrend or a strong downtrend. It does not tell you if the trend is up or down, it just indicates to you how strong the current trend is.

How to interpret the ADX Scale:

If the ADX indicator is between 0 and 25 then the stock is generally in a trading range. It is likely just chopping around sideways.

Once the ADX indicator gets above 25 then you will often to see the beginning of a good trend. Big moves tend to start at about 25.

When the ADX indicator gets above 30 then you have at a stock that is in a strong trend (up or down).

It is not often you see stocks with the ADX above 50. If it does get that high, you start to see the trend coming to an end and trading ranges developing (see the chart of AAPL below). If you have lower numbers, you have a trading range or the beginning of a trend.

In the Apple chart above, notice the ADX indicator is the red line at the bottom of the chart. Notice when the ADX is showing a low reading the price is moving more in a sideways channel. Notice what happens when the indicator gets into higher territory at the left (about 50) Apple is in a very strong up trend. On the right side of the chart the ADX is also higher and a strong trend to the downside is underway. These are the trends that are the best to trade!

So how do most traders use the ADX indicator? Traders often will look for ADX values of 25 or greater to help determine a strong trend for trading. The ADX indicator is not used to give buy or sell signals. Therefore, it is generally used along with other indicators for entry and exit signals. It does, however, give you great perspective on the trend of a stock, ETF or Forex Pair.

What Does The Obama Win Mean To Online Traders?

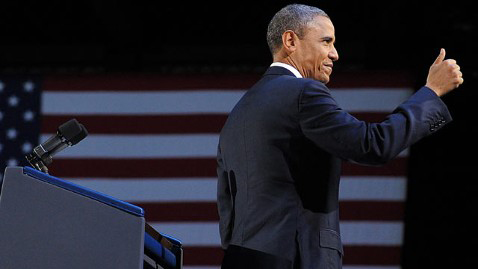
The election is over and Obama has won a second term. So what does that mean for us traders? Or for that matter, what does that mean for investors in general? For me the financial chaos in the world continues to get worse, principally because there’s no political will, whether in the United States or in Europe to control the exploding debt load. Of course we’ve seen the consequences in Greece when they’ve attempted to cut back on entitlements causing riots, looters in the street, general panic. Why? Because the Greek government is being pressure to curtail entitlements and get their budget deficit under control. This is very politically unpopular. Once you give people something and then try to take it away, they’re going to be very unhappy. In the United States we have the same situation. As a percentage of GDP our total debt is about 100 percent, 16 trillion dollars. That’s about a little less than the situation in Greece. The only big difference here is we have a printing press called the Federal Reserve. They can print dollars whereas the government in Greece cannot print Euros.

So what does all that mean? It means that the debt will continue to spiral out of control, running deficits of over a trillion dollars a year. Obama has shown zero inclination to do anything about that. He’s shown zero leadership to do anything about it. Of course he’s not alone. He’s got many politicians in the Congress who have no inclination to do anything about it. So this is going to continue to put a big drag on the economy. It’s not unlikely that we will have another recession, even though I believe we’ve never really exited the last recession. Interest rates will continue to be manipulated to zero or very low levels by the Federal Reserve. Hope against hope that somehow the economy will restart itself and grow us out of this mess. That’s just a pipe dream; it’s not going to happen.

Once interest rates do increase, because the Fed won’t be able to hold them down forever because the market won’t put up with it; the market will not perpetually buy U.S. Government debt forever at these very, very low rates. So when the market rejects the U.S. debt at these low rates, rates will rise regardless of what the Fed tries to do. When that happens, if we aren’t already in a second recession we will be then.

Now, for investors that’s a pretty gloomy outlook. For investors in this environment there are not a lot of good choices. When I’m talking about an investor, I’m talking about somebody who buys and holds, has a diversified portfolio and hopes that the diversification will protect them from the vagaries of the marketplace. Stocks go down, bonds go up and they’re safeguarded. In this environment that absolutely offers no protection. And so what are left to do? My view is if you’re not already a trader, a short term swing trader, you better learn how to become one real quick, because you’ll need to do so at a minimum to protect yourself. These markets are unforecastable. We don’t know when the dollar is going to collapse. We don’t know when the bond market is going to collapse. We don’t know when the stock market is going to collapse. But as a short term trader, you don’t care. You’re not invested for the long term. What you’re doing is you are going with where the market wants to go in the short term. So that protects you on the one hand. On the other hand, it allows you the opportunity and the potential to rack up some very impressive profits.

So you go from one extreme to the other. You go from desperation as an investor, scared, worried, what’s going to happen tomorrow, I don’t know, how’s this going to impact my 401k? You go from that to, hey look, I’m going to go with wherever the market wants to go and I’m going to take advantage of the profit potential that short term trading, swing trading, has to offer.  So this is a new world, this is going to be this way for a long time. So don’t think it’s going to get better here in another year or two because it isn’t.

These are very serious structural problems that are going to take a long time to work through. So we can thrive in the meantime. We don’t have to be worried, don’t have to be concerned. We can thrive. How do you do that? You need a good trading method, or good trading advice. Then you can successfully take advantage of the short term swings of the market up or down while protecting your capital from risk all the while.

So the bottom line for me is be not the investor, be the trader, be the short term trader. And you’ll be very, very happy and you’ll be able to sleep at night. And you will go from borderline panic and fear to absolute control over your financial future.

What Is The PSAR (Parabolic Stop-And-Reversal) Indicator?

Today we are going to discuss the indicator called PSAR.  The PSAR or Parabolic Stop-and-reversal indicator is a technical strategy that uses trailing stops and reversal methods.  This indicator is used to help determine areas where traders can enter and exit positions.  This method was developed by J. Wells Wilder who also developed the RSI indicator and is a simple way to identify entry points.  If the price is above the PSAR you would want to be long and if the price is below the PSAR you would want to be short.  Entry and exits occur as the PSAR changes from above to below the price or from below to above the price.  This indicator is a bit unique in that it does not use lines but rather a series of arrows or dots to indicate when the momentum is moving up or down. In the chart below you can see the PSAR as shown on an hourly chart of the EURUSD.

Notice that when the price moves down that the dots move above the price indicating a shorting opportunity and when the dot moves below the price it is buying opportunity.  This is a simple way to know if the momentum is beginning to move down or move up.  As the PSAR changes one would look to enter the trade to take advantage of this momentum shift or reversal.  Because this work well when the market is trending you would want to be careful in a sideways market where the indicator seems to produce more choppy signals and whip saw in price.

In order to avoid this you could consider adding a trending type of indicator such as a Simple Moving Average.  If you place something like a 40 period Simple Moving Average you would look to only take trades in the direction of this trend.  Take a look at the chart below to see how adding this SMA to the PSAR can help in eliminating some of the choppiness.


When the 40 SMA is going down you would skip taking the long trades as the PSAR dots move below the price.  By avoiding these counter trend entries you will miss taking some of the unprofitable trades.

This indicator is a popular was to look for entering and exiting trades.  Remember that there is no perfect indicator and that nothing works all the time but using a simple indicator like this can help clarify when entries may be happening.  Also, this indicator can be used on any time frame and can help to identify where you may place your initial and trailing stops.  Once you enter into the trade you would place your stop loss above or below the new dot.  Take a look at the chart below to illustrate what this might look like.

Once you enter into a long position as shown above you would place your stop below the new dot.  You could also adjust your stop below the next dots as they begin to move higher.  Your exit might occur when you get you reversal dot to short.

Take some time to practice with this to make sure you can see how this indicator works.


Keep Online ETF Trading Simple

I really want to talk to you today about something that is easy to forget and something that many people who make a living online ETF trading get wrong.  That thing is making trading complicated.  The more complicated we make trading the more difficult it becomes.  Trading is hard enough without doing things to make it even more difficult.  Knowing how to keep it simple is an important part of any trading plan.  Here is an example of how many trader complicate things.

A new trader begins trading Gold.  They figure that using a technical indicator is a way to help them become more profitable.  As they look at the chart with their one indicator on it the start to thing that if one is good then two is even better.  The next thing they find themselves with 5 or 10 different indicators on their charts and the discover that by complicating the chart they have just make things much more difficult.

So, what do we need to do?  Well, the first thing is learn to read the charts without any indicators on them.  If you can determine the trend, support and resistance and over bought or over sold area without any indicators, you will become even better by adding a “few” simple indicators that may help you visualize your trade setups.  What is interesting is that many traders, once they learn to read charts without indicators, they feel that they do not need any other indicators except price.

Keeping it simple sounds easy but many traders have difficulty with this concept.  One other way that traders make things more difficult is that they cannot help themselves but to go and keep looking for the next “best” thing.  This can make things very complicated as we are always searching for but never finding the success we want.  One way to help with this is to determine the method you are going to use and stick with it.  Live, eat and sleep that method.  Make it become part of you.  Know the ins and outs of the method so when you are actually trading it you can do it quickly and simply.  If you were a basketball team this would be your go to play.  The one that you practice over and over again so when you were in the game you could execute it effectively.

In the end, if you try to over do your charts or if you are trying too many different strategies you will make your trading life very difficult.  Work on simplifying your life.  Work on becoming the best trader you can without all the excess that many traders use.  This will not only make you a better trader but you will enjoy your trading much more and will stick with it a lot longer.  So, take some time this weekend to see if you can eliminated both unnecessary indicators on your charts as well as those strategies that you are “semi” using and begin to focus on the important and simple things in trading.

Stock Traders Show Their Emotions

My personal opinion is that people who base their income on online stock trading show their emotions far too often when making trading decisions.  Trade decisions are merely business decisions, nothing more and nothing less, and my personal experience tells me that when emotions get involved in business decisions typically it’s not a good thing.   The 2012 elections were a prime example of this.  The elections were Tuesday, the results were known Tuesday evening and the stock market dropped like a rock on Wednesday.  The thing about this that interested me is “Why did the stock market drop”?

There were news reports that stated previous to the elections that if the Republican candidate won the presidential election the stock market would likely rise but if the Democratic candidate won the stock market would likely fall, “Why”?  There were literally billions of dollars reportedly spent on the 2012 elections, I heard a report of over six billion dollars, and basically nothing changed.  The same President remains in the White House and the Congress is still split in roughly the same way.  The Congress that we have had over the past few years has proven to be completely inept when it comes to doing their jobs but the citizens of the US are clearly ok with that and left Congress basically intact.  We know what kind of performance we have gotten from them in the past and there is no reason to believe that their performance will change in the future.  The results of the congressional elections were largely exactly what was expected, there were few surprises and the overall result is that nothing has changed.

What we didn’t know for sure is who would end up being the President for the next four years because it was a very close race, this of course is very important however it is very likely that it didn’t matter in the respect that Congress is still split made up of basically the same group of employees so in reality regardless of how much a President may want to work with them there are still likely to be the same roadblocks that were there before.  Again there is nothing to make us think that Congress will actually begin to do the jobs that they were hired for based on past experience.

The stock market fell off sharply the day after the election and the USD weakened late in the evening on Tuesday against other major currencies about the same time that it appeared from a mathematical standpoint who was likely to win most of the elections.  These were both largely emotionally based knee jerk responses by online stock and ETF traders to something that really was no different than it was the day before.  We should all be very clear on how poorly Congress had performed in the recent past so it seems that we should have gotten a big reaction if there were major changes with the hope that they would actually do their jobs.  Very few members of arguably one of the most unsuccessful Congresses that we have ever had in our history lost their jobs, maybe the emotional reaction in this case was the reality setting in of the future stalemates that are likely to occur.  The vast majority were hired back for another term, what incentive do they have to do anything different than what they have done in the past?  Seemingly all they have to do is sit back and collect their inflated salaries and the benefits that the average American can only dream of having while waiting for their incredible pensions when they eventually decide that they want to leave their positions.  In thinking about what we have already given them and what we will continue to give some of them for the rest of their lives versus what we have gotten in return I think I am about to have an emotional reaction right now.


The 3 “R’s” Of Online Stock Trading (Final Installment)

Today, I would like to continue with the third part of the Three R’s of “Real” Online Stock Trading Success.  To review, the first “R” is finding a trading Routine that is both productive and practical and then consistently implemented.  This needs to be a Routine that you can implement and maintain over the long term. The second “R” we discussed was to follow a set of RULES that are well defined, including clear trade set-ups, entries, and exits.

The third “R” of trading success is “Risk Management.”  You can have a consistent routine and a great set of rules, including specific entries, and exits, but if we are not using sound risk management we may be risking too much of our account at any one time we are putting our stock trading success in jeopardy.

The first thing to understand about managing risk is that we should never get into a situation where we are risking our account on just a couple of trades.  Instead, we should follow the 1% (2% maximum) rule or, in other words, only risking 1% of our account on any one specific trade, also limiting the total number of trades to a maximum of 10, or 10% total risk at any one time. To do this it is important to use proper stop loss and trailing stop orders when we get into trades, we will be able to sleep at night a whole lot better knowing that we will never be in a “bet the farm” type of position.

Before ever entering a trade we should determine what that risk per trade is in dollars.  If we have a 10k account we can then risk up to $100 per trade. (10k account balance X 1%)  This will help us to determine the position size or the total number of shares to trade or the position size based on the $100 maximum risk.  The way to calculate the position size is to calculate the risk per share. To determine the risk per share we calculate the difference between the entry price and the initial stop loss level.  For example, if our entry price is $25 per share and our initial stop loss is set at $24 (I believe that a stop loss level based on support or resistance is better than a predetermined set stop loss level.) based on this example the risk per share would be $1 per share so we would trade 100 shares and limit our risk to a maximum 1% for this trade.  This will help us limit our risk and not accept more risk than is prudent per trade.

So to review, the keys to limiting our risk are to always determine the max risk we are willing to take per trade based on 1% (2% max) always use a stop loss to determine proper position size of the trade, and then be sure to limit the number of trades to keep out total risk under 10%.

These 3 “R”s of trading success we have been discussing are not difficult to understand, but are very important to trading successfully in the long-run.  First, establishing a manageable and consistent trading Routine second, follow our system Rules and third, keeping strict Risk Management to give us the best chance to succeed in the online stock trading. 


Trade Stocks Like It’s A Business

Hi everybody, Bill Poulos here and I want to bring up something that I go over with my students on an almost daily basis.  So many traders go into trading stocks or ETFs for all the wrong reasons. Yes, we all trade to make money. But too many people look at it as a way to get rich quick. To make money always and never have a loss. They want a “sure thing” and they fully expect to never lose a trade. This is NOT the way to think of trading. Again, we are all in it to make money, and when done right, with the correct attitude, you can do very well for yourself. BUT, you have to have the right kind of mentality.

Stop looking for the holy grail. Stop fretting when you lose a trade… and START treating your trading as a business.

This is important: Treat trading like a Business.

So far starters, stop looking for the holy grail of trading systems. They don’t exist. Just like a business owner knows that one product doesn’t make him rich. He has to have several products. Good products. Products that produce results, and you need to think of your trading the same way. Don’t search for that one perfect trading system. Find several good trading systems that give you consistent, reliable results. Look for systems and methods that deliver more winning trades than loosing trades. Loosing trades happen. It’s just a fact of life. The key here is to find a system that minimizes the losses on those losing trades, and maximizes the profits you get form your winners. That is the recipe for smooth consistent growth. That’s the goal here.

Next, check your emotions at the door. CEO who are good at what they do act logically, methodically, yet are adaptable. Try to be the same. Don’t be upset if you get a losing trade. Don’t get upset if you lose several trades in a row. This happens and the trader that acts like a CEO will not be thrown off by this. That trader will stick to their trading plan, follow their methods and not deviate. They’ll reap the resultes of  a growing trading account because of this disciplin.

Lastly, any good company knows to stay on the cutting edge of technology, and you as a trader should too. Once you find something that works, go ahead and stick with it, but you need to keep your eyes and ears open. I’ve been in this business a long time and I still see on a regular basis new ways of doing things. You see the markets we’re trading are always changing and we need to always be changing too.

So, your trading is a business. It’s not a hobby. It’s not gambling. Be realistic. Leave your emotions at the door. Always stay on the cutting edge… and then watch your accounts grow.


Learn Risk Control When Trading Stocks, ETFs or Forex

Today we are going to talk a little about the topic of risk.  Risk in the financial and especially the forex world is very important to analyze.  In the end if we do not have control over our risk we run the risk of loosing everything.  Controlling our risk should be a top priority when it comes to our trading.  Knowing what risk is and what limits to place on it will ultimately keep us in the trading world.

Risk comes in various forms.  We have general market risk, we have risk of news, we even have the risk of doing something not very smart.  Regardless of the risk we need to look at how we control this risk the same.  So regardless of where the risk is coming from we need to protect ourselves from it.  Because of this there are some basic and fundamental concepts we need to understand.


Trade Risk –

Trade risk is the amount of our overall account value that we are willing to risk in any one given trade.  This is where we need to know how comfortable we are with loosing money.  If we are not very comfortable with loosing money we need to be very cautious in the amount we are willing to risk.  If we are ok with loosing money then we may decide to risk more.  The general rule of thumb is to never risk more than 2% of you account in any one trade.  This is a maximum amount which means you should not risk more than but can risk less than 2%.  If I am just learning, then I may decide on risking only 0.5 – 1.0% of my account and that is ok.

So, let’s take an example of how this works.  If my trading capital is $10,000 and I have decided to only risk 1% of my account I would calculate the dollar amount of risk by taking my trading capital of $10,000 and multiplying it by 1%.  This would equal $100 which would mean that I could place at risk that amount in each trade I take.  I would then use this number to determine the position size I am going to take in a single trade.

Now, if my trade gets stopped out I have lost 1% of my account and I move on to the next trade.  If I feel that is too much I can always lower the amount I am willing to risk in each trade.


Portfolio Risk –

Portfolio risk is the total you are risking in all of the trades that you currently have opened.  This should also represent the most you are willing to loose, not on a single trade but on your whole portfolio if all trade were stopped out.  This total risk also depend upon how conservative or aggressive you want to be in your trading but a good rule of thumb is to keep it to a maximum of 20%, with many trader preferring to stay below 10%.  This would mean that if all of your trades got stopped out you would only loose 10-20% of your portfolio.

In the end, your risk control is critical to your overall success.  Take some time to review what you are doing so you have confidence you are doing it correctly.

Non-Farm Payroll (NFP) and Gold Trading

Today I would like to discuss a bit about the monthly report called the Non-Farm Payroll.  This is a report that is released on the first Friday of each month.  Today was the day for the November release.  As part of this release we also get the monthly unemployment rate.  This NFP number calculates the change in the number of people employed for the prior month, excluding those in the farming industry.  The unemployment rate is the percentage of the total work force that is unemployed and actively seeking employment for the past month.  These numbers are important for various reasons including the fact that the economy needs good job numbers to be growing strong.  It is also important in the fact that it can move the market dramatically.

As we look at the chart below you can see what happened just prior to the release.  Overall Gold has been staying around the low 1700 levels for a while but holding just above it.  This sideways movements can be typical of the movements you will encounter just prior to major news announcements.  When looking to trade prior to the announcement you can place stop orders to buy or sell as the price begins to move.  You can see where we could have placed these two orders.


 In a situation like this you can see where you would buy and where you would sell on a move up or down.  If it moves above the buy stop you would enter a long position and if it moves below the sell stop you would enter a short position.

Now in the chart below we see what happened after the announcement was made.  You can see that the sell order would have been filled pretty quickly.

Once the sell stop was filled you would continue to manage the trade in order to take profits on the short term.  This is typically a quick trade because things seem to reverse quickly on a trade that drops fast.  If it does reverse we want to get out quickly.

The goal of trading the news like this is to get in quickly and out quickly.  We need to make sure we are prepared to exit if things turn against us.  Ultimately the goal is to keep our risk down and make profits on the short term.  If you trade news like this you need to make sure you don’t get too emotional since your emotions can cause you to make poor decisions.

In the end, today we saw a nice move in Gold as the NFP number was released.  The long term effect of this is unknown at this time but on the short term there are trading opportunities to take advantage of.  Knowing when the announcements come out is sometimes more important than the long term effect.  Make sure you keep these types of major announcements on your calendar to make sure you are not caught in a negative move.