The State Of The Union

Well this week we heard from the President in the State Of The Union message. We also heard the rebuttal from Marco Rubio on behalf of the Republicans. No matter which side of the aisle you’re on, in my opinion, you heard nothing new. The President continues to support big government, believing in big government solutions to our economic problems. Marco Rubio on behalf of the Republicans continues to support free enterprise and limited government. Neither one supported their statements with data.

The political scene these days is all about feelings. President Obama, delivered a very fine speech (in terms of style) as he always does, but it’s full of feelings and no data. A lot of those feelings feel good. It sounds inspiring; it sounds like what he’s proposing is going to help the economy. On the other hand, Marco Rubio in his rebuttal was also appealing to the feelings of immigrants, harkening back to the days when immigrants would come to this country, make a life for themselves without government support and do just fine, graduating from the underclass so to speak to the middle class, which was an amazing accomplishment. That still happens today with many, many immigrants. They are not afraid to work and do well in spite of the economic headwinds.

But neither side can present a compelling case for their argument supported by data. I should say neither side will provide such data. It’s a shame because if you look at the facts, and set aside the ideology, whether it’s liberal or conservative, you might end up actually coming up with solutions that work.

Now what does that all mean for our investments? Well, I didn’t hear anything in Obama’s State Of The Union message that signaled anything different when it comes to government spending other than perhaps more government spending. So the Federal Reserve will be compelled to continue to buy Treasury Bills, bonds and mortgage backed securities to the tune of $85 Billion a month and now maybe even more if some of these new programs that President Obama wants to initiate actually occur. So that means the deficit spending in all probability will continue unabated. This is what is really important for us investors.

Regardless of whether you’re conservative or liberal, Republican or Democrat, the fact is deficit spending is continuing unabated and at a potentially increasing rate. So the Federal debt will now continue to climb at a trillion or more a year.

Now that of course, has the effect of undermining the dollar as we’ve said many times. The message this week from the President is none of that’s going to change. So that means the dollar will continue to lose value gradually as it has been doing but at some point you’re going to see inflation increasing, gradually at first but then quite dramatically.

What does it mean then for our investment positions? It means the money that the Fed is pumping into the system has to go somewhere and part of it is going into the stock market, and the market is going up. As investors, we don’t really care too much why it’s going up, it’s just going up. So you want to be there; you want to be invested in that market. Now it’s overbought right now. It looks like it’s going to top and correct down. But even when it does, and it will here in the next few weeks, it may be very brief. Then you could very well see another rally into the seasonal high in April.That’s the way it looks right now so in keeping with our philosophy, we want to go where the market tells us it wants to go, not where we think it should go. Right now it’s telling us it wants to go up. So you need to be considering long positions, buying at the right price, not just jumping in at any old price, and then using good risk management principles, protecting your positions with trailing stops.

Now at some point the market will peak out. It could be this summer, or it could be sooner. Then it could drop significantly. But following our discipline with the trailing stops you’ll be protected locking in profits all the way up and then as the market rolls over it may be appropriate to consider short positions. That remains to be seen. I’m just pointing out what a possible scenario could look like here in the next several months.

That’s it for this week. Everybody stay disciplined and we’ll talk to you next week.

Learning To Trade Forex? First Look At Price…

In the world of forex trading you will find all kinds of various ways to take trades.  Many of these way use specific indicators to identify these entry and exit points.  Some of them even use multiple indicators to identify these points.  The problem with some of these is that they become so confusing with all the indicators that they are not very effective for most traders.  Another problem of multiple indicators is that they often times take our attention away from the most critical part of trading.  This most critical part is to look at the price action that is currently happening.  Price action should be the most important thing we look for and indicators should be secondary to this.  By keeping our priorities straight when looking at charts we will be able to better use indicators along with the price action.

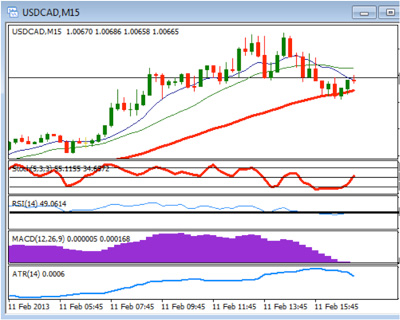
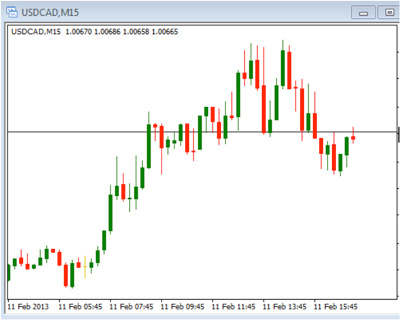
Take a moment to review the two charts below.

This first chart has multiple indicators being uses.  Notice that the chart if fairly cluttered and a bit confusing to look at.  Now this does not mean that you cannot use multiple indicators but you need to make sure that they do not take the place of simply looking at the price action.  The indicators should be able to improve our entries based on price action, not replace the price action.

Now, take a look at the chart below and notice that there are not any indicators, just a clean and clear looking chart.  This chart allows us to see what the price is doing and to be able to identify where an entry may occur without the indicators cluttering up the charts.  Once we have identified a possible entry we can then add indicators to support our decision to enter or exit a trade.


By knowing and using this order of importance when looking for an entry, we can focus on what is the most important part of trading – price action.

Once we become familiar with the price action and begin to rely less on indicators, we can begin to see things as they really are.  Indicators often times give us a false sense of security and can lead us in the wrong direction.  As you start to see the price action you will begin to pick out specific price patterns that can be used in your trading.  These patterns are generally created as the trend is established and the areas of support and resistance are defined.

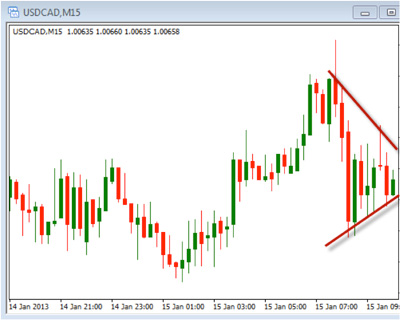
Price patterns are simple ways to learn to enter and exit trades.  There are many types of price patterns and include continuation and reversal types.  The one type I want to look at today is the price pattern called a triangle.  This is a simple pattern and one in which every trader should be familiar.  Take a look at the chart below.


Notice that the lines of support and resistance here are pointing towards each other forming what looks like a triangle.  This converging of support and resistance is created as the price is consolidating in a tight range.  This consolidation will, at some point, break out of the area.  This move with be either above the resistance or below the support line.  The entry would be to look for this breakout and to enter either long or short, depending on the direction it moves.  A stop loss is place at a point back inside the triangle, in case the price decides to reverse.

Simple price patterns like this can be a clear way to identify your entry and exit point when trading.  Take some time to simplify your trading by focusing in on price action and avoiding too many indicators, then look for price patterns such as triangles to enter into trades.

How does a trader sleep well at night?

The answer: RISK MANAGEMENT

Every trader would just like to find that “holy grail” of trading systems so that all of the risk in the market could be eliminated.  That desire starts with the wrong headed notion that investing can ever be risk free.  Most successful investors, at one time or another in their investing career have spent time and money searching for the “perfect” system. There are many advertisements claiming to have a “perfect” system.  Just the other day I got an email claiming to have a “no loss” system.   There are many good systems out there and even some really good systems; however,  there is NO perfect system, period!

The hard reality is that there is no effortless way to make money in the market no matter the claims on radio, or infomercials or unsolicited emails. The truth really is, and any longtime successful trader will tell you that there is one main key to trading success.  Certainly a good system or trading method is important, and investor education is also essential, however, the key is more important than the system used.

The real key and most important element to successful trading truly is risk management.   How can I say this?   How could risk management be more important than the method or the system I use to trade?  If these are questions you are asking yourself, and then ask this one as well; even if you have a good system that works very well most of the time, what system removes all market risk?  What system works, no matter what, under any market condition and will never have a loss.  The answer is NONE, there is no such system. Since such a system does not exist, the only way to be successful in the long run is to manage the risk we take with each and every trade.  Said another way, the very best of systems can only put the probabilities in our favor, or minimize losses not eliminate then.  With each trade we take we should be able at know how much of our account is at risk if the market moves against us, due to anything that we could not predict.  My rule is to always use a stop loss and never risk more than 2 percent maximum of your total account on any one trade.  Nobody likes to take a loss, and I am no different, however, by managing my risk per trade I adhere to the “slow and steady wins the race.” theory of investing and never “bet the farm on a sure deal” trade because there are no “sure” deals in life only the possibility of success if we manage our risk and thus protect our trading accounts.  Risk management will help us to save our accounts from fear and greed, so that even in uncertain times like we are currently in we can trade and get a good night’s sleep!

Trader’s Challenge:  Implement strict Risk Management Rules in you trading plan with a maximum risk per trade of no more than 2% per trade  (New traders should target 1% to start with).

Will Gold ETFs Come Back Later This Year?

So far this year the price of gold and gold ETFs have drifted in a downward fashion but is that likely to continue or is it on the verge of presenting us a with a great buying opportunity?  Unfortunately just like many economic questions the answer to this question depends upon whom you talk to.

The value of gold has historically been very volatile.  To a large extent its price movement works inversely with the stock market. When there was trouble in the world; a war, a natural disaster or a stock market meltdown, it was said that the smart money moved to gold.   Consequently it had been successfully used as hedge against a drop in the stock prices of portfolios for many years.  This did change several years ago when some investors in very wealthy oil producing nations began to flock to the US dollar instead of gold in stressful times but in recent years it seems as though there may have been shift back at least partially to gold. 

When the collapse of the real estate market began in the US around 2007 and 2008 and was made public in August of 2008 the stock market quickly followed.  It isn’t too surprising that for a few months after that there was a tremendous amount of volatility in all markets until there was a beautiful bullish divergent pattern that emerged in the spot price of gold and many gold based index funds and ETFs in October and November of 2008.  After that time there was a steady and very strong rise in the price of gold and many investments having to do with gold that didn’t reach its peak until almost two years later.  Since the peak in September of 2011 the price of gold has been basically range bound fluctuating up and down but not really going anywhere while the S&P 500 has remained range bound with an upward bias.  The price of gold today is basically in the middle of its recent range though it is slightly in the lower half of the range. 

Most experts believe that this will continue with a likely downward bias for the rest of the first half of this year.  The predictions for the second half of the year are where there seems to be a lot of differences of opinion.  Some gold experts believe that the price of gold will continue to drop while others believe that it will rise sharply.  The reason that some are looking for a rise in the metals value is due to the looming potential currency wars by industrialized nations from around the world.  Many countries are interested in devaluing their currencies to increase exports and to lessen trade gaps. 

If an actual currency war does break out and we see the largest nations make attempts to devalue their currencies this could create havoc in the world markets, just about all of the world markets.  We have seen several hundred pip moves in the Forex market within minutes of an announcement of intervention by the central government of a highly traded currency but what happens if all of these countries begin to announce their intention to intervene to weaken their currencies?  We could see ups and downs in the markets all over the world like we have never seen before with a likely steady and rise in the price of gold throughout this time.  Stay tuned because it could be a fun year and don’t forget about what gold could potentially do for your portfolio in the relatively near future.   

Deliberate Markets And How To Trade Them

Today we are going to look at the concept of deliberate markets when looking to trade.  A deliberate market is one in which the price action is moving in a consistent and careful pattern.  As trades are identified we need to consider the volatility that is currently happening with the market.  Gold and silver can become volatile at times and especially when news is pending.  Knowing what to look for to identify volatility can help us avoid times when the market may become less deliberate in the movements.

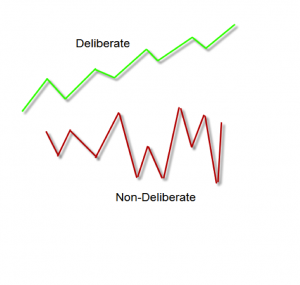
Take a look at the picture below which shows both a deliberate and a non-deliberate price action:

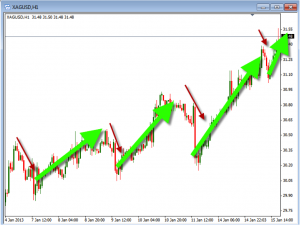
Notice that the deliberate movement consists of a pattern of higher highs and higher lows while the non-deliberate price action has a not distinct pattern of highs and lows.  By avoiding these non-deliberate patterns and looking for the deliberate ones we can place our trades in the best situation for a profitable outcome.  When trying to trade in a non-deliberate market we can anticipate seeing quick moves which can cause us to take quick losses on our trades.

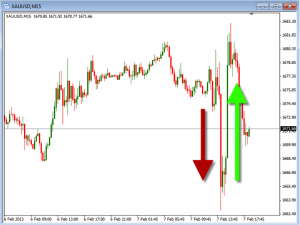
Take a look at the chart below.  This chart was taken from today’s price action before and after the ECB Press Conference.  You will notice that the price action was extreme and quick in the moves that happened during this announcement.  The initial swing was to the downside, followed by a large up move which ended up selling back off.  This type of move can be expected but we cannot anticipate the direction or timing of the moves very quickly. 

When looking to trade we must always look for the upcoming news that might impact our position.  If the news is happening soon we may decide to hold off on entering the trade until after the announcement.  If you are looking to take a trade in anticipation of a big volatile move then you need to make sure you are using good risk management rules.  The only way to avoid the possible negative move is to avoid trading during these times.  If you are determined to trade you can simply adjust your risk level down when determining your position size.

Now take a look at the 1-hour chart of Silver and you can see a more deliberate pattern that it was making.  This deliberate pattern of higher highs (green arrows) and higher lows (red arrows) is what we want to see to trade.  These deliberate movements can give us confidence that we are trading during the right market conditions.

We are not looking for perfection, just to trade during times where the market is less volatile and more deliberate.  The charts will seldom look like the picture above where it is moving perfect but you should be able to eliminate when the market is too volatile.  This can be done by knowing when the news is going to be reported and by looking at the charts to see the times when it is going through extreme moves.

Take some time to review your charts and become comfortable with identifying deliberate moving markets.  Also, make sure you have access to an economic calendar from your broker.  Doing these few things can help you avoid non-deliberate markets.

Stock Market Trading Tip: Don’t Make A Bad Decision Worse

Today, I want to give you a really important stock market trading tip: Don’t replace a bad decision with another bad decision. Generally speaking it is said that most people travel in social circles with others that have an annual income that is within approximately $5,000.00 of their annual income.  This of course means that if you are successful financially you most likely will spend time with other people that are financially successful but if you struggle financially your friends are probably struggling too.  I notice that the same holds true with traders in the respect that good and successful traders will likely talk to other good and successful traders while inexperienced or unsuccessful traders will spend their time with other unsuccessful traders.  This leads to an obvious problem when an unsuccessful trader looks to change trading methods getting new ideas from other traders they know, those traders are very likely just as unsuccessful so they are basically swapping bad ideas back and forth.

Rather than regularly changing trading styles or methods and incorporating bad ideas from others into their trading traders may consider working their current ideas to the fullest extent, massaging them and adjusting them as necessary until they get them to work or until they know for a fact that they will not work and only at that point change.  Just because an idea doesn’t work perfectly all the time doesn’t mean that it can’t or won’t work better with a few adjustments.  Play with adding and subtracting indicators, adjust currently used indicators and trade the method consistently in a practice account until you know for sure that it won’t work and then overhaul your approach.

Treat your trading business as a business, just like any business your trading business needs a business plan or in this case a trading plan.  Many traders seem to want to skip the part about running a business that includes creating a business plan; they seem to want to go right to the part where they count their profits which in many cases will never come.  Very methodically plot out your trading style, plan or method one step at a time from the very first thing that should be done each time you are looking for a good entry point onto the market to thing that will make you exit the trade.  This may start by determining what kind of trading day or market environment it is that you are seeing; is it a nicely rolling market up and down, is it a long nicely trending market or is it a choppy sideways market that really isn’t going anywhere.  The reason for doing this is to determine if the trading method you are using will succeed under the current market conditions.  You may have developed different methods for different types of markets and if that is the case you must determine which one to use.

Keep track of the type of market your methods work best in and only trade specific methods in the type of market that they are likely to succeed in.  What does the recent price action need to be doing, how are the technical indicators lining up and specifically what do they need to be doing.  If you use a moving average or averages do they need to cross or turn or be at particular levels and are the other indicators in the position or at the level that they need to be at.

Once you have achieved a good clear trading method that will work a good percentage of the time when it is applied then you will be faced one of the most difficult things a trader must do and one of the few things that we may actually be able to control; we have to discipline and control ourselves.  We must dogmatically and unemotionally apply our trading method with no regard or real picture on the outcome.  The outcome only matters if we make it matter and if we make it matter we have become emotional about it which means that it is very likely that we will fail at some point.  If you know that your trading method will work about 70% of the time you also know that it will not work about 30% of the time, so what’s the problem, make your trades with no attachment to the outcome while monitoring your progress making sure that the 70% – 30% percentages continue to apply and make some money.  If you win 70% of the time you should be profitable.  Each trade in our trading business is just a business decision.  Some business decisions work out and some don’t, appreciate the ones that work, learn from the ones that don’t and leave the emotions out of trading, my observation is that emotional traders rarely succeed. 


Successful Traders Must Avoid These Common Mistakes

Whether you are new to trading or are a veteran trader, this week I am going to discuss three common mistakes or “traps” you must learn to avoid.

  1. Risking too much per trade:

An extremely common mistake many traders make is to risk too much per trade.  A good rule of thumb is to trade a maximum of 2% risk per trade (1% for a beginner is a good idea).  The first thing to do is to determine what that risk per trade is in dollars.  If you have a 10k account we can then risk up to $200 per trade. (10k account X 2 %)  The next thing to determine would be the total share to trade or the position size based on the $200 maximum risk.  The way to calculate the position size is to calculate the risk per share. To determine the risk per share we calculate the difference between the entry price and the initial stop loss level.  For example, if our entry price is $25 per share and our initial stop loss is set at $24. Based on this example the risk per share would be $1 per share so we could trade up to 200 shares and limit our risk to a 2% maximum.  This will help you limit your risk and not accept more risk than is wise per trade.

2. “Chasing” trades:

The second common mistake is to enter a trade late or “chasing” a trade.  If we pass up or miss a setup and the market moves in the direction of the potential trade, a trader often has the inclination to enter the trade late.  Fear of missing a big move plays an emotional role on our trading. We must avoid this tendency to enter a trade late because often when we enter a trade late we have already missed most of the move.  In short, don’t enter a trade late!

3.  Widening your initial stop loss:

The third common mistake to avoid, is the tendency, when the trade in going against you, to widen your stop loss level.  One of the hardest things for a trader to do is to sit and watch a trade go against you and be taken out by a stop loss.  If the set up was solid and the stop loss was set at a recent support or resistance level, depending on going long or short, then we have a predetermined risk for that trade.  If you widen your stops, you increase the risk or exposure in that specific trade.  This is a very bad habit to get into.   So the rule is:  Don’t move a stop unless it is in the direction of the trade, only move a stop loss to REDUCE the risk in the trade, don’t INCREASE the risk in the trade after you have entered with a proper initial stop loss.

If you can avoid these common mistakes you will be much more disciplined trader.  Successful, disciplined traders must avoid over trading, chasing trades, risking to much per trade and staying in a trade too long after it has failed to move in the direction expected.

If we start to let emotions start to take over, we can make some of these very common mistakes and can really hurt our overall trading success, so don’t let emotions get control of your trading and avoid the temptation to make these common trading mistakes.

How Moving Averages And Trends Can Help You Trade

In today’s article I would like to talk a bit more about the topic of trends.  Specifically, how we can use moving averages to help us know if a trend is moving up or down.  It is critical in your trading to be able to identify whether or not the trend is bullish or bearish.  In the past we have discussed using price action as a way to identify these directions but today we will look at using a simple indicator to help in clarifying what we are seeing on the charts.

First, I want to review the moving average indicator.  This is an forex indicator that has many uses and can even be used to look for entry and exit points.  The basic idea of a moving average is to show us what the average price is of the currency, stock or futures chart we are looking at.  Moving averages can be both short term or long term and can give us an idea of the bullish or bearish nature of the chart.  A short term moving average would give us the near term momentum while a long term moving average will give us a longer term view of the direction the price has been moving.  With this indicator you can choose the amount of time the moving average is using.  The simple moving average is the most commonly used average and simply takes the closing price of the chosen time period and adds them together, then divides by the time period chosen.  So with the 20 period simple moving average it would take the closing price of the last 20 bars, add them together, then divide by 20.  This number would then be plotted on the chart to give you this average price.

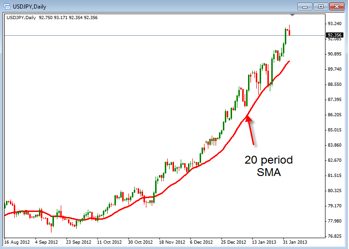
Take a look at this chart below which show a red line.  This red line is the 20 period simple moving average and shows us where the average price currently is located.  It also show you if the average price is getting higher or lower.  This movement, up or down, is what we can look at to help us identify the trend of the chart we are trading.  This chart is a daily chart of the USD/JPY.

One thing to remember is that this moving average line will change base of the the time frame chart you are using.  In this chart the period we are using is the daily chart, this means that the simple moving average is looking at the past 20 day to give the average price.  If the chart had a period of 15 minutes, then the simple moving average would represent the average price over the last 20, 15 minute bars (or last 5 hours).  In either case it give us the direction price has been moving during the chosen time period.  You can simply look at this line to tell you if there is a bullish up trend or a bearish down trend.  The you can look to trade in that direction.

Knowing that the average price has been going up or down is no guarantee that the it will continue to move in that direction, but it does give us the suggestion that it can continue to move in that direction.  This is what the trend tells us, not that it will, but that it is likely to continue in the current move.  Bullish and bearish trend come as price is pushed up or down and using the moving average is one way to help us better see these trends.

How Unemployment Reports Affect Gold & Silver Trading

Non-Farm Payroll and Unemployment number are released on a monthly basis on the first Friday of the month.  Today was the day we had the number released for the month of January.   The Non Farm Employment  number calculates the change in the number of people employed for the prior month, excluding those in the farming industry.  The unemployment rate is the percentage of the total work force that is unemployed and actively seeking employment for the past month.  These numbers are important for various reasons including the fact that the economy needs good job numbers to be growing strong.  These employment numbers are considered a leading indicator in that if people are working they are buying.  It is also important in the fact that it can move the market dramatically if these number come out different than the forecast.

Regardless of how these numbers come out you can see a movement in the overall markets.  It does not matter if the number is above or below the forecast it can move things.  As a trader we need to recognize the fact that a major release is happening and then look for the movements to occur in order to trade.  We never want to trade on anticipation of something happening, only when it happens. 

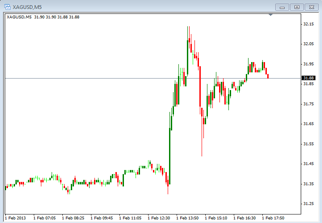
Let’s take a look at the charts of Gold and Silver to see what happened prior to and just after the release of these numbers.  As of late Gold has been trading around the mid 1600 level and silver has been moving above and below the 32 level.  

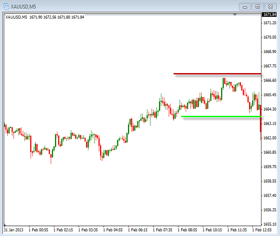
In this chart below you can see what was happening just before the release today. This sideways movements can be typical of the movements you will encounter just prior to major news announcements.  When looking to trade prior to the announcement you can place stop orders to buy or sell as the price begins to move.  You can see where we could have placed these two orders.  There are several issues that can happen when trading close to the announcement.  One is that if the spread widens you can get filled a poor price.  Another is that the volatility can cause you to get in and stopped out quickly.

In a situation like this you can see where you would buy and where you would sell on a move up or down.  If it moves above the buy stop you would enter a long position and if it moves below the sell stop you would enter a short position.  Now take a look at the chart and what happened after the announcement was released. 


It also had a big move up follow by a sharp move down.  In either situation you need to make sure you your are controlling your risk.