Be A Better Trader By Avoiding These Mistakes

This week I would like to discuss 3 common or “rookie” mistakes that all traders have made at one time or another, mistakes that successful disciplined traders have learned to avoid.

  1. Widening Stops to stay in Losing Trades– The first common mistake that traders should avoid is one that we all have done at some time or another, is the inclination, when the trade in going against you, to stay in the trade by widening  your stop loss level.  One of the hardest things for a trader to do is to sit and watch a trade go against you and be taken out by a stop loss.  If the set up was solid and the stop loss was set at a recent support or resistance level, depending on going long or short, then we have a predetermined risk for that trade.  If we widen our stops we only increase the risk or exposure in that specific trade.  This is a very bad habit to get into which often results in larger losses then we would otherwise have had.   So the rule is:  Don’t move a stop unless it is in the direction of the trade, only move a stop loss to REDUCE the risk in the trade, never INCREASE the risk in the trade.  Don’t be afraid to take a small loss when the premise for a trade has gone bad.


  1. Improper Position Sizing; Risking too much per trade – Another common error or mistake that many traders make is to risk too much per trade. A good rule of thumb is to trade between 1%-2% risks per trade maximum.  The first thing to do is to determine what that risk per trade is in dollars.  If we have a 10k account we can then risk up to $200 per trade. (10k account X 2 %)  The next thing to determine would be the total share to trade or the position size based on the $200 maximum risk.  The way to calculate the position size is to calculate the risk per share. To determine the risk per share we calculate the difference between the entry price and the initial stop loss level.  For example, if our entry price is $25 per share and our initial stop loss is set at $24 (I believe that a stop loss level based on support or resistance is better than a predetermined set stop loss level.) based on this example the risk per share would be $1 per share so we could trade up to 200 shares and limit our risk to a 2% maximum.  This will help us limit our risk and not accept more risk than is prudent per trade. Remember, the key is proper position size.


  1. Chasing Trades– The third common mistake I would like to point out, is to enter a trade late.  If we pass up or miss a setup and the market moves in the direction of the potential trade, a trader often has the inclination to enter the trade late.  Fear of missing a big move can play an emotional role in our trading. We must avoid this mistake to enter a trade late because often when we enter a trade late we have already missed most of or, perhaps even the entire move.  So if you have missed a perfect setup, the rule is: don’t enter a trade late, wait for the next setup.


The key to being a successful trader mostly comes down too being more disciplined. If we can avoid any of these common mistakes we will be much more disciplined traders.   Disciplined traders avoid over trading, chasing trades, risking too much per trade and staying in a trade after it has failed to move in the direction expected.

Traders Challenge:  Don’t let emotions take control of your trading; Become a more disciplined 

Who Does Your Trading?

I have the opportunity to communicate with many traders in several different markets and an interesting question came to mind due in large part to common statements and common themes among them.  The question is the title of this article which led me to another question because the answer to the first question is often times very apparent.  The second question is “Are most traders really qualified to make their own trading decisions?”  I’m not trying to be controversial or funny in any way, based on what I hear from many of the traders that I communicate with both questions are very legitimate.

The first question is simply asking if we are making our trading decisions based on whatever trading method or model we are using which would require us to be disciplined traders or do we let our emotions, personalities and egos get in the way.  In short, do we go where the market leads us or do we actually think that we can control it or negotiate with it to go where we want it to go?  Essentially all markets will go where they go and all we can do as traders is to try to be on the right side of some of the moves that it makes.  Hopefully we can align ourselves with it and let it carry us with it for as long as possible before it turns on us or before we exit for any number of reasons.  The point is that if you are unemotionally following your trading strategy and it is a strategy that will win more times than it will lose and your losses are not proportionately larger than your wins you virtually have to be a successful trader.  It seems to me that when traders get themselves into trouble is when they start thinking too much. 

If you think about it, anytime that you enter the market, even if you enter randomly, you have a 50/50 chance of success because the price action can only go up or down.  If you have a time tested method that increases your odds from 50/50 and you have been successful with it don’t let yourself get fooled into believing that you know something about what may or may not occur in the market.  At some point many traders seem to come to the conclusion that they really do know allot about trading, they know allot about the markets in general and they really are creative in their approach to trading but what they don’t know allot about is what the markets will actually do.  Once you come to the conclusion that you really do not know what the markets will do in conjunction with all of the things that you do know about trading and the markets you will realize that the best way to make consistent money in the markets over an extended period of time is to just quit thinking so much which really just leads to guessing.

When we think too much we fool ourselves into believing that we actually know something which of course we do not when it comes to what the market will do next.  Often times we will set up our trades based on a good solid method but we just can’t leave it alone.  We need to tweak it and make adjustments and possibly second guess ourselves altogether based on what we think we know instead of keeping in mind what we actually know which is nothing. 

Separating and understanding what you actually know from what you may think you know will likely be the difference between being a very successful trader and being a mediocre trader at best.  If you know that you can set yourself up to be successful more than 50% of the time be unemotional, stop over thinking things and habitually make and manage your trades just like you are a machine, turn your trading platform off if necessary after you setup your trade.  If you can put the odds in your favor let them work in your favor by being patient and letting the market come to you so you can react to what it does versus over thinking yourself into believe you can predict what it will do.


Trading The News

Today I want to discuss some of the things that may occur when trading during times of news.  As you know news is something that happens every day.  It can be news that is scheduled to be released or something that happen without notice.  In either case we need to be prepared in case the news that comes out negatively impacts our positions.

In order to combat the negative problems that come with news we need to be using proper risk management in our trades.  This mean using a fixed risk amount that we do not exceed when trading during volatile news times.  If we are trading and risking 2% normally, during news times we may decide to drop that to 1% or some lower amount that we are comfortable with.

When news is scheduled we can know when the volatility may come into play and be prepared for it.  Make sure you have a good economic calendar that will show you when all the important economic reports will be released.  This way you can be prepared for the reaction.  Unscheduled news is a little more difficult to predict.  Things such as wars, disasters or unplanned company scandals can cause the markets to react quickly and without notice.  This is why keeping our normal trade risk at comfortable level is so important.  Never risk more than your specified maximum amount per trade.  In addition, consider keeping your total portfolio risk at a reasonable level such as 10-20%.  This way you should never be at a catastrophic lever of risk in your portfolio.  If you are risking 50-75% or more in your account you may never trade again if you get stopped out of all your positions.

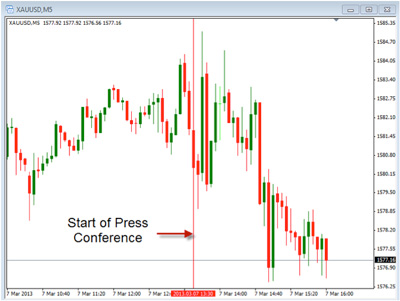
Let’s take a look at what happened today with gold as the ECB Press Conference was going on.  The charts below is of gold on a 5 min. time frame.

Notice the difference in the size and the volatility of the candles before and after the press conference began.  This is a common occurrence as new is being processed by the market.  First it looks like it is moving one way, then it reverses and goes the other way in an instant.  If you are trying to trade this you have the potential of entering a trade and getting stopped out immediately.  Some trader will try and straddle the trade by placing a buy stop above the current price and a sell stop below to see if they can catch the immediate reaction in one direction or the other.  Again, the issue with this is that the market can sometimes move so quickly that you can get in and stopped out quickly.  If you are trying to trade this way make sure you cut your risk down in case of a negative reaction to your position.

Sometimes the news can be fun to trade but never forget that we are trading a market that is very sensitive and can become very volatile during these times.  If you want to trade during news periods make sure you practice in a demo account so you can get a feel for what is happening and how quickly you need to respond to changes.  Once you get it down then you can try if you still want to.  Even if you are not purposely trading the news you will be affected by it now and then.  Just make sure you know the times that new is being released

Dow Jones Rally Explained

It finally happened. The Dow Jones Industrial Average closed at record highs, with the S&P close behind. So now of course there’s a lot of euphoria around that, especially coming from the media and everyone is all excited. Of course, the best time to have bought this market was well before it closed above the new high. That would have been a couple of months ago.

A couple of months ago, in late December, everyone was worried about what the government would do with the fiscal cliff and nobody was suggesting that you buy the market. Now that it’s gone up dramatically in two months, of course all the talking heads are out there telling you to buy. So beware! Now that doesn’t mean the market can’t go higher from here, and right now I think the probability is that it will. It could go another ten percent higher from here. However, it won’t be a straight line. It could easily drop five percent from here before going up that ten or fifteen percent.

Now don’t get caught up in all the euphoria and just blindly enter the market. That’s the worst possible thing you can do. You’ve got to stick to your method because it’s your method that gives you an edge, not the fact that the Dow closed at record highs. That doesn’t give you an edge at all.

Remember if you don’t know what your edge is, you don’t have one. You have no business being in the market. So make sure you’ve got a good method, you know what your edge is, and that your method includes strong risk management principles.

Risk management is always very important. Without it you’re going to lose. But it’s even more important these days with all the financial turmoil in the world, even though the market may go up another ten percent here in the next several months, you could wake up one morning and find that it starts to drop very, very quickly. I’m talking about a big time drop, like happened in 2008, and happened back at the dot com bubble. Do you think that might happen again? You bet it will. We don’t know when. The point is if you’re long in the market, you’ve got to protect your positions with trailing stops or by buying puts.

Whatever your method tells you to do around risk management make sure you do it. In the meantime, go where the market tells you it wants to go. 

Should you be afraid of the markets? Check out the VIX Index!

The last few week’s we have seen quite a bit of volatility in the market due to several mixed events in the economy for example, the market trading at all time highs, the much discussed  “sequestration” budget cuts and the Italian elections, which  have produced quite a bit of volatility and have pushed  the market up and down.

Today we are going to discuss the VIX index. If you do an internet search on VIX you will find some interesting results: a swim wear catalog, the name of a rock band and the Vienna Internet Exchange. Interesting stuff, but not quite what I want to discuss. The CBOE’s VIX is a popular market-timing indicator. Let’s take a look at how the VIX is constructed and how investors can use it to evaluate U.S. equity markets.

VIX is the ticker symbol for the Chicago Board Options Exchange Market Volatility Index, and is a popular measure of the implied volatility of the S&P 500 index. The VIX is often referred to as the fear index  The VIX also represents one measure of the market’s expectation of stock market volatility.

How did the VIX come to be?  The first VIX, introduced by the CBOE in 1993, was a weighted measure of the implied volatility of eight S&P 100 at-the-money put and call options. Ten years later, it expanded to use options based on a broader index, the S&P 500, which allows for a more accurate view of investors’ expectations on future market volatility. VIX values greater than 30 are generally associated with a large amount of volatility as a result of investor fear or uncertainty, while values below 20 generally correspond to less stressful, even complacent, times in the markets.

During periods of market turmoil or uncertainty, the VIX often spikes higher, because there is a panic demand for OEX Puts as a hedge against further declines in the overall stock market. During more bullish periods, there is less fear and, therefore, less need for stock investors and portfolio managers to purchase puts. This is why, As stated above the VIX is often referred to the “fear index” or sometimes the “fear gauge” because at times when the index rises because of market volatility increases, the market tends to be in more of a panic and often the panic leads to a market sell-off.  Conversely, during times when the market is calmer either ranging, or a

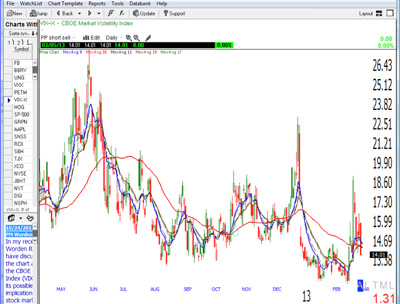
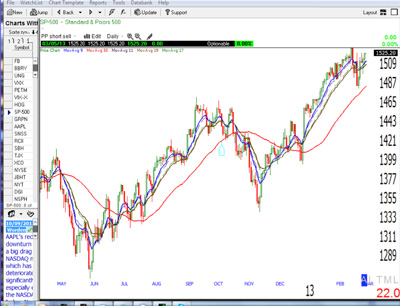
steady trend the VIX is lower as the volatility is lower. This inverse relationship in the market is illustrated by the graphs below.


Notice that as the VIX spikes up in June 2012 and Late Dec 2012 the S&P index moved lower, but as soon as the VIX index calms down the Market goes up. One saying about the VIX that investors will hear in relation to the VIX is this: “When the VIX is high, be ready to buy. When the VIX is low, look out below!” this is illustrated in the charts above, generally speaking when the markets are In a panic, the VIX is high.  After this selloff or panic is over, and VIX retraces the market is generally in a good place to rebound or move higher..  So understanding market sentiment using the VIX index is a valuable tool for investors looking for some clarity about the market direction.


Traders Challenge:

This next month, Look at the VIX index and follow the market volatility Also, become familiar with the inverse relationship between the VIX and the S&P indexes.

Your Weekly Forex Preview

Today we are going to look at what is happening on the six major forex pairs to see where they have been and where they may be headed.  The goal is to get a sense for the direction that things may be going in this upcoming week.  Although there is not guarantee that the price will do what we think, by looking at the current momentum we can get an idea for where the trend may push it.

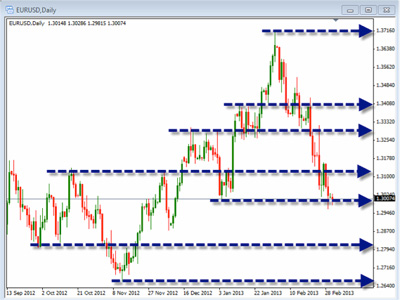
We will be begin by looking at the daily chart of the EURUSD.

Notice that I have included some areas where there may be support or resistance located.  These are area where the price may have a difficult time moving beyond.  Currently with the EURUSD we are seeing a strong down trend from the chart high.  This should indicate to us that the bears are in control and that our bias may be to look for shorting opportunities.

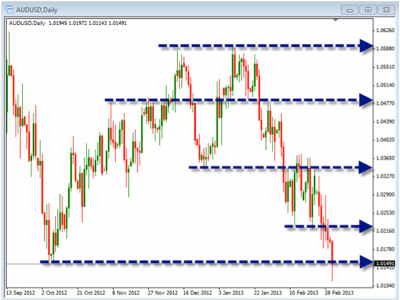
Next is the Daily chart of the AUDUSD.

You will also see on this chart a strong downward trend from the chart highs.  In fact we may identify a double top on this chart which is a strong indication of a possible reversal.  Currently this chart shows a very bearish trend.  Even though we may think it can’t go any lower, we need to make sure we see evidence on the chart before going long.

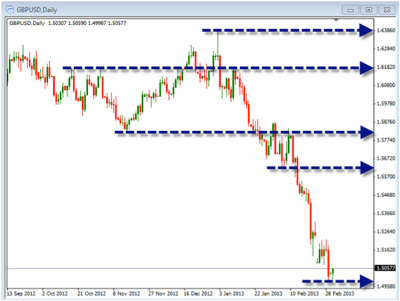
This is the Daily chart of the GBPUSD

With this chart we are seeing an even stronger bearish trend.  This has shown a steep drop from the chart highs and one where the bears are in strong control.  With a trend like this we need to see some strong evidence that the bulls have come back before we decide to take a long trade.  This type of trend will help us as we identify shorting opportunities.

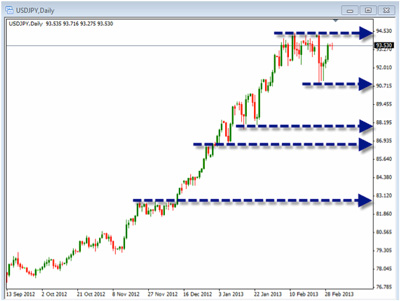
Now for the USDJPY.

Over the past 6 months this has been the strongest trending pair of the six we are looking at.  Currently we are seeing a bit of a topping formation as the price action has taken a break for the strong movements.  Any time there is an extreme move on a chart we need to take caution and look for signs that there may be some weakness forming.  We don’t want to be buying at the top here so look for a pullback in order to take additional long positions.

Here is the USDCAD.

Although not as long of an uptrend as the USDJPY, this pair as exploded to the upside over the last month or so.  Again, look for a settling of this move before getting too caught up in the bullish strength.

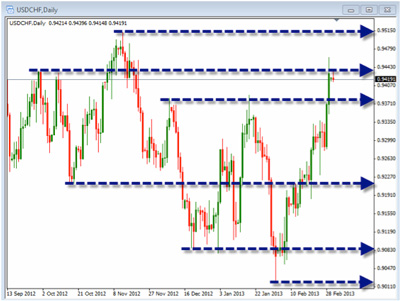
Last, but not least, the USDCHF.

This pair has been the most sideways over the longer term but very strong over the last 6 weeks.  Watch for areas of resistance to come into play as it may be an area for reversal.

Regardless of the pair we are trading it is important to look at the daily charts to see the longer term momentum that is there.  Currently, all these pairs have exhibited strong trend in either the up or down direction.  Use these trends to help in your trade while at the same time be cautious of potential reversals.  Make sure you are using proper risk management and are looking for your setup conditions to be met prior to entering your trades.  Have a great week!


How to Kill a Trade Before it Gets Started

A very common question from traders that I am regularly asked, especially by new traders, is how one knows which specific stock to pick from a list of seemingly good qualified trade candidates on any given day.  The correct answer, which is the answer that most of them do not want to hear, is that this is something that is unpredictable.  If you have a good solid trading method that you are comfortable implementing and following with confidence, depending upon exactly how many stocks you apply it to, there is a good chance that you will get allot of stocks that meet the qualifications or conditions of the method.  This makes sense if you are applying your method to the entire stock market which will be over 7,000 stocks.  Once you pare this list down after your method is applied you may still end up with a rather large list of qualified stocks.  Picking among them is what will likely separate a winning trader from a losing or mediocre trader.

Once you have applied your setup conditions from your stock trading strategy that are available in the market on any given evening a visual inspection of each of the ones that meet your criterion may be the best and only real way to determine which one or which ones you want to trade.  You may consider looking at a chart of each of the candidates looking for the one or ones that are trading in the most deliberate fashion.  Generally speaking a deliberately trading stock is one whose price action is not producing allot of gapping, wide range bars, long wicks on each end of its candles or alternating colored candles.  For a long position we want to see the price action creating higher highs and higher lows gradually moving in an upward fashion.

If we see a chart that portrays allot of gapping from day to day this means that there is allot of pent up pressure on the price action of the stock when the market is closed, this pressure is then released upon the next opportunity for traders to trade the issue which is the open of the next day’s trading.  Gapping can work great if the gap is in your favor but it can destroy the premise of a trade very quickly if it goes against you.  Protective stops are not guaranteed so if a stock gaps open and gaps well beyond your stop you will get stopped out at the next available price which may be far worse than what you had committed to risk on the trade.  Generally speaking stay away from stocks that exhibit tendencies to gap. 

Wide range bars or very large bars in the price action can be very dangerous as well if you are looking to enter the market at the time that they occur because the move that you are looking for could be exhausted just in the creation of one wide range bar.  Again if you already have a position in a stock and a wide range bar occurs in your favor it can be a great day but if there is a wide range bar that goes against you your trade may end up giving back any unrealized profit that it had up until that point getting stopped out with little or no profit or maybe even with a loss.  Avoid entering the market right after a wide range bar has occurred and avoid issues that regularly produce them.

Each candle is a war between buyers and sellers with the body limits of a candle being the open and close and the candle direction showing the winner over the given time period.  If we see a candle with a wick on a given end we know that there was the effort by the traders pressuring that side, up or down, which failed in the end.  When we see wicks on both ends of a candle especially long wicks this is an indication that neither side won or failed which is a very clear indication of indecision and even more so when the candle body is small.  When we see this, especially if there are several in a row, this is a sign of indecision meaning that the price action is just as likely to go one way as it is to go the other.  Avoid stocks whose price action is creating a stalemate in consecutive candles.  Alternating colored candles are also a problem for the same reasons, avoid this situation as well.

The items mentioned above are all clear indications of indecision in the price action of a stock and should be avoided as much as possible.  There are so many opportunities to trade and make money there is absolutely no reason to take on any unnecessary risk.  Trading in general is difficult enough so why get into a trade when right from the inception of the trade it does not have momentum in your favor.  Be patient and be very selective in the trades that you do participate in putting yourself in the best possible position to be successful.  Trading and losing money is easy anyone can do it but trading consistently and having the discipline to follow your rules will greatly enhance your success.  All we are doing by avoiding these pitfalls is simply following what the market is telling us.  Always remember that we do not make the market do what we want it to do it tells us what it is going to do.

Entry Orders Explained For Stock, ETF & Forex Traders

Today we are going to discuss the various types of entry order.  Regardless of what you trade, you will need to know how to enter your position.  Entry orders are used in the stock market, forex market, options market and every other market out there.  If you don’t know how to get into a trade, you won’t be a very good trader.  The types of orders used will depend upon what you are trying to do with your trading strategy.

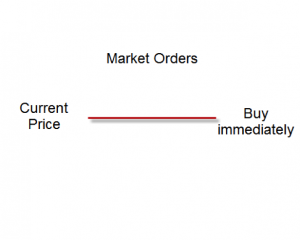
Entry Market Order – A market order is used to enter the trade immediately.  You are not guaranteed the price but you are guaranteed getting in.  This is used by many traders who are scalping the market.  They see a trigger to get in and enter the market immediately at the current price.  Take a look at the example below.

If the current price is 1.2000 and you place a market order you will enter the trade somewhere around the price of 1.2000.  You won’t know the exact price, just that you will get in around the current price.  If you need a specific price you will need to use another entry order type.

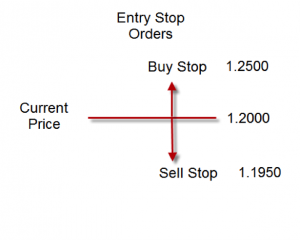
Entry Stop Orders – This is an order that gets you into a trade once the price begins to move a specific direction.  A buy stop will buy the position when the price moves up to a specific price and a sell stop order will short the positions when the price moves down to a specific price.  Take a look at the example below.

In this example you would place a buy stop order if you wanted to enter the trade when the price moves up to your specified price.  If the current price is 1.2000 and you wanted to enter if the price moved to 1.2500, you would place your buy stop order at 1.2500.  If you wanted to short at 1.195, you would place a sell stop at 1.1950.  These order types get you into the trade at a specific price but not a specific time.


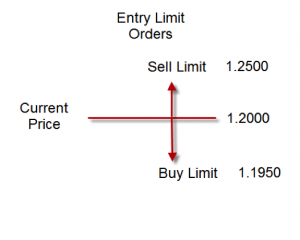
Entry Limit orders – This type of order is the opposite of the entry stop order in that you would be buying when the price moves down and shorting when the price moves up.  The idea would be to wait for a better price than the current market price before getting into the trade.  See the example below.

In this example you can see that if the current price is 1.2000 you would go long when the price drops back down to 1.1950 and you would short if it moved up to 1.2500.  Again, you would know the price but not the time for entry.

These are some of the more commonly used entry order types.  You should take some time to review each of these orders so you know how to enter correctly.  You may use each of these types of entry orders depending upon the type of methods you are trading.  In one you may use market order, in another you may you entry stops or limits.  Regardless of what you use you need to make sure you know what types your platform offers.  The more you know about how to enter the trades the more choices you will have in your trading.