What Is The Perfect System For Uncertain Market Conditions?

For the last several weeks the markets have been up and down with some wide ranges.  The market is having a difficult time picking a solid direction.  For example, every day in the news we are bombarded with domestic budget problems due to “budget sequestration” or foreign problems coming from Cyprus and other counties.  Many market forecasters are calling for a serious pullback; other analysts are calling the market to move even higher before the end of the year.  So which is it; up or down?  Every trader would just like to find the “Perfect System “so that all of the risk in the market could be eliminated.  That desire starts with the erroneous idea that investing can ever be easy or risk free.  Most long term investors, at one time or another in their investing career have spent time and money searching for the “perfect” system. The truth is there is no perfect system. There are many good systems out there and even some really good systems; however, there is NO perfect system!

This brings me to the topic of auto trading robots. Many email advertisements are dedicated to making these pre-programmed auto robot systems, seem almost like they can’t lose; almost “magical.”   The hard reality is that there is no effortless way to make money in the market no matter the claims on radio, or infomercials or unsolicited emails.

The truth really is, and any longtime successful trader will tell you that there is one main key to trading success.  Certainly a good system or trading method is important, and investor education is also essential, however, the real key is more important than either the system or knowledge used.   The real key and most important element to successful trading is risk management.   How can I say this?   How could risk management be more important than the method or the system I use to trade?  If these are questions you are asking yourself, and then ask this one as well; even if you have a good system that works very well most of the time, what system removes all market risk?    The answer is there isn’t one, there is no such system. Since such a system does not exist, the only way to be successful in the long run is to manage the risk we take with each and every trade.  Said another way, the very best of systems can only put the probabilities in our favor, or minimize losses not eliminate then.  With each trade we take we should be able at know how much of our account is at risk if the market moves against us, due to anything that we could not predict.  My rule is to always use a stop loss and never risk more than 2 percent of your total account on any one trade.  Nobody likes to take a loss, and I am no different, however, even under volatile market conditions like we are in right now, by managing my risk per trade.  I adhere to the “slow and steady wins the race.” theory of investing and never “bet the farm on a sure deal” trade because there are no “sure” deals in life only the possibility of success if we manage our risk and thus protect our trading accounts.

Risk management will help us to save our accounts and our financial future from greed, and will help us to get a good night’s sleep, even in more volatile uncertain times like these!

The Moving Average Indicator

One of the most commonly used tools in trading is that of the Moving Average Indicator.  This indicator is something that can be used in various way.  It can help you know if the average price is moving up or down which defines the trend.  It can be used to show areas of support and resistance.  It can also be used to look for potential entry and exit points.  Knowing how to use this indicator can be a valuable tool in your ability to read charts and enter trades.  Today we will take a look at a couple of the things this indicator can do.

Moving Average Trend

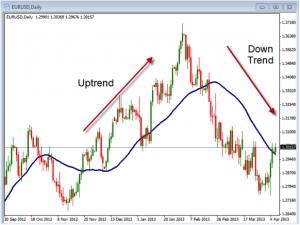
An uptrend is defined a price making a series of higher highs and higher lows.  This can series of higher highs and lows can also be seen by using a Simple Moving Average.  In the chart below you can see how this uptrend can be seen clearly when using the Moving Average.  In this chart we are using the 40 SMA to help clarify the direction of the trend.  If the Moving Average is moving up then we will call the trend up.  The reverse would be true if the moving average was moving down.

Moving Average Support/Resistance

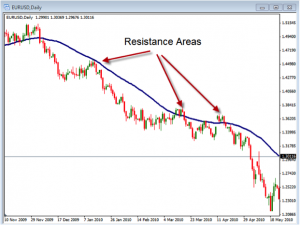
One of the most important thing we can find on the charts is where the areas of support and resistance are located.  Know this location in conjunction with the trend can be a great value in our evaluation of the charts.  In the chart below you can see where the Moving Average can help identify these support and resistance areas.

This chart is the daily chart of the EURUSD and you can see the Moving Average is trending down and the price is bumping up against the Moving Average.  This line is an area where the resistance is coming into play causing the price to continue moving lower.

Moving Average Entries

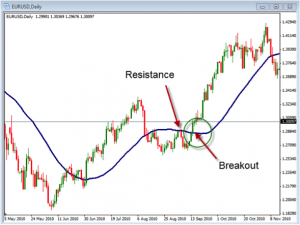
In addition to the trend and support/resistance areas a moving average can also show us potential points of entry.  Knowing that the price is changing we can use the Moving Average to determine where we may want to enter a trade.

Notice that the chart above shows where the price is breaking above the Moving Average where it was holding as resistance.  Using the Moving Average as potential entry points can show us where to enter on a breakout point.  In addition to the breakout of the Moving Average you can use 2 Moving Averages to look for entry points on the crossing of the two Moving Averages.  One would enter long as the shorter term Moving Average crossed above the longer term Moving Average and the reverse would be true when shorting, the shorter term Moving Average would cross below the longer term Moving Average.

So, regardless of how you use the Moving Average you have several options to choose from.  This valuable indicator can be an asset to you in your trading as well as how you evaluate your charts.  Take some time to look at the various types of Moving Averages as well as the different time periods you can use.

Is the U.S. dollar the place to be now in the currency wars?

Is the U.S. dollar the place to be now in the currency wars? Despite all of the massive debt accumulated by the U.S. Federal Government aided and abetted by the Federal Reserve buying $85 Billion a month of Treasury securities and mortgage-backed securities, the dollar has enjoyed a dramatic rise since early February. It’s gone up over five percent against a basket of other currencies. No one knows for sure but I believe that’s been driven in part by the continual turmoil in Europe highlighted by the Cyprus crisis.

As these events continue to hit the news, as the banks continue to show their weakness, and the politicians continue to run out of options, there is a flight to safety and that includes the dollar. Right now, gold has been out of favor and is down for the year, and just took a dive yesterday, while the dollar has enjoyed terrific strength. But I believe all of that is about to change. Within the next week or two, I believe you’re going to see gold bottoming out, likewise silver, and that the dollar will top out and head south. So you’ll see the dollar losing strength against the Euro, the Pound, the Aussie Dollar, against gold. You’ll see gold price rising, and indeed I believe the dollar is already topped out. So I think you’re going to see the dollar dropping here first followed by a bottoming of gold in the next couple of weeks.

What that means for currency traders is mega trends straight ahead. Now when a strong trend such as the dollar has been in since early February runs out of buying pressure, there’s choppiness in the market. The choppiness for us traders is not good because we will tend to get into positions and stopped out until that choppiness abates and a new trend emerges. Thankfully it does not last long and our trading methods will shelter us from most of that choppiness, but not all.

But as long time traders know that when such market behavior occurs, it’s generally followed by dramatic and swift moves that offer the next wave of terrific profit opportunities. Of course new currency traders don’t understand that and abandon their trading method at exactly the wrong time. That’s why many traders never allow themselves to succeed. So fasten your seatbelts; currency mega trends straight ahead. 

5 Reasons You Must Put A Stop Loss On Every Trade

A Stop-Loss order is an order that you can place with your broker to sell a stock at the market price if it drops to a certain, predefined price. While there are many reasons for and against using stop-loss orders, they can be an extremely beneficial insurance policy for individual traders. Many of the arguments against using stop-loss orders come from traders who have the benefit of sitting in front of a computer for most of the time that the markets are open. For those of us who operate in the real world where this is not possible, a stop-loss order can be an essential tool in our trading toolbox.

1. Insurance For Your Paper Profits

One way that individual investors can implement the use of a stop-loss order is through what is known as a trailing stop. This is a strategy where the trader increases the price that will trigger the stop-loss order as the stock advances. Many investors who use this trailing stop method set the stop-loss trigger price at a certain percent below the stock price, thus, as the stock rises in price, the trigger rises with it.

An example of this would be buying a stock at 100 and having a trailing stop-loss of 5% from the stock’s high. If your stock climbs to 110, your stop loss trigger would be 104.5. Moving the stop-loss higher at this point would then guarantee a profit of at least $4.50 per share, provided you are investing in a liquid stock. If the stock then continued to 120, the trailing stop would increase to 114, thus locking in a $14 per share profit. The trailing stop is a great way for individual investors to protect paper profits, but be careful not to set the stop-loss trigger to tight to the stock price as you will want to give your stock enough room to work its way higher.

2. Insurance Against Significant Losses

Another way to implement the stop-loss order is as a purely defensive strategy. Many successful traders will define the maximum loss they are willing to take on a position before they enter that position. In this case, you can simply set your stop-loss trigger to be whatever percent you define below your entry point.

For example, if you are going to buy a stock at 100 and you have already decided that you are not willing to take a loss greater than 10% on the position, then you can immediately set your stop at 90 and be fairly certain of your worst case scenario. While there are many variables that are out of a trader’s control, downside risk is one variable that a trader can define ahead of time and generally stick to.

3. Insurance Against Your Own Laziness

This is the main reason many part-time trades use stop-loss orders. If you are a normal person who trades part-time, you know that there are many times when life has a way of getting between you and your market analysis. While all great traders will tell you that there is no substitute for hard work and doing your own homework, this is one way that the part-time trader can cheat a bit. Having a stop-loss order set, whether it be a fixed or trailing stop, makes it so a part-time trader doesn’t have to panic if he misses a day or two of market action.

As part-time traders, there are many instances when day jobs, family commitments, and other obligations pop up and get in the way of regular scheduled market study. In these instances, the trader can relax because the stop-loss order has the down side covered and will be automatically executed if triggered. Therefore, a trader can walk away from the market indefinitely, knowing the worst case scenario.

4. Insurance Against Overruling Your System

Another great fit for the stop-loss order is with the undisciplined trader. Dealing with losses is one of the hardest concepts for many new traders to grasp. Setting an initial downside stop-loss order is a great way for an undisciplined trader to commit and hold themselves to a maximum loss. Many new traders will attempt to rationalize reasons the stock is only down temporarily and convince themselves that it will come back. Having a hard stop-loss order set prevents a trader from revising his original outlook and plan.

5. IT’S FREE!

Since the best way to look at a stop-loss order is as insurance, you might be asking what is the premium or how much does it cost? That’s the best part. Stop-Loss orders don’t cost any more than traditional market orders. The are simply a pre-placed market order. This means that the investor can purchase insurance against his downside risk at no cost! The stop-loss order is truly one of the most powerful tools in the traders toolbox.

What Is The Non-Farm Payroll Report And Why Traders Care?

For you new traders out there, this is Nonfarm Payroll week.    This monthly employment report can give the market an idea of the relative strength of the US Labor Market. The NFP report, as it is commonly referred too, is generally released on the first Friday of each month.  I thought we would cover the ins and outs of the payroll report.

What is nonfarm payroll employment? Nonfarm payroll employment is an influential statistic released monthly by the United States Department of Labor as part of a comprehensive report on the state of the labor market.  It is a report that covers the employment numbers for goods-producing, construction and manufacturing companies for the previous month. Typically, the Bureau of Labor Statistics releases the report at 8:30 a.m. Eastern Time on the first Friday of each month and covers the numbers for the previous month. The U.S. Nonfarm payroll number is an important factor which can affect the U.S. dollar, the Foreign exchange market, the bond market, and the stock market.

The data released also includes the change in nonfarm payrolls (NFP), as compared to the previous month. The NFP number is meant to represent the number of jobs added or lost in the economy over the last month, not including jobs relating to the farming industry.

In general, increases in employment means both that businesses are hiring which means they are growing and that those newly employed people have money to spend on goods and services, further fueling growth. The opposite of this is true for decreases in employment.

While the overall number of jobs added or lost in the economy is obviously an important indicator of what the current economic situation is, the report also includes several other pieces of data that can move financial markets:

1. The unemployment rate. The unemployment rate in the economy is reported as a percentage of the overall workforce. This is an important part of the report as the amount of people out of work is a good indication of the overall health of the economy, and this is a critical number that is used by the Fed when determining any action that might be needed in the economy.

2. Which sectors the increase or decrease in jobs came from. This can give traders a heads up on which sectors of the economy may be primed for growth as companies in those sectors such as housing add jobs.

3. Average hourly earnings. This is an important component to know, because if the same number of people are employed but are earning more or less money for that work, this has basically the same effect as if people had been added or subtracted from the labor force.

4. Revisions of previous month’s data. An important component of the report which can move markets as traders re-price growth expectations based on the revision to the previous number.

In summary, employment in the economy is one of the most watched economic indicators, because employment drives every aspect of the economy.  If the NFP comes out better or worse than expected, the markets can really react, (many times overreacting and settling down close to where they started.) Traders challenge: Look for the release of the NFP report this coming Friday morning May 5th at 8:30 am eastern and see how it affects the market!

Review Your Results

Today begin a new month and the second quarter of 2013.  This is a great time to take some time to review how our trading has been going.  It is important to evaluate what we are doing in order to better understand want is working and what is not.  Know what to improve upon is the first steps in becoming a better trader.

The first thing that we need to do in order to review our trades is to get a list of all the trades that we have done over the last month or quarter or week or whatever time period we are looking at.  This can be done various ways from writing them down to downloading them from your trading platform.  I will use the MT4 platform as our example.  On this platform there is the trading terminal box which has a tab called “Account History”.  When on this tab you can right click and choose “Custom Period”.  This will allow you to specify the time frame you want to evaluate.  You first choose a from date, then a to date.  Then the platform will then pull up the trades done during this period.  Once these trades pull up you can once again right click on the trading terminal and choose “Save as Detailed Report” and it will pull up all your trades with some other important information in regards to your results.

In this report you will see a graph that represents the equity curve of your account.  You will be given information such as total trades, gross profits, gross loss, total net profit, number of winning and losing trades, average winners and average looser to name a few.  With this information you can quickly review what is working and what is not with your trading.  This works best if you are trading a specific set of rules and not just taking random trades.  By evaluating trades that follow the same rules for entry and exit you will be able to see how effective your rules are.

A few things that you can start to look at when evaluating your trades.  The first thing we can look at is the Total Net Profit which tell us if we are profitable or not.  Obviously, if we are not profitable we can begin there by determining if it was a failure in our system or in ourselves.  Sometimes the system works but we do not trade it properly so it is not the systems fault but ours that it was unprofitable.  The next thing we can look at is the number of winners vs. the number of losers.  If we have a high level of losers we need to see what the cause of this might be.  Is it the market or just a function of our rules that might need to be changed?  The last thing we will discuss here is our average winners and our average losers.  Sometimes, even if our wins are greater than our losses we can still be unprofitable if our average losers are much bigger than our average winners.  In fact, we could see a situation where we have more losers than winners but are profitable because our average win is much larger than our average loss.

Regardless of how successful you feel at your trading, it is a good idea to review your results in order to become even better.  Take some time to review your evaluation process and give yourself some time to review how you are doing with your trades.