Position Sizing is Key to Controlling Risk

Not too long ago, I was in a port city watching the hustle and bustle of the huge cargo ships at the docks. The gigantic cranes were unloading cargo containers off the deck of a ship. As I was watching the ship’s unloading process, I started thinking about how efficiently the ship was being unloaded and how much cargo had been moved across the ocean on this one very large ship. You may be wondering what this has to do with trading. Just like the efficient container cargo ship, which uses standardized containers for very efficient and profitable shipment, so is our trading. If we can think of trading with many small fixed risk trades using a system with very defined and repeatable entry and exit rules and specific risk management rules, we will have more efficient and profitable trading in the long run.

One big problem that many traders (especially new traders) have is the constant desire to find the “perfect system”. This leads to continually moving from one system to another without ever really getting consistent results from any of them. There is no perfect system; it doesn’t exist, no matter what the ads say. When a trader stops looking for the “Holy Grail” and starts actually trading a good basic method with clear rules consistently, then that is when we can increase our chances to become successful, as opposed to constantly trying new systems and never letting one method work.

In addition to good entry and exit rules, risk management is a critical element of any successful trader’s system. With good risk management we are more likely to control the emotions that come with trading and put ourselves in a better position to be profitable. Like the many containers on the ship, many small trades spread our risk out, instead of putting too much money into fewer, larger positions, which may go against us and put our entire account at too much risk. Keeping our position sizes with only 1-2% risk per trade will keep our individual positions small and our risk at an acceptable level. By placing stop losses on each and every trade, we can limit the risk per trade. In addition to small position sizing, we should limit the total trades we have at any one time to 5 or so positions, which will never allow our total risk to exceed 10% at any one given time, even if all of the positions go against us all at once. We need to live with the possibility each time we trade that each trade could be a loser. Therefore, we need to be aware of the specific percentage risk we take with each position.

Just like the efficiency that the fixed size containers bring to the shipping industry, consistency using a specific method and using specific risk management rules is the key to successful trading. The trader that sticks to a specific set of rules has the best chance of success. Like the container ship, we too can reach the port of our choosing by having many trades with a small fixed risk which can add up to our total trading success. Remember, like most things in life, slow and steady is the winning formula.

Instant Options Income “in action”

Part 3 of my “Instant Options Income” video training was just published, and it reveals:


* A live recording where you get to see a credit spread traded on a broker platform, where “instant income” is automatically deposited into my account…

* 3 months of trade results using this approach so you can see the kind of potential that exists…

* How you can get started trading with this technique…

PLUS…

* The Instant Options Income program will be going “live” next Monday, June 17th, at 1pm Eastern (New York time).

See Video #3 for all the details.

This is going to be exciting.

Good Trading,
Bill Poulos

p.s. After you watch Video #3, make sure you get on the “Cut In Line” list below the video to maximize your chances of getting in on this program on Monday.

The “Options Optimizer” Method

Weekly Options Training Video #2 was just published! See it here…

In this training video, I reveal my 5-step “Options Optimizer” Method that you can use to find the very best stocks & ETFs for use with my “Credit Spread Strategy” I taught in my first video.

This is a simple step-by-step process you can follow every 7 days (on Thursday night after the market closes) to quickly drill down to get the highest probability and lowest risk stocks & ETFs…

This isn’t about finding long-term moves – it’s all about “zooming in” on what’s going to happen in the next 7 days so you can put my special 2-pronged option trade on, grab “instant income”, and then move on to the next trade.

It’s all about striking quickly with tactical precision.

Get the 5 steps here & implement them this Thursday…

Good Trading,
Bill Poulos

p.s. With this technique you only need to spend a few minutes ONCE PER WEEK managing your trades. My readers are telling me it’s one of the laziest and most clever ways to trade that they’ve seen in a long time.

The Feds Drug of Choice – Bond Buying

It has always been true, when it comes to the markets in general, that perception is reality. This has been evident in the markets over the past week or so, as much as any time in the past. When it seems as though there is an indication that the Fed will continue its $85 billion per month bond buying program to boost the economy, the market reacts favorably and continues to rise and when there is almost any indication at all that the Fed may slow down or discontinue the bond buying program the market gets jittery and retreats. This appears to be similar to the relationship between a drug dealer and an addict; if there is a hint that the supply may run out, the addict panics because their wellbeing is directly tied or even directly controlled by the dealer. In a way it sounds as though the Fed is dealing the bond buying crack that the market has been addicted to for the past few years. This also brings up a very obvious question, “How free is our “free market” capitalist system?”

Like anything else, the addiction will come to an end at some point and the end will be like the end of a lot of situations – it can either be done the easy way or it can be done the hard way. The Fed has stated that their intent is that when they scale back their economic stimulus, they are hoping that their buying will be replaced by other countries that step in to buy our debt. This may or may not happen, but the longer the addiction lasts, the more difficult the recovery will likely be once the support is pulled away.

The stock market in general has been moving upward in a relatively consistent way since the middle of November, 1012. There have been a few bumps along the way but I have noticed that what I find to be a little odd is the timing of the moves. The S&P began to rise on November 19, 2012; it moved up steadily and didn’t see much resistance until December 21, 2012. There was about a week where a pullback took place, which was followed by a nice rise until February 20, 2013. The rise was then followed by about a week where a pullback took place. The next bump in the road came a little early on April 12, 2013. Of course, this was followed by about a week where the market pulled back beginning another rise on April 21, 2013. Any thoughts on when the next pullback took place? Of course, it was on May 21, 2012. There were a few days where it appeared as though the market may bounce back, but, based on recent history, it really couldn’t advance at that point. Each pullback up until the May 21st pullback brought the market back to its 50-day simple moving average. If the recovery and resumption of the trend began too quickly in this case the market would not have retraced to the 50-day average; it needed a second deeper pullback to accomplish this. The bounce off of the 50 came the next week, which was June 6, 2013, and the market is up so far on June 7, 2013.

The S&P has advanced and retreated to its 50-day average 4 times since the turn around this past November. Is this is a result of the Fed stimulus or is it just a natural market phenomenon? Are they testing the water every month or two to see what would happen if they begin to lessen their support? Should we jump back in the market right now after what appears to be the most recent swing low and be cautious around June 21, 2013 to see if a pullback happens again or can we stay in until July 21, 2013? How many more cycles of advance and retreat can we count on to build our trading accounts? All of these questions will be answered within the next several weeks. But, regardless of what anyone wants to think or believe about market control, the cycles have been consistent and largely predictable.

Free “Instant Options Income” Trading Blueprint

Our first ever options training website just went live and it’s all about how recently, I stumbled upon a strange “flaw” around how most people trade options that led me to discover a simple technique that almost anyone can use to potentially:

* Earn up to 2% of your total account size every 7 days (the equivalent of 104% every year).

It all has to do with a special 2-part trade that automatically creates “instant income” that’s deposited into your trading account every time you place the trade.

Go here to download the step-by-step ‘blueprint’ that reveals how it’s done, and follow along with the training video.

I think you’ll be surprised.

Good Trading,
Bill Poulos

p.s. Your total time investment with this technique is less than 20 minutes PER WEEK, and you collect your “instant income” every Friday. See how to make your first trade here…

Range Bound Trading

As traders we would love to see the market always move in a deliberate fashion. Unfortunately, in the real world this does not always happen. This is what we are currently seeing in the Gold and Silver world. The movements we are seeing are very much bound within a tight range. When the price action becomes tight in its movements it can become difficult to know exactly when to enter or exit the trade. The main reason we see range bound price action is that the buyers and sellers are in battle as to which direction it should go.

As these area of support and resistance are developed they will cause the price to bounce in between them keeping the price within a specific range. Take a look at the 4 hour chart of Gold to see how this is currently happening.

In this example of gold you can see the range that is being created by the red resistance line and green support line. In this case the range is becoming tighter which should eventually lead to a breakout. As we look to trade a range bound market we need to take serious consideration to these support and resistance levels. One way to trade a market that is bound by support and resistance is to look to buy and sell on bounces off of these levels. Take a look at the chart below that shows how this might look.

This is the same 4 hour chart that is above but zoomed in so we can better see the support and resistance areas. Notice that in a range bound market we can look to sell when the price moves to the upper range near resistance and buy when the price moves to the lower support area. Buy identifying these area we can take advantage of a range bound market.

The other advantage of trading a range bound market is that we have a way to determine easily where to place our stops and targets. By using the resistance and support area we can place are stops and targets around them. In addition to trading between the upper and lower range we can look to take a trade when the price decides to break out of the range. As the price closes outside this area we would look to go long or short in the direction the break out occurred.

Take a look at the chart of Silver below to see how this might work.

Notice that as the price breaks out of the range you would have the opportunity to enter long or short. You would look to place the stop loss back in the range should it decide to move back again.

Currently we are seeing this range bound trading with both gold and silver and we should look to take advantage of this movement in our trading. This means we can look to trade both the move within the range and also the move out of the range. Take some time to review this current price action.

Identifying Flag Patterns to Trade Stocks, ETFs, and Forex

In recent weeks, I have been discussing technical trading using several different technical tools such as Moving Averages, Stochastics, ADX, etc. Today, I would like to discuss some price action patterns to help identify good entries. The first thing to do when looking at price action is to identify the trend. A trend in the markets can be a fickle thing; trends run, then fizzle, start and stop, continue and reverse. Once a trend forms is doesn’t go straight up or down, but will have retracements or pull backs. The very nature of supply and demand assures that there are natural levels of profit taking in most market moves. One of the most important elements of successful trading is identifying these “resting” points and if they are just “resting places” or are they actually a market reversal or a “change in direction.” This is where analysis of price action comes in. We can use certain price patterns based on this price action to help determine if these pull backs are possible setups for an entry.

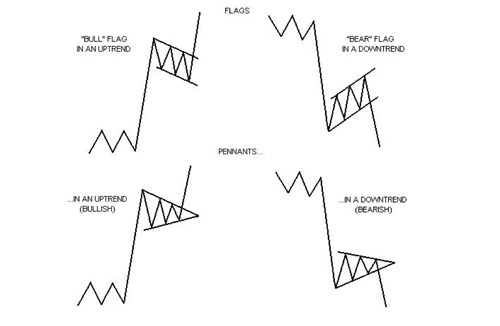
One type of price pattern we can use is a continuation pattern such as a Bull Flag or Bull Pennant for an uptrend continuation or Bear Flags and Bear Pennant for a downtrend continuation. These patterns help us to identify areas of continuation, looking at a pull back or a consolidation and resumption of current trend after the pull back. Here are some examples of what these continuation patterns look like:

Flags and pennants can be generally categorized as continuation patterns. These price patterns usually show brief pauses in a strong trend. They are usually seen right after a larger quick move. The market will often pick up again in the same direction. Over time these continuation price patterns are very good at identifying potential entry points.

Bull flags are characterized by lower tops and lower bottoms, with the pattern slanting against the trend. But unlike wedges of a Bull Pennant, their support and resistance lines run parallel.

Bear flags are comprised of higher tops and higher bottoms. “Bear” flags generally slope against a strong down sloping trend.

Pennants are similar to flags but are not parallel and look very much like symmetrical triangles. Pennants are also generally smaller in size or volatility and duration than Flag patterns.

Here is a recent example of a classic bull flag patterns in an Uptrend market for the SP-500:

Note in the graph above that after a move up, the Bull Flags are formed by the lower highs and lower lows, in a flag type patterns and once the price broke above the flag it resumed the bullish uptrend and continues the previous up trend for a very positive gain. The best way to take advantage of this pattern is to set a “buy stop” entry order close to the top of the pullback so that if the trend resumes to that level you would be triggered into the trade to take advantage of the continuation. The same patterns apply to down trends by forming “Bear Flags” in the reverse pattern and with a “sell stop” entry order.

Take some time to look for these Flag price patterns as a great way to identify entry points after they break out of the pullback.

Our Risk

One of the most important things we can learn when trading the forex market is that of risk management. There are many different types of risk when we trade including the amount we risk in a trade, our risk because of the market, and risk of mentally not being ready. With these risks there are things we can control and things we cannot control. We need to be sure we are controlling those things we can and not worry about the things we can’t. Because we cannot control or know exactly what the market will do, we will not worry about that. Today I want to focus on being able to control the amount we are willing to give to the market.

We have all heard the rule that we should never risk more than 2% of our account in a single trade. This is known as “maximum risk per trade”. What many traders forget is the word “maximum” which should indicate to us that we can risk less on our trades. If you are a new trader learning how to trade or an experience trader learning a new method, then you should consider risking less than the maximum amount. It is ok to take less risk. In fact, it is likely to help you control another risk we have and that is the risk of becoming too emotional in our trades. If we start by risking 1% instead of 2%, we are likely to be less concerned with the loss and can focus on following our exit rules.

Another aspect of our risk is to look at where we place our stop losses. Often times we will hear traders say they are placing a “tight” stop loss to lower the risk in the trade. They think that by placing a small amount of pips at risk that they are taking less risk. This is not the case and in fact may be detrimental to your trading. If we place our stop losses too close we run the risk of getting stopped out too soon. Many times traders will say that their stops get hit right before the price takes off and moves in the direction they anticipated. If this is the case, consider adjusting the stop to a more appropriate level. This way you can give the price action enough room to eventually move in your direction. Now this does not mean you will never get stopped out, just that you are giving it a bit more wiggle room.

The key is that we are not taking more risk by having a larger stop loss. We are increasing the probability that our trade will work out. If I decide to risk 1% of my account on a trade, then that 1% risked is going to be for a stop that is tight or a stop that is wide. It won’t matter where the stop is, the risk will still be 1%. Of course the size of the trade will be smaller as the stop increases but that is ok because we are increasing the probability of success.

Take some time to consider the amount you are risking in your trades to make sure you are at a comfortable level and take a look at your stop loss placement to make sure you are not placing them too close.

4 “Simple” Steps to Trading

Let me start with some simple suggestions that may help you be a better trader. But understand that just because some of these suggestions might be “simple” doesn’t necessarily mean they are “easy” to accomplish or implement. Sometimes the simplest things to discuss are the most difficult to implement because we are all creatures of habit. Sometimes we really need to force ourselves to do the simplest things (willpower). To me, the best way to make a change in habits is to write it down what we want to do and determine that we are going to do, whatever it is, for at least a 30-day period. One suggestion is to write it down on a 3×5 card and put it in a prominent place, in plain view, but a different place each day, so that it stays noticeable every day until it becomes a habit. Any time we want to change a behavior, we need to learn how it will help us (EDUCATION). The next thing would be to figure out a way to make this new behavior practical within our regular routine (DEVELOP A ROUTINE). The next thing is the follow-through by continuing to update or monitor the habit (KEEPING A LOG). Lastly and perhaps the most important thing you can do is to discuss or report to someone on your progress and to get further ideas and encouragement (REPORT TO A MENTOR). So if you are trying to improve your trading read and follow these 4 suggestions or steps:

  1. Educate yourself. First, we need to get the best and most accurate information and education concerning our trading, finding a simple easy to implement strategy for entries, exits, and risk management.
  2. Develop a specific trading routine. To implement a good trading routine, the best strategy is a simple strategy. The easier to implement the better.  Also, very important is that each trader, honestly evaluate his or her own risk tolerance. Then we need to develop risk management rules that will follow our risk tolerance. I suggest until we are comfortable with our own risk tolerance, we limit our risk to no more that 1% of our portfolio per position. We then need to determine a consistent daily trading routine whether it is trading a few minutes per evening, or more active day trading during the market. Once we make these determinations we should implement them consistently for at least 30 days or 1 month.
  3. Keep a trade journal. To successfully implement a strategy or new trading routine, we need to keep a trading log or journal and make it as specific as possible, by including trades, explanations for entering or exiting all positions, including all winners and losers alike.
  4. Report to a Mentor or Trading Partner. The last thing would be to find a mentor or another trader who you can share your trade journal with to get ideas and to hold yourself accountable to your routine and trading goals.

If we are not having the success in our trading that we are looking for, follow this simple framework with 4 very important steps that I have found to be essential to trading success…and success in other endeavors, as well.

The Shortcomings of Technical Indicators

Most traders use technical indicators to some degree when they are looking for good entry points and exit points into and out of the securities that they are trading. But, what makes specific indicators and specific price points important? It makes a lot of sense to use technical indicators because they can give us an idea of what the general direction of the market may be and of course the direction of the specific issue that is being traded. However there are shortcomings to using technical indicators. Understanding the good things that they provide is important but understanding some of their shortcomings is important as well.

All technical indicators are based on the price of the given issue which means that the price must occur before the indicators value can be established. By their very nature they are lagging indicators, they are using information that has already occurred. This of course doesn’t make them bad, it is just that we need to understand that the information that is used to determine them is information that already occurred. We typically cannot predict consistently and accurately what the forthcoming data will be for any specific issue. So using past data to formulate technical indicators to determine where the price may go is largely our only choice.

What is so special about some of the indicators that we constantly see referenced in reading material and that we hear about on the TV shows about trading and investing? Why is a 50 day moving average or a 200 day moving average so important or any other indicator that gets popularized?

The indicators themselves really have no specific importance or relevance on their own, the only reason that they are important is because traders and investors believe that they are important. Their importance is a self-fulfilling prophecy. Because traders and investors believe that these indicators are important they will use them as places to key off of in their trading by placing stops or entry orders at or near them. The simple fact that orders are placed at these points in the market makes them important. Basically they are important simply because traders believe that they are important.

This brings about the obvious conclusion that a lot of traders are looking at these specific indicators in much the same way. So if any given trader looks at them the same way everyone else does they will likely get the same or similar results when using them. This is like being part of a big team that is working together for a common goal. What I have learned about myself over the years is that I am not always a team player and I do not always work well with others. When I am trading I am not looking to be on the same team as everyone else. Often times I am looking to be on the opposing team. If I understand how the masses of traders and investors use specific indicators in their trading it’s a little like having the other team’s playbook. I don’t have to nor do I necessarily want to act and trade like everyone else and as long as I understand where they believe that the important price levels are on a chart for a given security I pretty much know what they are going to do. This can allow me to take advantage of the information being detached and evaluating what they are doing to determine what I can do to profit from the thought process of the hive mentality that exists.

The point is, to understand how the masses are using the most common indicators and figure out a way to use those same indicators in way that most people don’t use them. You can put yourself in a great position to make money simply by understanding what everyone else is likely to do and doing something a little different.