Moving Average Types

One of the most common indicators used in trading is the Moving Average. There are many different types of this indicator and that is what we are going to be discussing today. In general, this indicator is one that can be applied to many different situations. It can help you know if the average price is moving up or down, which defines the trend. It can be used to show areas of support and resistance. It can also be used to look for potential entry and exit points. Knowing how to use this indicator can be a valuable tool in your ability to see what is happening on the charts and where you might want to enter or exit a trade. But before we can know how to apply these things we need to determine which type of indicator we will be using.

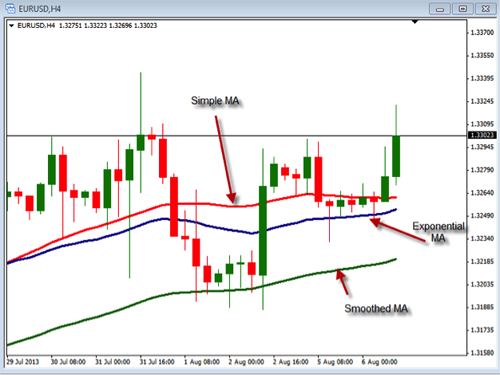
Because moving averages are one of the most common indicators, there have been many different versions of them created. Some of the more common moving average types include the Simple moving average, the Exponential moving average, the Weighted moving average, the Smoothed moving average, the Linear moving average and the Hull moving average. Knowing which one you will use can help you simplify your trading. Just like any indicator, you want to keep it simple so you will likely only use one type in your evaluation of your charts. Using all or multiple types of moving averages can just make things more complicated. So with that in mind we will compare three of these moving averages. We will look at the simple, the exponential and the smoothed to see how they differ on the charts. We will not look at the calculations of these, just how they look compared to each other. 

In the chart above you will see 3 lines which represent the 3 different moving averages. Each of these are set at the period of 40 based on the closed price. You can see that there are some major differences in how they look. This is due to the calculations for each type. The simple moving average is just taking the closing price of the last 40 candles, adding them together then dividing that by 40. This will create the red line seen in this chart. The others take a variation of that to come up with their lines. The key is not to know which one is best but to know how to use the one you choose the best. It really doesn’t matter if you use one or the other as long as you can use it in helping you determine when to enter and exit your trades based on your rules.

So, regardless of how you use the Moving Average you have several options to choose from. This valuable indicator can be an asset to you in your trading as well as how you evaluate your charts. Take some time to look at the various types of Moving Averages as well as the different time periods you can use to see which ones can help you the most.
How Can You Identify the Trend?

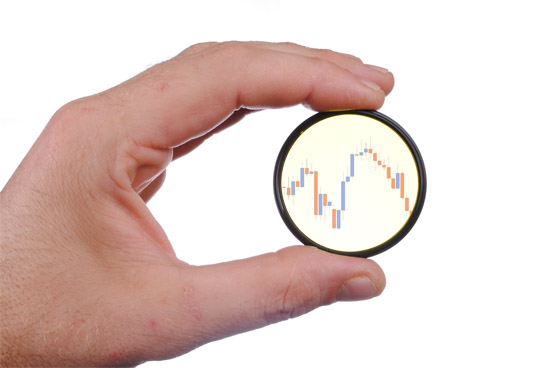
Everybody who has been around the markets for very long has heard the phrase: “The trend is your friend.” This is a true statement because trading with the trend may be easier to execute and a lot more forgiving if your entry is not perfectly timed. One of the most important things a trader can do is to determine the trend, whether Bullish (uptrend) or Bearish (downtrend).

First of all, determining the trend (either up down) is the key to successful trend trading. The trend is generally divided into three different classifications: long-term (weeks to months), medium-term (days to weeks), and short-term (hours to days). There is also very short-term (minutes to hours), but this is generally reserved to very short term traders or scalpers, which I won’t really cover today.

What is a trend? Generally, the trend is defined as the price moving higher in a Bullish Market and downward price movement in a Bearish Market.

How to Determine a Bullish Market or Uptrend

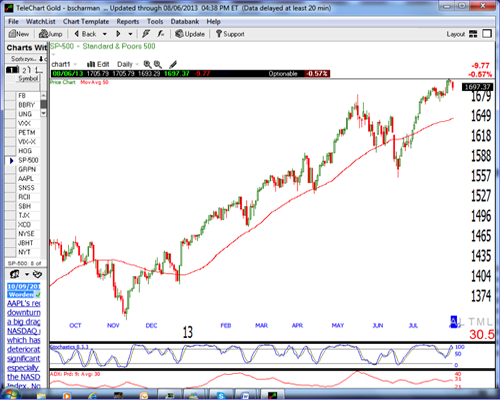
A bull market, or a bullish trend, as defined above as the price action moving higher by connecting higher highs and higher lows is associated with increasing investor confidence, and increased investing in anticipation of future price increases. A bullish trend in the stock market often begins before the general economy shows clear signs of recovery. For an example of a bull market, we can look at the current price action on the Standard and Poor’s market index below and can easily identify the current trend as “bullish” as determined by the higher highs and higher lows as the price action has been moving higher. Note: As with any trend, the price does not just move higher, but moving up and then down and then back up again and this price movement is what we string together to identify a general direction of the market. Also note that in a strong uptrend over the last several months, the price is generally above the 50 period simple moving average and the 50 period simple moving average is also moving up at the same time. These conditions make for an easy way to identify or confirm a bullish trend.

How to Determine a Bearish Market or Downtrend

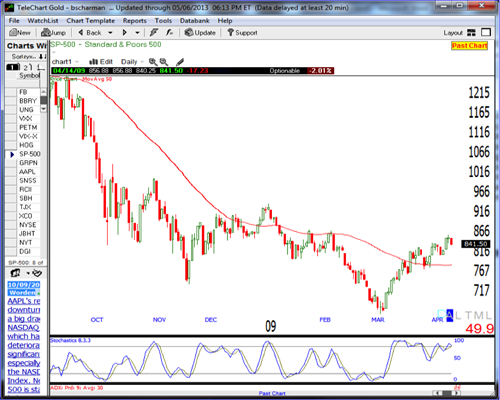
A bear market, or a bearish trend, is a general decline in the stock market in general or a specific stock with lower highs and lower lows over a period of time, depending on the length of the trend. A bearish market is generally associated with a transition from high investor optimism to widespread investor fear and pessimism. In addition to the price action moving lower, you can also notice if the price action is moving below the 50 period simple moving average and the moving average is moving lower as well is a good indication that we have a bearish trend. Note in the Chart of the Standard and Poor’s index daily chart from late 2008 to early 2009 below to see how to identify periods with a bearish trend.

In conclusion, trend trading is one of the easiest and best methods to trade. So being able to determine a confirmed bullish or bearish trend could greatly improve our success. Practice looking at different market charts and determining whether it is in a confirmed bullish trend, confirmed bearish trend, or neither.

Understanding ETFs

One of the hottest forms of trading is trading Exchange Traded Funds (ETF). But just what is an ETF? Simply put, an ETF is a fund that trades indexes or specific sectors. Some of the most common forms of these indexes are the S&P 500, Dow Jones Industrial Average, and NASDAQ Composite and some of the most common sectors are, bonds, metals and commodities. ETFs are most analogous to mutual funds in the respect that they are comprised of a portfolio of stocks but they move more similarly to stocks and can be traded like stocks.

An index is a grouping of stocks that is used as a gauge of performance for the group as whole. Market sectors can be as broad as metals and bonds as mentioned above or as narrow as technology, healthcare or specific asset types. The selected stocks are grouped together with the group’s statistics representing their aggregate value.

ETFs are priced and traded continuously throughout the trading day; therefore, they hold a significant advantage in the flexibility that they offer over mutual funds. When trading ETFs we can buy them, sell them short, hold them as long term investments or trade them regularly as we would trade individual stocks. Part of an ETFs value is based on an underlying index which means that we can take advantage of the diversification that goes with investing in entire markets, sectors, regions, or asset types. Because they represent groupings of stocks, ETFs, especially those based on major indexes, will typically trade at much higher volumes than individual stocks. Higher trading volume means higher liquidity which enables investors to get into and out of investment positions relatively easily and with minimal expense.

The main difference between ETFs and other types of index funds is that ETFs don’t try to outperform their corresponding index but simply replicate its performance. Because an ETF tracks an index without trying to outperform it, there are less administrative costs than portfolios that are actively managed. Typical ETFs administrative costs are lower than an actively managed fund and are typically less than .20% per year. This is in a stark contrast to some mutual funds that can have a 1% yearly cost. Because they incur low management and sponsor fees and because they don’t typically carry high sales loads, there are fewer recurring costs to diminish your returns.

As always, no matter what you trade, remember to always follow your trading methods and work your plan. Always set a routine, follow proper risk management, and keep emotions out of your trading.

Three Habits That Lead to Trading Success

People are always looking for the perfect system of trading. However, I suggest that successful trading has less to do with the system a trader uses and more to do with a consistent application of good trading habits. In fact, there are many good systems that a trader can use depending on what type of trader you are – long term, short term, etc. A few important key elements, if incorporated into our trading routines, can make all the difference between being an effective and successful trader, or being unsuccessful and quitting out of frustration. If we can start to be successful by implementing the following habits, then that success can build on itself. In the world of money and investing, we call this ‘compounding’.

Here are three keys that, if you develop into your trading plan, will help your trading to become more effective and more profitable:

1.   Use Strict Risk Management

Risk a maximum of 1-2% per trade. The reason is simple – at some point in time, it is a statistical possibility that you could have 5-10 losers in a row. It might not be this month or year, but, over a 10-year period of time, you could have 10 losing trades in a row. If you risked 5% per trade, you would be down 50%. To make that up, you would then have double your account or make 100%. Risking only 1-2% puts you at a 10-20% loss with 10 losers in a row. That type of loss can be made back in 1-3 good trades. Always use, an initial stop loss order that reduces your initial exposure to the 1-2% max loss. Once the trade moves in your favor, you can move your initial stop loss to breakeven and effectively reduce your risk on that trade to zero. You can then use a trailing stop to protect profits as the trade moves in your favor.

2.   Use Proper Position Sizing

There is more to money management than just using stops or not having too many trades on at once. Those are only the basics. Professional traders do all that, but also use position sizing. Let me reiterate that you should always trade with a stop loss in place to limit your losses. Most people use a percentage risk stop and that is usually not the best level to place your stop. The best stops loss levels are based on the chart using a recent significant high or low level. If you use only a percentage, you may place your stop too tight or too wide for the current market conditions.

3.   Always Trade With the Trend

Trading with the trend is actually simpler and so much easier than other strategies. Generally speaking, simpler is also easier to implement and easier to follow. The key is to have a system that just goes for the middle of the trend. The reason is because, again, it’s hard to pick the top and bottom (impossible to do on a consistent basis). The key is to follow the market, not force the market. Traders must to be patient with what the market gives us and it is important to not try to “make things happen,” which is the surest way to failure and frustration. Use a system that identifies and follows the trend so that you can “jump on that trend and ride it”. Trying to trade against the trend may cause you to overtrade and potentially lose when the trend “catches up” with you.

These three simple habits are not difficult to understand, but are sometimes difficult to implement. If they are consistently followed and implemented into your trading routine and trading plan, they can give you a much higher probability of success and lead to a much lower stress higher probability to trading success.

This Week in Silver

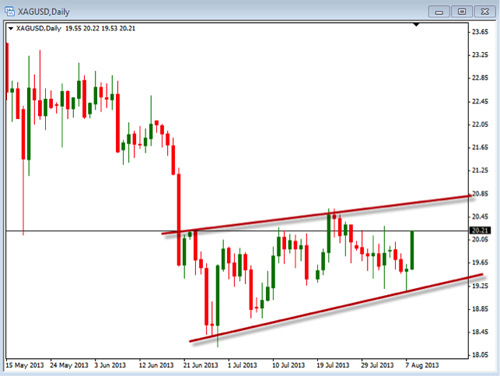
Today we are going to take a look at what has been happening with Silver over the last few months. We will start by looking at the longer term charts, then move down to the lower time frames to see what is happening. So to begin we will look at the daily charts.

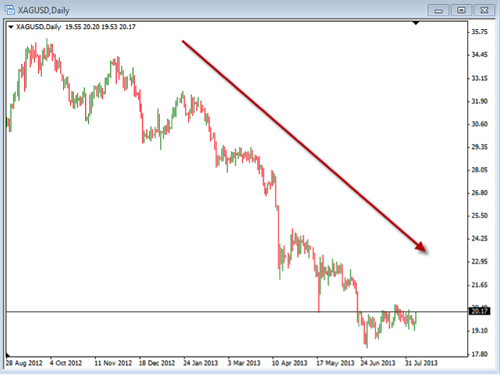
One of the first things we want to do when analyzing a chart is to determine the overall direction or momentum that the price is moving. This daily silver chart is fairly easy to identify this direction as it has been moving in a strong downward direction. Currently both gold and silver have been moving to the down side so we can quickly see this trend. Once the trend is identified we can then get an idea if we should be buying or selling. After the trend is determined we can determine where the current levels of support and resistance is located. In the chart below it is zoomed in so we can see where these are located.

In looking for the support and resistance levels we want to see there the price may have a hard time moving beyond in order to know where the price may stop moving. As we look for trading opportunities we want to see that we are buying in an uptrend and selling in a downtrend. In addition, when the trend is up we want to buy near support and in a downtrend we want to short near resistance. By looking at these daily charts we can see where the price is in relation to these so we know if we are looking to buy or sell.

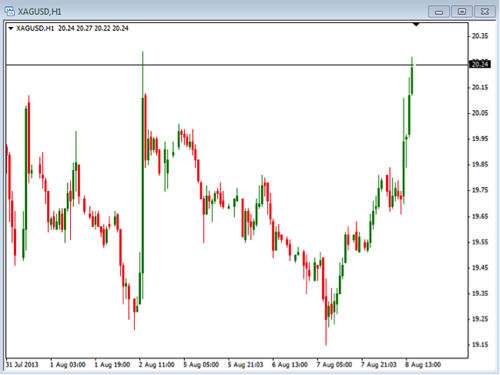
Currently, we are in a downtrend and the price is moving back up to an area of resistance. Now we can go down to the lower time periods to look of refining our entries. Take a look at the 1 hour chart below.

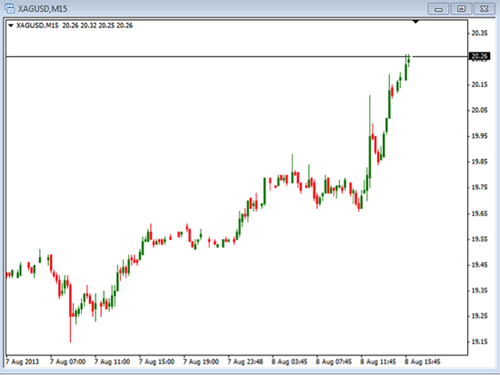
On the hourly chart you can see that the price is moving back up towards resistance. At this point we would look for the price to begin to move back in the direction of the longer term daily trend. As the price moves down we can look enter a short trade on an even shorter time frame. Take a look at the chart below which is the 15 min. chart of silver.

This chart really shows the current movement on silver. This is the move up towards resistance that we saw on the hourly chart. Because the daily chart is trending down and the hourly chart is moving near resistance we will look for the price to begin to move down on the 15 min. chart to identify a short entry. This entry trigger could be any number of indicators or strategies but the important point is to realize we are trading in the correct direction as indicated by the longer trends.

Take some time to review your process for finding the longer term direction so you know you are always trading with the trend. As far as trading silver, we would look to continue trading in the down direction along with the daily charts.

Using Flag Price Patterns to Help Identify Entries

I am a big believer of the importance of trading with the trend. However, a trend in the markets can be very fickle; they go on runs then fizzle, start and stop, or continue and reverse. Once a trend forms it won’t go straight up or down, but will have areas of retracement or pull back. The very nature of the market forces of supply and demand assures that there are natural levels of profit taking in most market moves. One of the most important elements of successful trading is identifying these pullbacks and to understand if they are just “resting places” or are they are actually a market reversal or a “change in direction.” This is where analysis of the price action comes in. We can use certain price patterns based on this price action to help determine if these pull backs are possible setups for an entry.

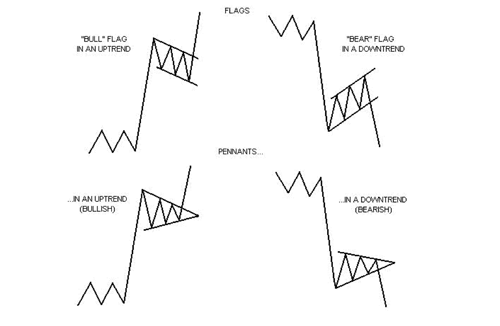
One type of price pattern we can use is a continuation pattern such as a Bull Flag or Bull Pennant for an uptrend market or Bear Flags and Bear Pennant for a downtrend market. These patterns help us to identify areas of continuation, looking at a pull back or a consolidation and resumption of previous trend after the pull back. Here are some examples of what these continuation patterns look like:


Flags and pennants can be generally categorized as continuation patterns. These price patterns usually show brief pauses in a strong trend. They are usually seen right after a larger, quick move. The market will often pick up again in the same direction. Over time, these continuation price patterns are very good at identifying potential entry points.

Bull flags are characterized by lower tops and lower bottoms, with the pattern slanting against the trend. But unlike wedges of a Bull Pennant, their support and resistance lines run parallel.

Bear flags are comprised of higher tops and higher bottoms. Bear flags generally slope against a strong down sloping trend.

Pennants are similar to flags but are not parallel and look very much like symmetrical triangles. Pennants are also generally smaller in size or volatility and duration than flag patterns.

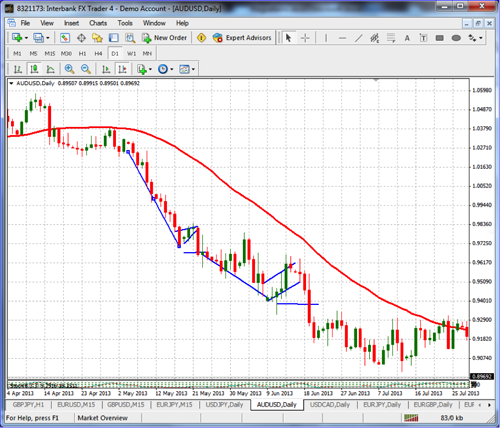
Here is a recent example of a bear pennant and a bear flag in a downtrend market for the AUDUSD daily chart:

Note in the graph above that after a move down, the Bear Pennant is formed by the higher highs and higher lows in a triangle pattern and once it broke below the pennant it resumed the bearish downtrend and then a Bear Flag formed by more parallel higher highs and higher lows running against the downtrend, and once the pullback is “broken” the price breaks out and continues the previous down trend for a very positive gain. The best way to take advantage of this pattern is to set a “sell stop” entry order close to the bottom of the pullback so that if the trend resumes to that level you would be triggered into the trade to take advantage of the continuation. The same patterns apply to a bullish uptrend but in the reverse pattern and with a “buy stop” entry order.

Take some time on the charts to look for these Flags and Pennant price patterns to help identify entry points after they break out of a pullback.

Instant Options Income

Our Instant Options Income program is a premium options trading advisory service which reveals precise “weekly options” trade recommendations.

As a member, you learn our step-by-step credit spread strategy which gives you the potential to make every Friday like an extra “pay day” because money is actually DEPOSITED into your account every time this special type of options trade gets filled.

Then, we show you the safest and most lucrative ways to protect that money by minimizing risk and giving all your trades the room they need to move in your favor.

This is one of the easiest ways to trade options we’ve ever seen.


FOMC

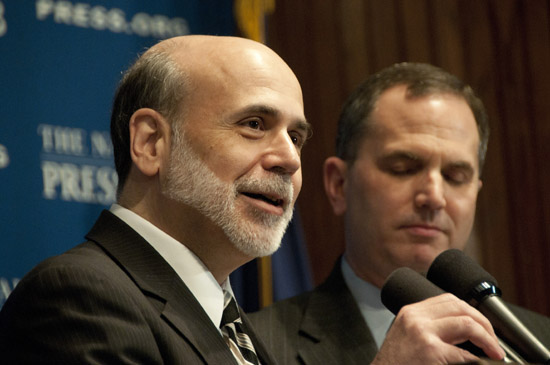
Today we are going to talk a bit about the FOMC, which stands for the Federal Open Market Committee. This is an organization that is part of the Federal Reserve System better known as “The Fed”. The goal of the FOMC is to help control the nation’s open market operation. A lot of what they do deals with buying and selling of US treasuries as well as deciding upon key interest rates and regulating the money supply in the US. These things can have direct impact on the short and long-term interest rates, credit and the amount of money in the market as well as the foreign exchange rates. It will also impact the general and overall economy.

The FOMC is made up of twelve members. Seven of the members are the Board of Governors of the Federal Reserve System. Another is the president of the Federal Reserve Bank of New York, while the other four are from the rest of the Reserve Banks presidents who serve for one year on a rotating schedule.

The current members of the FOMC are as follows:

Ben S. Bernanke – Chairman of the Board of Governors

William C. Dudley – Vice Chairman from New York

Along with: James Bullard, Elizabeth A. Duke, Charles L. Evans, Esther L. George, Jerome H. Powell, Sarah Bloom Raskin, Eric S. Rosengren, Jeremy C. Stein, Daniel K. Tarullo and Janet L. Yellen.

In addition, there are five alternate members.

As members of the FOMC, they will meet on a regular basis to discuss and review the economic and financial situation happening in the market as well as determine and discuss appropriate moves for monetary policy to assure price stability and economic growth.

This year the FOMC will meet eight times. They met in January, March, April/May, June and, most recently, this past week in July. The other meetings will be September 17-18, October 29-30 and December 17-18.

The FOMC meetings are important for many of the reasons we already mentioned, plus we need to be aware of the times they are meeting because it can cause major movement and increased volatility in our trading of the currency market. We need to make sure we are aware of the days and the times the FOMC statements will be released.

You can look at the charts of the currency pairs to see how the market will move after the release. If you look at what happened during this last release you will notice the uncertainty in the movements and the non-deliberate action that took place. We do not know how this will affect the market but we do need to be prepared for the possibility that there can be big moves.

In order to avoid the negative aspect of volatility we can do one of two things. First, we can simply avoid trading during these times. This will keep us totally protected against any negative movements. Second, we can cut our risk down. This means if we are usually trading 2% risk on our trades, we should cut it down to 1% or some fraction of our normal risk level.

Regardless of what we do with our trading, we need to be aware of what the FOMC is doing and what we need to do to protect our trading. Take some time to review this to make sure you are prepared the next time the release their statement.

When Do We Avoid Trading?

Knowing when not to trade is often times just as important as knowing when to trade. By paying attention to what is going on in the world around you through the current events of the day, and also by paying attention to the market itself you can generally get the feel for when it is a good idea to stay on the sidelines and not enter the market, versus when it may make sense to enter. The eight times each year when the Fed makes their interest rate announcements and presents the minutes to their meetings are an obvious time to be very cautious. One of the main reasons that traders look at the rest of the economic data throughout any given month is to help them to determine what the Fed may do with short-term interest rates. Over the past few years the Fed has kept the rates at nearly zero, they really didn’t have much choice around this but each time an announcement is made traders hold their breath just waiting to the see if the Fed will give them a glimpse of what may happen in the future.

If the tone of the Fed message is dovish or more negative the markets can react wildly seeing big selloffs that can extend for several days in the equity markets and other asset classes that are considered to be of a higher risk. When the Fed statement is more hawkish or positive the market can take off on a rally that could last for an extended period of time. If you have ever had a question as to when it may make sense to be in the market and when it may make sense to be out of the market being out of the market around this time is usually not a bad choice.

The impact of an announcement on any type of security will typically be more severe when the position taken is shorter term in nature. If you are day trading stocks or the currency pairs with a very short time horizon the content of any announcement could have a severe impact on your position. The impact can of course be either positive or negative but it seems that it may make a certain amount of sense to be cautious and simply not trade around that time. If you are trading with a longer time horizon the impact of most announcements are likely to be short lived. Unless they are very dramatic you often times cannot even detect when the event occurred when looking at a longer term chart however some announcements can be strong enough to change the direction of the price action of an individual stock or currency pair well into the future so you may want to pay attention to the announcements while still knowing there is typically a remote chance of a longer term effect.

Just as government economic news can regularly impact the currency market company announcements can affect the prices of their stocks in a similar way. If a company’s announced earnings are good but just not quite as good as what analyst had predicted the company’s stock price can take a dramatic turn just as if the company beats the earnings predictions their stock price is likely to rise. The funny thing about all of this is that many of the moves that we see take place in any individual stock or currency pair can be attributed to an analyst’s or an economist’s prediction. There are predictions about company earnings and company dividends well before they are announced and there are predictions about unemployment and interest rates and many other economic factors that can affect the currency pairs but what’s interesting to me is that the impact that the actual announcements will have on the pricing of any security is a direct function of how wrong the analyst is that is making the prediction. When we see a large move in a security that is based on an announcement the move does have something to do with the actual information that is being announced but most of the reaction is a correction that takes place to the pricing based on an analyst’s incorrect prediction.

Any time an announcement is going to be made that could affect the price of a specific security or securities at large it is a good idea to stay in cash and wait until the effects of the announcement pass. Much of the effect is due to the disparity between the incorrect predictions from analysts and what the actual information is, we cannot control how poor analysts are at predicting what may happen or what the reaction by traders to their incompetence is but we can control what we do. We know that analysts are going to continue to predict and we know they are going to continue to be wrong and we know that the markets will make corrections when the actual announcements are made to compensate for the errors. Since we already know all of this why not avoid all of the drama and only trade during quieter times in the markets when the analysts’ predictions aren’t impacting much of anything, if we do this it will make things much easier for us.

Bounce Type Trades

There are many different strategies to trade the forex market and many different time periods to trade those various strategies. We can also trade by scalping, swing trading or position trading, to name a few. With all the various combinations of ways to trade it can sometime become confusing to determine exactly what to do. Today I want to discuss one way that can be used to trade the forex market. This type of strategy can be used on pretty much any time frame. Plus, it is a fairly simple and understandable way to place a trade.

The type of trade I am referring to is the bounce trade. This trading strategy uses some of the most important aspects of trading. It uses price action, trends, support and resistance and indicators to determine when and where to enter a trade. In addition, this type of trade can be used on the 1 min. chart all the way up to the monthly charts. Because we are using the trend and the support or resistance areas to enter a trade, this is considered a trend trade. The idea is to find the direction or trend the price has been moving and then look for a good time to enter the trade as it begins to move in that direction. In order to do this we need to see some type of pull back or counter trend move with the price action. Here are the steps we will use to determine if a trade setup has occurred.

  1. Determine the trend. Look at the chart to see the general direction that the price has been moving. You can use a moving average or you can draw a trend line to help better visualize this if you like.
  2. Find support or resistance. If the trend is up, we will want to identify the support area and if the trend is down we will want to look for resistance. These are the areas that we will want to look for buying or selling entries.
  3. Look for a pull back. Because we want to enter at a good time in the direction of the trend we will look to see the price action move counter to the trend. I the trend is up we will look to see the price move back down towards the support and if the trend I down we will look to see the price move back up towards the resistance area.
  4. See a trigger. The trigger is used to tell us exactly when to get in. A trigger can be an indicator like the stochastic indicator. If we are using this we might look for the stochastic line to change direction back towards the trend. So, if we are looking to buy because the trend is up and we have pulled back to support, we could say we have a trigger if the stochastic line is below 20 then closes pointing back up.

This is the basics of trading a bounce trade. Look for the trend, then look for the price to bounce back in the direction of the trend after a pull back. You can use any indicator to help you find the trigger. Take some time to review this to see if it might help you identify some trading opportunities.