The Fed and You?

The much-anticipated FOMC Economic Projections, the FOMC Statement, and the Federal Funds rate will all be announced within the next few days. My opinion is that the question that should be on any trader’s mind is “How does this affect me?” I don’t generally consider myself to be a self-centered person, but, the fact is, how the Fed’s upcoming comments and decisions affects the world at large, the US, or any specific portion of either of them, is really inconsequential; the effect is merely secondary to the effect that it will have on your personal portfolio. Since the only things that you can control in this scenario are the decisions that you make relative to your trading portfolio, now would be a really good time to make some of those decisions.

A few weeks ago, I took a short position relative to the S&P 500. I was able to get a small bump in price but basically I broke even as the downtrend I was looking and hoping for did not materialize. The price action made a double bottom divergent move and turned up, so, of course, I have been long the S&P 500 for a week and a half. The good news for me is that the market has followed through on the move; to an extent, it has continued on an upward trend though it has not exactly rocketed upwards. The dilemma for me now, which is the same dilemma that faces all traders, is what to do about all of the potential market reaction that will occur when the Fed presents their material later in the week.

This is not a unique situation in the respect that the Fed makes announcements on a fairy regular basis throughout the year. So the decisions around what to do about it do come up, but what is a little different this time is the anticipation about when the Fed will begin to reduce their economic stimulus. The fact that the economy has been stimulated by the Fed is no secret, nor is the fact that, because of it, the economy and the stock market, along with other markets are artificially high to some degree. In spite of all of this, the question still remains, “How does this affect me?” I know that I bought into a market that is being propped up and I also know it won’t last forever, but what I don’t know is when it will end.

Investors in many markets will state that they make their money on the buy, meaning how cheaply they had gotten into the investment, but this is not as true in the equity markets. It is to the extent that the better price you can get on any investment, the more money you are likely to make. But in the equity markets, much of the money is made on the management and the exit of the open positions. Buy low, sell high is a really easy thing to say but it is typically far less easy to do. The management of investments in other markets is often times much more straight forward than it would be in the equity markets and the exit can be much more predictable. The equity markets have world events and the attitudes and beliefs of people from all over the world, along with their personal relationships with money that are factored into the market, while buying most hard assets cheaply and then reselling them is comparatively simple. The actual end selling price is often times relatively easy to predict and will not deviate much during the life of the investment, but this is not always something that can be said relative to the equity markets.

I believe that it is usually best to approach potentially major market movers like the coming Fed action by using a somewhat defensive tact. I will keep my long position open as long as nothing happens to deter me from doing so. But, just like I am I not married to my open long position, I am definitely not opposed to taking advantage of a potential profit producing situation if I see a way to take advantage of one. In situations like this, listening to anyone but yourself can be harmful since the so-called ‘experts’ are so wrong about the results of events like this with such regularity; it really does come down to you and what decisions you as an individual will make with regard to your personal portfolio. If an entry method in the equity markets is even a decent one, the entry will often times take care of itself. But how you manage and exit a position can be the determining factor with regard to how much of a profit you make or if you make a profit at all.

Down Goes Gold

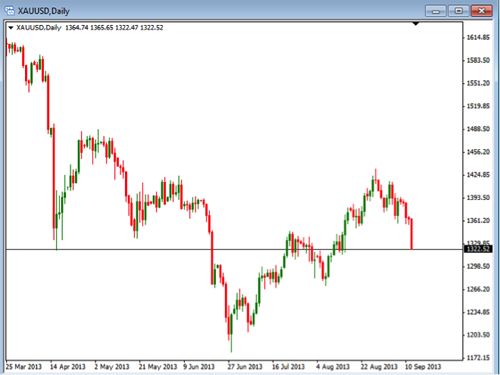
Today we are going to talk about what is happening with gold from a technical stand point. As we all know, gold had a huge drop back in late 2012, which ended towards the end of June this year. Gold went from a high of nearly 1800 down to just below 1200. This was a fairly dramatic move down, especially when everyone at that time was saying to buy gold. Since the low, we have seen a nice move back up over the last couple of months to reach a recent high of around 1440. Then in the last couple of days, we have seen a sharp drop from these most recent highs to end today around 1322. So the question is this, will the price of gold continue to drop or is this just a minor correction in the overall recovery from the lows? I would love to give you the answer, but, frankly, who really knows? With the events over in Syria, along with the overall global financial issues, we really don’t know what might occur to cause the price of gold to move back up or head back down. Time will only tell.

What we can do is to take a look at what the charts are currently telling us. When looking at charts there are many things we can see the price of gold possibly doing. There are an infinite amount of possible things that could happen. As traders, we need to not focus on what could happen but recognize what is happening on the charts that might be able to help us.

In the chart above, there are some things that we should be pointing out that might help us. The first thing is to identify the current trend or momentum of the chart. In this case, the current movement is bearish or, in other words, the price in moving down. In addition, the price is currently sitting near an area of resistance. Notice the horizontal line going back to April of this year. Whenever we see price sitting at an area of support we need to consider two things. First, will it bounce at the level and move higher and second will it break through this area and begin to move lower. Each move will be handled differently in our trading. If it bounces up off support we can look for an area to enter into a long position. If it breaks through we will want to look for opportunities to short gold. We shouldn’t really care what is going to happen as long as we are prepared to take the correct action for the price movement that does occur.

So, it really doesn’t matter what we thing might happen, what matters is that we are prepared for what does happen. Currently, Gold is at one of those tipping points where it will be making a decision soon as to what way it will move. Take some time to watch the chart and be prepared to trade it in the appropriate direction.

If You Want Long-Term Success, Manage Risk!

In these days of uncertain markets, the key to keeping our sanity and keep out accounts from blowing up is MANAGING RISK. Risk management is always important, but it is even more critical when the markets are unsettled as they have been recently. Risk management is also a way to control an individual trader’s tendency to trade out of fear or greed. For example, consider the investor who may have, on the feeling that the new stock was going to “skyrocket to the moon” (Facebook comes to mind?), allocated a large portion of their account on that “sure thing”. No matter what the new stock does in the future, we should never allocate too much of our account on any one position because we have to understand that there really is no “sure thing”! I remember when everybody, who was anybody, had to have a Blackberry device, until the “iPhone” came along, that is.

The most important key to successful trading truly is risk management. How could risk management be more important than the method or the system you use to trade? If these are questions you are asking yourself, then ask this one as well – even if you have a good system that works very well, most of the time, what system removes all market risk? The answer is NONE; there is no such system. Since such a system does not exist, the only way to be successful in the long run is to manage the risk we take with each and every trade. Said another way, the very best of systems can only put the probabilities in our favor or minimize losses, but not eliminate them. With each trade we take we should be able at know how much of our account is at risk if the market moves against us due to anything that we could not predict.

My first rule is of risk management is to always use a stop loss. Nobody likes to take a loss, and I am no different; however, by managing my risk per trade, I adhere to the “slow and steady wins the race” theory of investing. And never go for the “home run” trade because there are no “sure” deals in life, only the possibility of success if we manage our risk and, therefore, protect our trading accounts

My second rule is to manage your risk is to manage your position sizes. As traders we should never get into a position where we are risking too much of our account on just a couple of trades. Instead, we should follow the 1% (2% maximum) rule or only risking 1% of our account on any one specific trade, limit the total number of trades to a maximum of 10, or 10% total risk at any one time, and use proper stop loss and trailing stop orders when we get into trades. If you will follow these two rules, you will be able to sleep at night a whole lot better knowing that we will never be in a “bet the farm” type of position.

REMEMBER: The real key to success is Risk Management, not the next “hot” IPO.

Uncertain Times

There are times when the market becomes even more uncertain than what we would normally anticipate. This is certainly true with the conflict currently happening over in Syria. The markets generally like to have certainty in order to have the deliberate movements that we like to see. When there is uncertainty in the market, the markets will tend to become more volatile in their moves. These volatile moves can become very difficult to anticipate and trade. So what is it that we can do to help mitigate some of the possible effects of an uncertain market? Today we will discuss some of the things we can do to keep our risk in control.

The first thing we should do is analyze how much risk we are willing to take in our trades. This should be something we have already done with our trading. The general rule is to not risk more than 2% of our account on any one single trade during deliberate market conditions. If the market is likely to become non-deliberate and more volatile we need to consider reducing that amount.

Generally there are a few things we can do to help control risk during these times. Take a look at these few suggestions.

  1. Stop trading: This would be on the extreme conservative side of things, which is ok if you are not sure what you want to do. In the situation with potential military conflict like we are seeing with Syria it might be wise to see what things develop before taking trades. As the uncertainty leaves the situation we can then begin to trade again. It is likely that this uncertainty will resolve in a relative short time period.
  2. Lower risk: This would be the next most conservative thing to do. Instead of risking your normal 2% maximum risk you could lower the amount of risk to something like 1%. This would allow you to continue to trade but keep you in a less risky situation. This is what most traders will do during times of unrest.
  3. Fewer trades: This would allow you to continue trading but allow you to focus on only those that may be stronger in their setups. Trading less is always a good thing to consider when the markets become more volatiles.

As you know, risk control is one of the key components of trading successfully. Since we cannot control the markets or political unrest we need to focus on those things that we can control. Things like money management and position sizing are things we are able to control. If we do not make adjustments during the times where the market is more volatile, we run the risk of taking bigger and more frequent losses because of it.

Take some time during the uncertainty we are seeing with Syria to develop a plan for how you will approach the market during these times. You can use it to help you in your trading currently, as well as how you will act during future unrest.

Why Do Traders Care About The Non-Farm Payroll Report?

The Non-Farm Payroll Report, a monthly employment report, gives the market an idea of the strength of the U.S. Labor Market. The NFP report, as it is commonly called, is generally released on the first Friday of each month, which was Friday September 6th.

The non-farm payroll employment number is the statistic released monthly by the United States Department of Labor as part of a comprehensive report on the state of the labor market. It is a report that covers the employment numbers for goods-producing, construction and manufacturing companies for the previous month. Typically, the Bureau of Labor Statistics releases the report at 8:30 a.m. Eastern Time on the first Friday of each month and covers the numbers for the previous month. The U.S. Non-Farm Payroll number is an important factor that can affect the U.S. dollar, the foreign exchange market, the bond market, and the stock market.

The data released also includes the change in non-farm payrolls (NFP), as compared to the previous month. The NFP number is meant to represent the number of jobs added or lost in the economy over the last month, not including jobs relating to the farming industry.

In general, increases in employment means both that businesses are hiring, which means they are growing and that those newly employed people have money to spend on goods and services, further fueling growth. The opposite of this is true for decreases in employment.

While the overall number of jobs added or lost in the economy is obviously an important indicator of what the current economic situation is, the report also includes several other pieces of data that can move financial markets:

  • The unemployment rate – The unemployment rate in the economy is reported as a percentage of the overall workforce. This is an important part of the report as the amount of people out of work is a good indication of the overall health of the economy. This is a critical number that is used by the Fed when determining any action that might be needed in the economy.
  • Which sectors the increase or decrease in jobs came from – This can give traders a heads up on which sectors of the economy may be primed for growth as companies in those sectors such as housing add jobs.
  • Average hourly earnings – This is an important component to know because if the same number of people are employed but are earning more or less money for that work, this has basically the same effect as if people had been added or subtracted from the labor force.
  • Revisions of previous month’s data – An important component of the report which can move markets as traders re-price growth expectations based on the revision to the previous number.

In summary, employment in the economy is one of the most watched economic indicators because employment drives every aspect of the economy. If the NFP comes out better or worse than expected, the markets can really react, and this month there may be more emphasis on the release as the Fed is looking to use this statistic as an indication to help determine further action on “QE3 Tapering”.

Did you watch the release of the NFP report last Friday morning? How did it affect the market?

Trading in Your Self-Directed IRA

Individual Retirement Accounts, IRAs, are a type of retirement account that are set up and controlled by the person that establishes them. They must be set up through a third-party administrator, which is something that many IRA participants don’t understand is happening and don’t even see. The third-party administrator is a company that has third-party administrator status from the IRS. This allows the administrator to set up and maintain IRA accounts for individuals. The reason that many people do not know that this is part of the IRA process is because the bank, investment company, insurance company or brokerage company that they have opened an IRA account with has third-party administrator status, so the only company that they will see or know about is the company that they opened the account with. The investment choices that are available to the IRA are typically limited to the investment choices that the administrator has available, which could be a specific family of mutual funds or a specific line of insurance products. If you have an IRA and you look at the way your IRA account is registered, it will typically have the name of the administrator in the account registration, which may or may not be the actual company that the account was set up with. Companies that do not have third-party administrator status with the IRS will hire an administrator to administer retirement accounts for them.

The way IRAs are set up is slightly different than a company sponsored retirement plan, such as a 401k, whose investment choices are controlled by the administrator and the sponsoring company of the retirement plan; the employer itself will rarely be the administrator of the retirement plan. The administrator will typically be introduced to the employees as the company that was hired to administer the retirement plan and the employees are encouraged to place part of their before tax dollars in the plan with the administrator. Most 401k plans have a variety of investment choices but they are typically choices of different types of mutual funds that are either invested directly into the fund or into a fund that is designed to mimic the performance of a mutual fund or index but all of the choices are dictated by the employer and/or the administrator.

There are companies that are set up that have third-party IRA administrator status from the IRS that allow individuals to set up IRA accounts directly with them, whereby the individual controls the investment choices that are made in the IRA directing the administrator to make investments on their behalf; this type of an account is called a Self-Directed IRA. Self-Directed IRAs can be very useful for more creative investors that are interested in making money in less traditional ways such as with real estate or trading in various equity markets like the Forex market. Many Forex brokers are not third-party administrators. So, although they advertise that you can trade in the Forex market in your IRA account, when you trade through them, you must set up a Self-Directed IRA first and then instruct the administrator to set up a Forex trading account within the IRA on your behalf. Some brokers have the ability to allow their clients to trade in the stock market and the Forex market, but most brokers do not have third-party administrator status for more than one market. This means that though you may have an IRA account set up with a broker for stock trading, you may still need to take the extra step to trade in the Forex market in your IRA through that same broker by setting up a Self-Directed IRA.

Being creative in an IRA and trading in the Forex market or in other non-traditional retirement markets may be a good way and, in some cases, the only way that many people will be able to retire. People that do not have a company pension to look forward to may not be able to save enough over their working lives to support themselves during their retirement years, so earning a superior return on existing dollars may be their only choice. Being a little aggressive with part of your retirement dollars may be the difference between retiring and not retiring. So managing part of your retirement account in a less traditional way may be something to consider.

Syria and Stops

With all the uncertainty surrounding the issues in Syria, today we are going to talk about the importance of using stop-losses in all our trades. Stop-losses are used by professional traders to protect our trading capital. If we don’t use stop-losses, we have the potential to take large losses. We want to avoid this in every trade we take.

Now that we know a stop-loss is used to help protect our money and something that professional traders use, we need to define exactly what a stop-loss is. A stop-loss is a tool that is use to limit the amount you are willing to loose with any trade you enter. The stop-loss is set at a point where you would not anticipate the price moving to, based off of your current entry signal. If the price moves to this area you would want to exit the trade with the stop-loss and incur your pre-determined loss amount. Even though we do not like to take losses, it is important that you take them to protect the rest of your account. Holding on to a losing position can become very costly.

There are several things to look for when trying to decide where to place a stop-loss. Take a look at these things to see if they can help you better identify where to place your stop-loss.

  1. Look at the Support or Resistance areas. The stop-loss should be place below the support level for a buy and above the resistance level for a sell. You will want to use prior highs and lows to determine where these areas are located.
  1. Look at trend lines. Trend lines, like support and resistance, can give a good visual as to where to place the stop-losses in both an uptrend and down tend. You will place a stop below the trend line in an uptrend and above the trend line in a down trend.
  1. Moving Averages. You can use a Moving Average to help you know where to place your stops in both an up and down trend. These moving averages will act similar to what is happening with the trend line and support and resistance.

Regardless of how you determine where to place a stop-loss, the most important thing is to actually have one. Too many traders, both new and old, do not use a stop-loss, which can cause them to be placed in a large amount of risk. This risk can cause the account to take huge losses if the stop in not used. The goal is to keep our risk at appropriate levels and using a stop-loss can help you be consistent with that. This is especially true during times when the market is uncertain. Take some time to review your rules for placing your stops. Take a look at how well you identify areas of support and resistance, how well you draw trend lines and finally, how moving averages may be able to help you place your stops in a better area.

3 Important Habits to Trading Success

People are always looking for the “Holy Grail” of trading and generally only focus on finding a great system. I contend, however, that success has less to do with the system a trader uses and more to do with the implementation and consistent application of good trading habits. In fact, there are many good systems that a trader can use depending on what type of trader you are, long-term, short-term, etc. (remember, no perfect system exists). A few important key elements, if incorporated into our trading routines, can make all the difference between being an effective and successful trader, or being a failure and quitting after all our money is gone or simple quitting out of frustration. If we can start to be successful by implementing the following habits then that success can build on itself. In the world of money and investing we call this compounding. Here are 3 keys that if you develop into your trading plan, will help your trading to become more effective and more profitable:

  1. Use Strict Risk Management: Only risk 1-2% per trade. The reason is simple; at some point in time it is a statistical possibility that you could have 5-10 losers in a row. It might not be this month or year, but over a 10 year period of time you could have 10 losing trades in a row. If you risked 5% per trade you would be down 50%. To make that up you would then have to make 100%. Risking only 1-2% puts you at a 10-20% loss with 10 losers in a row. That type of loss can be made back in 1-3 good trades. Always use an initial stop loss order that reduces your initial exposure to the 1-2% max loss. Once the trade moves in your favor you can move your initial stop loss to your entry point or break-even point and effectively reduce your risk on that trade to zero. You can then use a trailing stop to start to protect profits as the trade move more in your favor.
  1. Use proper position sizing: There is more to money management than just using stops or not having too many trades on at once. Those are only the basics. Professional traders do all that, but also use position sizing. Let me reiterate that you should always trade with a stop loss in place to limit your losses. Most people use a percentage risk stop and that is usually not the best level to place your stop. The best stops loss levels are based on the chart using a recent significant high or low level. If you only use only a percentage you may place your stop to tight or to wide for the current market conditions. With the correct stop in place you can then calculate the proper position size for your trade. That is the best way to keep your risk per trade at the proper 1-2% risk level.
  1. Trade with the trend: Trading with the trend is actually simpler and so much easier than other strategies. Generally speaking, simpler is also easier to implement and easier to follow. The key is to have a system that just goes for the middle of the trend. The reason is because; again it’s hard to pick the top and bottom (impossible to do on a consistent basis). The key is to follow the market not force the market. Traders must to be patient with what the market gives us and it is important to not try to “make things happen,” which is the surest way to failure and frustration. Use a system that identifies and follows the trend so that you can “jump on that trend and ride it. Trying to trade against the trend may cause you to overtrade and potentially lose when the trend “catches up” with you.

These 3 simple keys are not complex or difficult to understand, but are sometimes difficult to implement. If they are consistently followed and implemented into your trading routine and trading plan, they can give you a much higher probability of success and lead to a much lower stress higher probability to trading success.

What’s Up With Gold?

Today we will take a look at what is currently going on with the daily chart of gold. It is important when looking at any chart to be able to identify certain important elements. Those things we want to identify are the trend and where support or resistance is located. Once we identify these things, we can get a better idea of where and when we might want to look at entering into a position.

When taking a trade we will want to follow these basic rules. First, we want to be buying if the trend is up and shorting if the trend is down. This is why we want to identify the general direction and trend that is happening on the charts. Next we want to find where support and resistance is located so we can be buying near support and shorting near resistance. So putting these together we will be buying in an up trend near support and shorting in a down trend near resistance.

With that in mind, take a look at this chart:

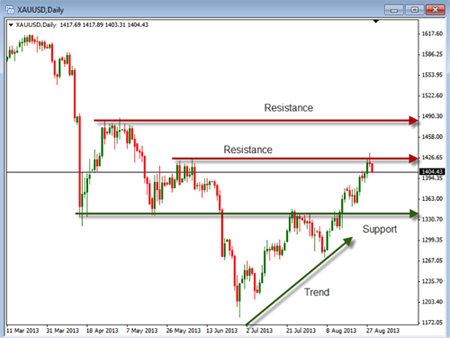
As you can see, gold has been a nice move up over the last couple of months. This is not uncommon after a big move down. So, as we look at the trend with the chart of gold we can see that it has been making higher highs and higher lows during this time. This means we would be looking to take long positions by buying gold. The next thing we want to look for is where there is support and resistance. Support is the area where we would be looking to enter the trade but currently we see that we are near a level of resistance. This would suggest that the price might be wanting to move down from this current price. Once it pulls back we would look to enter into the long trade. Until then we would either go down to a short time frame and look for other entries or wait until until the price pulls back to support.

In addition to our regular volatility we are seeing in the market we need to take into considerate the issues happening over in Syria. Anytime there are potential miliary actions going to happen, the markets get a bit uncertain. This uncertainty can lead to very volatile moves. Not only does this volatility happen in the market in general but can dramatically effect the gold and metals markets.

So, in order to help minimize the uncertain effect over the next couple of weeks, make sure you re-evealuate the amount of risk you are willing to take during these uncertain times. What this means is that you need to decide if you are going to trade at all and if you do how much you will be risking. A good guide to follow is to cut your regular risk in half. This means if you normally risk 2% on each trade you should cut it down to 1%. That way our are taking into consideration the possiblility of more this increase in risk. Take some time to review this and make sure you are preparde for the unknow.

What is the “Fear Index”?

The last few weeks we have seen quite a bit of volatility in the market due to several mixed events in the economy and global events. For example, the market has been trading at all time highs, then the much discussed “tapering” of the Fed’s Stimulus QE3 program happened and now the uncertainly of potential conflict and instability in the Middle East comes along leading to more fear in the market. How can we quantify or measure this uncertainty?

That is where the VIX index comes in, often referred to as the “fear index”. Let’s take a look at how the VIX is constructed and how investors can use it to evaluate the U.S. equity markets.

VIX is the ticker symbol for the Chicago Board Options Exchange Market Volatility Index, and is a popular measure of the implied volatility of the S&P 500 index. The VIX also represents one measure of the market’s expectation of stock market volatility.

How did the VIX come to be? The first VIX, introduced by the CBOE in 1993, was a weighted measure of the implied volatility of eight S&P 100 at-the-money put and call options. Ten years later, it expanded to use options based on a broader index, the S&P 500, which allows for a more accurate view of investors’ expectations on future market volatility. Higher VIX values are generally associated with a large amount of volatility as a result of investor fear or uncertainty, while lower values generally correspond to less stressful, even complacent, times in the markets.

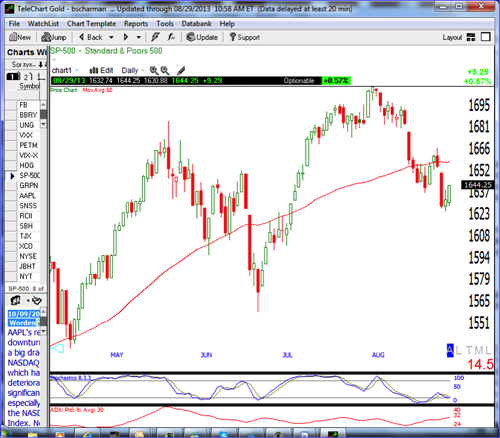
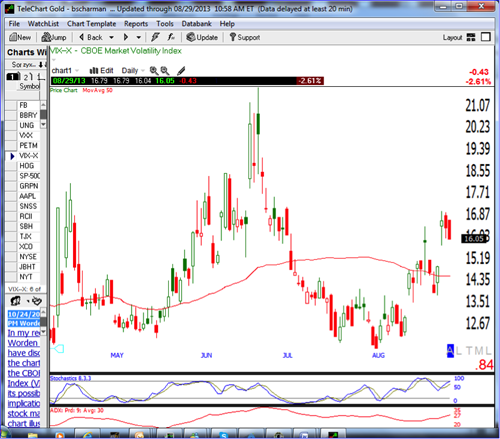
During periods of market turmoil or uncertainty, the VIX often spikes higher because there is a panic demand for OEX Puts as a hedge against further declines in the overall stock market. During more bullish periods, there is less fear and, therefore, less need for stock investors and portfolio managers to purchase puts. This is why, as stated above the VIX is often referred to the “fear index” or sometimes the “fear gauge” because at times when the index rises because of market volatility increases, the market tends to be in more of a panic and often the panic leads to a market sell-off. Conversely, during times when the market is calmer either ranging, or a steady trend the VIX is lower as the volatility is lower. This inverse relationship in the market is illustrated by the graphs in Figures 1 and 2 below.

Figure 1: S&P Index Chart

 Figure 2: VIX Volatility Index

Notice that as the VIX spikes up in June 2013 and the S&P index moved lower, but as soon as the VIX index calms down the market went back up to new highs. One saying about the VIX that investors will hear in relation to the overall market is this: “When the VIX is high, be ready to buy. When the VIX is low, look out below!” this is illustrated in the charts above, generally speaking when the markets are in a panic, the VIX is high. After this selloff or panic is over, the market is generally moved down and is in a good place to rebound or move higher.

So understanding the emotions in the market or what is often referred to as market sentiment is very important and using the VIX index is a valuable tool for investors looking for some clarity about the market direction.