Observe and React

One thing that I have generally believed is that emotions in most business situations are usually a waste of time, counterproductive and often times hurtful. I’m finally going to amend this belief based on recent events and long-term observations to state that it is very productive to observe the emotions of other traders when looking to enter the markets and in determining its general direction. There are some very predictable things that occur in the price action of the market at certain times, which include overreaction to current events. Of course the current event I am referring to right now is the need to increase the US debt ceiling to avoid a default and credit downgrade, the real impact of a credit downgrade may be overstated but that a different topic.

The likelihood that our congress, as incompetent as they may be, would let the US default on its debt obligations is in my mind incredibly unlikely. But even though I have believed all along that this event is incredibly unlikely I still believe that it is essential to pay attention to what everyone else believes. Leading up to the debt ceiling deadline since the high in the middle of September the S&P 500 was either down or flat until the second week of October. During this time there was banter and talk and threats from both political parties that our government would shut down and then once it was shut down how long would it last. The negative impact on the market throughout this time was not difficult to see or to predict which would have been good opportunity to short the S&P 500.

Once the Government was finally shut down the talk then shifted to what they can do to get it opened back up. To add to the situation, the debt ceiling needed to be raised so of course both sides are posturing in a very positional way. This is all very good and from a trading stand point because the closer the time gets to the debt deadline the more likely it is that the situation will be resolved which translates from a trading standpoint into close out your S&P 500 short and consider going long. Even if you didn’t participate in the short the pullback made it so obvious that the market would rise again there was almost no reason not to take a long S&P 500 position. The average gapped up after the swing low but even if you did not participate in the gap it seemed as though there had to be a lot more room left for long positions to continue.

Sure enough right on queue as both political parties talk about how a US debt default would be devastating to the country and the world at large the long position proved it did have a lot more room to move and it did exactly that based on the belief that the situation would get resolved. The date of this writing is 10/16 so I do not know how all of this will play out, but I do know that my long is in the money by about 2.5% over the past few days. There is a deal in the Senate, so it just needs to be fully agreed to in the Senate, then by the House, and then sent to the President by the end of the day today.

Liquidating anytime now or tomorrow would provide a pretty nice and relatively safe few day return which is pretty healthy when annualized. The point is that things like this come up on a fairly regular basis throughout the year where the mood of traders and investors is easy to observe and to capitalize on. What I actually think of a situation like this is not important all that is important is what I observe others believe which is what makes the market move. I do not need to have an opinion I just need to read the opinion that the market is reflecting and act accordingly. In a lot of situations if all you do is observe the general mood of the country and current events they will tell you which way the stock market is likely to go, all you need to do at that point is follow it.

Technical Indicators: Relative Strength Index

What is the Relative Strength Index indicator? The Relative Strength Index (RSI) is a technical indicator used on many technical charts. It is used to indicate the current and historical strength or weakness of stocks, forex, options.

The RSI is an indicator in the family of technical oscillators, measuring the velocity and magnitude of price movements in a range. The RSI computes momentum as the ratio of higher closes to lower closes: stocks which have had more positive changes have a higher RSI than stocks which have had more negative changes.

The RSI is most typically used on a 14 day timeframe, measured on a scale from 0 to 100, with high and low levels marked at 70 and 30, percent levels. Shorter or longer timeframes maybe used for alternately shorter or longer outlooks.

The relative strength index was developed by Wells Wilder and published in the 1970’s. Since its introduction, it has become It has become one of the most used technical oscillators.

Wilder said, that when price moves up very rapidly, at some point it is considered overbought. Likewise, when price falls very rapidly, at some point it is considered oversold, in either case, a reaction or reversal imminent.

The level of the RSI is a measure of the stock’s recent trading strength. The slope of the RSI is directly proportional to the velocity of a change in the trend. The distance traveled by the RSI is proportional to the magnitude of the move.

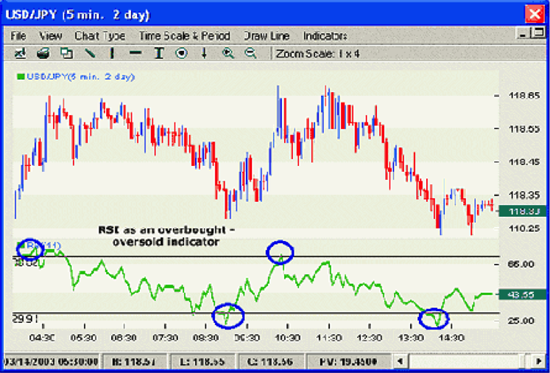
The RSI shows that tops and bottoms are often reached when RSI goes above 70 or drops below 30. Usually, RSI readings that are greater than the 70 level are considered to be in overbought territory, and RSI readings lower than the 30 level are considered to be in oversold territory. In between the 30 and 70 level is considered neutral, with the 50 level a sign of no trend.

Note the oversold and overbought areas as indicated on the forex chart below: 

Wilder also noted that chart formations and areas of support and resistance could sometimes be more easily seen on the RSI indicator than on the price chart. The center line for the relative strength index is 50, which in an indication that there is no momentum at that point.

If the relative strength index is below 50, it generally means that the stock’s losses are greater than the gains. When the relative strength index is above 50, it generally means that the gains are greater than the losses.

Last time, I discussed how we can use stochastics to identify areas of divergence. Well, the RSI indicator, because it is also an oscillator, can be used to indicate potential divergence between the RSI indicator and price action, which is a very strong indication that a market reversal may be setting up. Bearish divergence occurs when price makes a new high, but the RSI makes a lower high, thus failing to confirm. Bullish divergence occurs when price makes a new low but RSI makes a higher low.

Where Will Gold Go?

This week we are still dealing with the issues revolving around the shutdown of the US government, debt ceiling and a new Fed chairman appointment. This continues to place an amount of uncertainty in the overall markets, which is causing additional volatility all around. Gold seems to be especially affected by this uncertainty and something that we need to be aware of when we look to trade gold. With that being said, today we will look at some possible things that might happen with gold in the near future.

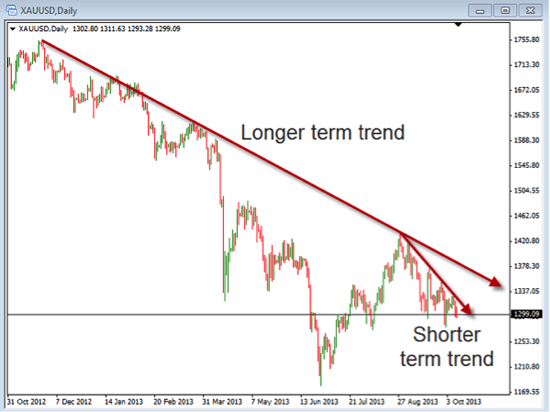
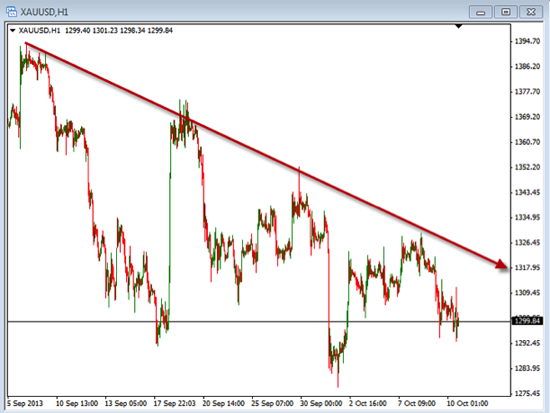
The first thing that we want to identify is the direction of the price action or the trend that gold is moving in. This is generally the first thing we will analyze when looking at a chart. We will also want to look at the various time frames to determine the overall momentum happening. Today we will look at two time frames, first the daily chart and second the hourly chart.

In this daily chart of gold you can see two lines, the longer-term trend line and the shorter-term trend line. As we analyze a chart we can often time identify several trends. As these trends are seen we can get a better idea of where the price may be moving. Currently, we are seeing both of these trends moving down so we would anticipate a continuation of the down move. As we drop down to the hourly time frame next, we can see confirmation of this momentum.

Here you can see at close the downward price action that we also saw on the daily charts. Notice how the highs are moving lower and lower, this is a clear indication that the trend is down. Until we see some evidence on the charts that price is moving up, our bias on gold will remain bearish. If we decided to trade on a shorter time frame like the 5 min. charts, the trend could look completely different.

In addition to looking at the trend, you will want to find the areas that are acting as support and resistance. These areas will often times be the first clue to knowing a trend is changing. Should our current down trend break above the area of resistance, as shown with these down arrow lines, we would have some evidence that the price action is ready to reverse. These support and resistance reversal areas can be tricky because these are also the points where the price will bounce back in the direction of the overall trend. Make sure you have a true breakout so you don’t get faked out in thinking a reversal is happening.

As far as taking trades on gold, we need to remain cautious as the market can cause dramatic moves on a day-by-day basis. This non-deliberate movement needs to be approached with caution and smaller risked trades. Take some time to look at the trend and resistance to look for possible entry points to short or go long on a reversal.

Technical Indicators: Stochastics Oscillator and Divergence

The Stochastics Oscillator Indicator is one of the common indicators used in technical analysis. What are Stochastics and how are they used?

Dr. George Lane in the 1950’s promoted the Stochastics oscillator. Today, Stochastics are used for technical analysis in most markets including Stocks, Options, and Forex.

The Stochastic Oscillator is a technical oscillator, measuring the magnitude and momentum of price movements. The momentum is the rate of the rise or fall in price. The Stochastic indicator is measured on a scale from 0 to 100, with high and low (overbought and oversold) levels marked generally at 80 and 20, percent levels.

The Stochastics indicator has been referred to as a ”leading indicator” since it can identify a change in momentum, even before they appear in pricing behavior which may indicates a potential change in direction of the trend or what we refer to as divergence. Traders also use the indicator to determine overbought and oversold conditions by identifying the tops and bottoms of price cycles in the markets, especially on short term charts.

The stochastic indicator shows the location of the closing price relative to the recent high-low range. While the stochastic indicator is helpful in identifying overbought and oversold levels, the primary use for which George Lane created this indicator was for spotting bullish and bearish divergences. Using Stochastics I will show you that momentum often shifts before price does, and spotting these instances can be a great method for entering your stock or Forex trades.

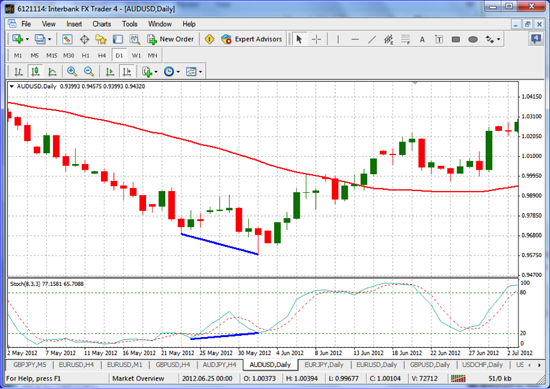
The premise is that when a new high or low in a security occurs but is not confirmed by the stochastic indicator, it indicates a potential trend reversal. For example, bullish divergence occurs when price makes a LOWER low, but the stochastic indicator makes a HIGHER low. This shows that the downside momentum is slowing, even though prices are continuing to make new lows, and a trend reversal may be imminent.

Notice in the AUD/USD daily chart below the bullish divergence as the price action had continued lower at the same time the Stochastic indicator has started to move higher indicating a potential change in the price movement or trend before the price action shows any real sign of a reversal. Note the change in trend direction immediately after the bullish divergence is indicated.

BULLISH DIVERGENCE

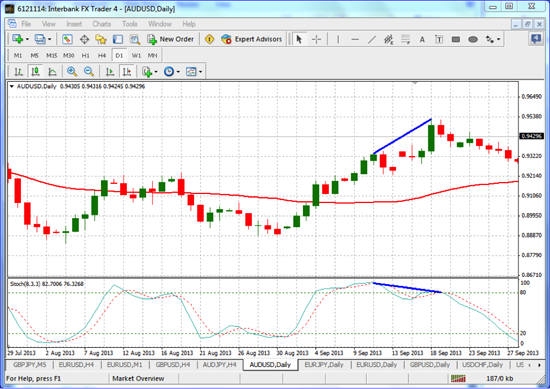
Bearish divergence is simply the opposite of Bullish divergence and occurs when prices make new HIGHER highs, at the same time the stochastic indicator is making LOWER highs. Notice in the AUD/USD daily chart below, the stochastic indicator is making lower highs at the same time the price action is setting higher highs. This is considered Bearish divergence, which could be used to indicate a possible move lower.

BEARISH DIVERGENCE

While many traders use Stochastics to identify overbought and oversold areas, and identifying entries and exits using the crosses of the %K and %D; however, divergences to me is the most powerful use of Stochastics. I have heard people say: “A good divergence signal is as good as gold.” So take some time to look for these divergences signals.

Government Shutdown

In today’s article we are going to discuss a bit about the shutdown of the U.S. Government. Now before you stop reading, we are not going to discuss the political side of it or the economic impact that it is having, rather we are going to discuss how something like this can impact our own personal trading.

It is unfortunate that many people have been put out of work for the time being and that the National parks have been closed, but as we look at how this situation has affected us as traders, we need to look at how it is changing the movements of the forex market. This is where the government shutdown is affecting us as traders.

We have discussed and seen in the past how “uncertain” situations will cause the movement in the markets to become a bit more volatile. Volatility is an interesting topic when it comes to trading because, when it comes down to it, we need a certain amount of volatility to be part of the market. There is good volatility and bad volatility; we need to know which is which.

Good volatility is what we call “deliberate” movements. The market is not perfect, but it is consistent in how it moves, without extreme moves. When the volatility becomes bad we generally see a couple of things happen, first the market becomes very wide in the movements causing price to jump to the extremes. The second thing that can happen is we begin to see the market move in a very flat range where there is very little moves. The other situation is that we see both happen where the market will move very flat, then all of a sudden, because of some news, we see a large move to the up or down side, only to be followed by more flatness. This over reaction is what we are seeing a lot of in today’s movements.

The problems that we run into with these types of trading conditions come generally because we are not prepared and have not made any changes to our trading. We need to make changes that will allow us to take the current market conditions into consideration and continue to trade. This often revolves around lowering our risk in the market. If we don’t prepare ourselves for the uncertainty in the market, we leave ourselves open to taking bigger losses than we need to. Make sure you are prepared for what the market may do.

It would be nice to say the market will get back to a more deliberate moving market soon, but the truth is, we don’t know what will happen next. The market may experience periods of smoothness, but for the near future we need to recognize that there is likely to be continued volatility. Take some time to use this government shutdown time to review what you are doing to prepare yourself for volatile trading that is likely to continue. Being prepared will allow you to continue to trade and take profits out of the market regardless of the type of volatility we are seeing.

More Uncertain Times

Today we are going to discuss the topic of trading during uncertain times. It seems that currently the only thing we are certain about is the fact that things are uncertain. With the issues surrounding government shutdowns, debt issues and Syria we are dealing with things that can cause a large amount of volatility in our trading.

This type of uncertainty can make our trading more difficult as it causes us to take on a bit more risk because things can move quickly. This increased trading risk is different than our position risk where we can limit the amount we are trading. As you know, we suggest risking no more than 2% on any single trade. This means that if we get stopped out you would only lose a maximum amount of 2%.

While this is a good suggestion during times when the market is a bit more stable, when we are dealing with increased volatility we are advised to lower the amount we are risking. In this case we may decide to drop our maximum risk from 2% down to 1%. This way we can continue to trade but with a lower amount of risk.

Let’s take a look at an example of how this might work. Assuming that we have an account size of $10,000, we can show how this would change the risk by lowering our position risk.

Now in this case we are assuming we are using mini lots on the EUR/USD, which has a value of $1 per pip. You can replace your account size and the amount of risk you are willing to take to determine your position size. You would simply need to know the amount of pips you are risking in your trade. Remember, that pairs that end with the USD have a pip value of $1 for a mini lot but pairs that don’t end with USD have a different pip value. You can find out from your broker the current value of these pairs.

The key with uncertain times to understand that there is an increase in market risk. This increase in market risk causes us to have the possibility of taking faster losses as the volatility move the market. In order to reduce the effects of this uncertainty we can determine the amount we allow the market to have. By lowering our position size through the process of reducing our maximum risk, we can take back some of the control we have when trading. This may seem like a simple thing to do, which it is, but often times it is hard for us to change how we do things.

Take some time to consider how you can improve your trading during uncertain times by looking to reduce the amount you are risking in your trades.

Government-Induced Trading

With the advent of the most recent Washington debacle I realized that the U.S. government provides us with one of the best possible reasons to trade in the equity markets that I can think of. Through their inefficiency and inability to cooperate with each other, they can render some people powerless to maintain a stable work life, which translates to an unstable income situation or cash flow. If they can have that much power over those of us that work for the government, regardless of if they intend to hurt people or not, it seems to me that there is the potential for a real problem. If they can shut down the U.S. government simply because both sides want to be right, imagine how much havoc they could cause if they really wanted to.

The result of their petty bickering is that there are, literally, hundreds of thousands of government employees that are off work, through no fault or desire of their own, and they may or may not be able to recapture the lost pay from their time off. This is a good example of just how reliant working people really are on their employers, all working people, not just government employees. This specific situation is just another reminder of how fragile our jobs and our ability to earn a steady income can be. It once again reminds me of how important it is to have multiple lines of income and preferably income from a source that is not dependent upon other people. My opinion is that this is possibly the best reason to be a trader in the equity markets. When we are trading successfully we are self-reliant, we are making our own decisions based on the information that is available to us at the time making the best possible choice or decision given the current circumstances. We are in control of our own situation and, if we are good enough traders, we can largely determine how much we earn and when we earn it, so the craziness in Washington or anywhere else becomes a non-issue. If it is an issue, it is an issue only to the extent that we need to adjust what we do based on what the markets perceive the situation to be. When it comes to the markets, perception is reality and the truth is what traders at large believe it to be.

One can make the argument that traders are just as affected by outside sources as anyone else due to direct market manipulation or a myriad of other ways that securities prices can be artificially determined. Traders need to acknowledge that there is market manipulation by individuals, companies and the government, but this shouldn’t be a problem as long as we recognize that it exits and we do our best to allow for it in our trading plan. Market manipulation obviously exists, which is clearly exhibited by the strength of the stock market, which is largely due to the Feds Quantitative Easing and incredibly low interest rates, which, arguably, result in the most blatant form of market manipulation in our history.

Many people still believe that their most important asset is their largest asset, which is usually a home, a car, or a boat, but their most important asset is actually their ability to earn income. If people lose the ability to earn money, their economic life blood is cut off, since many people today do not have a lot of money saved it is a potential problem just waiting to happen. The way I see it, one of the best, and most obvious, ways to counteract any potential for personal economic disaster from an employer that goes out of business, puts people on unwanted furloughs, or any number of things that can disrupt an employee’s cash flow is to learn to trade and learn to trade right now.

Traders are independent people that make their own decisions living with the good ones, as well as the bad ones, but regardless what the outcome of a decision is, at least it is at the trader’s own decision. Supplementing income or building long term wealth with trading income can only lead to good things. We do not need to be victims of a company or a government by letting them control our ability to earn a living; we need to take control of our economic lives by trading consistently profitably, regardless of what the economic situation is or of any other obstacle that may present itself.

This Week in Gold

The last 5 days in gold trading we have seen some fairly large movements happen. One day it was down $40 and the next back up $25. With these types of movements we need to use caution in our day-by-day trading. As we look at trading gold, we need to be careful with the shorter-term charts as they can become very choppy in how they move. This type of volatility is primarily due to the inability of the government to come to an agreement on getting the government back to work. As with any uncertainty, we generally see markets become more volatile in how they move. What is uncertain now is not when the shutdown will happen (because it already has), but when it will end. In addition, once they get the government funded again, they will be dealing with the issue of the debt ceiling. This is likely to be another drawn out affair as congress tries to come up with some agreement.

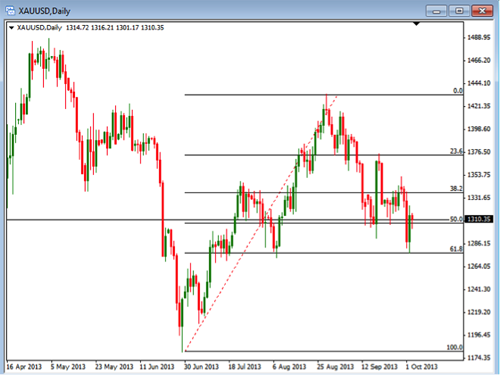
Regardless of the side you come down on politically, the fact is we have to deal with the actual effect it is having on the markets. Gold will likely continue to see some increased volatility until some of these issues have been resolved. With that being said, let’s take a look at the current daily chart of Gold with some Fibonacci Retracement lines drawn on them. We spoke last time a little about this tool so you can review that article to get more info.

As you look at this chart you can see that we drew our Fibonacci line from the low on the chart to the most recent high. This placed the lines on the chart that indicate levels where the price may retrace or pull back to before it begins to move back up again. As you look at these lines you will notice that the last low came right down to the 61.8 line and then bounces back up. As you look at the other lines you will see similar areas that acted at support or resistance. The reason why I want to look at this is to see where things may begin to change direction.

Currently, as gold sits, we would look for a potential bounce up. Not only is it sitting at the 61.8 Fibonacci line, it is sitting a past low, which can also act as support. Remember, just because something may be at support or resistance doesn’t mean it is going to stop moving. It only gives us an idea that it might happen. We still need to wait for confirmation of a reversal from the retracement. This could be any number of indicators or triggers that you may be looking for.

Take some time to review what is happening on the chart of gold this week and look for some possible trading opportunities. Remember, with the increased volatility, to lower your risk in your trades to avoid possible large negative movements.

What Do Successful Traders Do?

Here are 3 things that successful traders do and may help your trading to become more effective and more profitable:

  1. Trade with the Trend: Trading with the trend is actually simpler and so much easier than counter-trend strategies. Generally speaking, simpler is also easier to implement and easier to follow. The key is to have a system that just goes for the middle of the trend. The reason is because, again, it’s hard to pick the top and bottom (impossible to do on a consistent basis). The key is to follow the market and not force the market. Traders must to be patient with what the market gives us and it is important to not try to “make things happen”, which is the surest way to failure and frustration. Use a system that identifies and follows the trend so that you can jump on that trend and ride it. Trying to trade against the trend may cause you to overtrade and potentially lose when the trend “catches up” with you.
  2. Use Strict Risk Management: Only risk 1-2% per trade. The reason is simple – at some point in time, it is a statistical possibility that you could have 5-10 losers in a row. It might not be this month, or year, but over a 10-year period of time, you could have 10 losing trades in a row. If you risked 5% per trade you would be down 50%. To make that up you would then have to make 100%. Risking only 1-2% puts you at a 10-20% loss with 10 losers in a row. That type of loss can be made back in 1-3 good trades. Always use an initial stop loss order that reduces your initial exposure to the 1-2% max loss. Once the trade moves in your favor you can move your initial stop loss to your entry point or breakeven point and effectively reduce your risk on that trade to zero. You can then use a trailing stop to start to protect profits as the trade moves more in your favor.
  3. Follow a Consistent Routine: As part of your routine you need to answer these three questions…When do you trade?
    What is the best time you have available to trade? For example, if you can only trade in the mornings or in the evening, this will impact you’re trading routine.

    What do you trade?
    What markets are you interested in? Equities, equity options, ETFs, Forex, etc.?

    How do you trade?
    Once you identify ‘what’, then you can identify ‘how’ you trade, meaning what are your rules for entering and exiting a trade? These answers can become the basis for a written trading plan. The more consistent you can be in following your rules the better decisions you will make because you will reduce your emotions that will negatively affect your trading.

These 3 simple things or keys are not complex, but are often difficult to implement. However, if they are consistently implemented into your trading, they can give you a higher probability of success and lead to lower stress levels, which is good for you and everybody around you!

Gold and Fibonacci

Today we are going to spend some time to looking at the Fibonacci retracements on the chart of gold. The past we have discussed Fibonacci retracements and how they can be used to identify both entry points and exit points. Today we will look at some examples of the chart of gold both on the daily chart and on the 15 minutes chart see how these retracements can help us identify entry points for gold.

Over the last few weeks we have seen some pretty big reactions in gold prices as news has come out in relationship to what was said by the Fed. These big movements can make it more difficult to trade so we need to make sure we’re using proper risk and money management.

When discussing retracements we need to recognize the fact that the prices of anything will go up and then pull back or retrace a certain amount. Using the Fibonacci retracement indicator we can get an idea of where this retracement may occur.

Take a look at the daily chart of gold to see an example of where and how we might use this indicator:

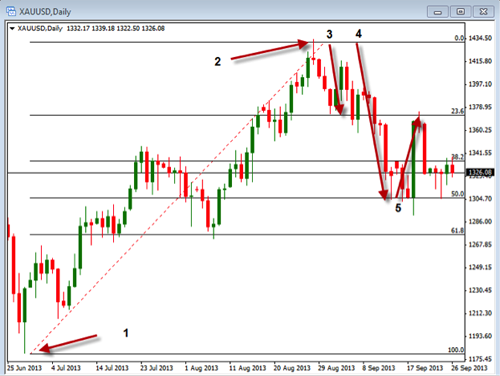
In this example of the daily chart of gold you can see we’ve applied Fibonacci retracement tool to help us identify possible points where the price may move back down to. In the bottom left corner you will see an arrow marked as number one. This is the bottom of the last down move and the beginning point of where we will draw our retracement line. This line is drawn up to the top where arrow number 2 is located. Once we draw to this line from point 1 to point 2 we will see the Fibonacci retracement lines drawn in automatically. You can see that they have different retracement points, including 23.6, 38.2, 50 and 61.8. We have drawn three other arrows on this chart to identify the area retracement or the pullback that occurred to each of these levels. Arrow number 3 pull back to the 23.6 retracement line while arrow number 4 pull back to the 50.0 level. Finally, with arrow number 5, you can see that and move back up to the 23.6 line. Of course there are no guarantees that the price will stop at these levels but you might be surprised at how often they do.

Now let’s look at the same concept with the 15 minutes chart:

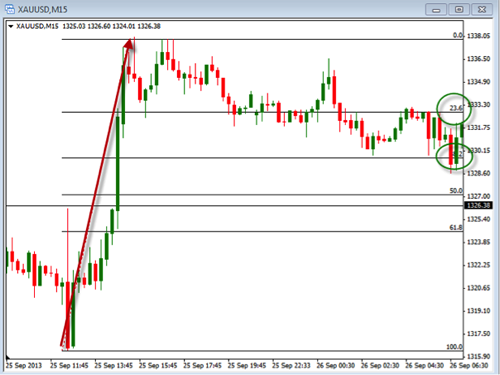
In this example you can see the up arrow where we drew the line from the low point to the high point. We always began at the low point and go to the high point in an uptrend or the high point going to the low point if the trend is down. In this picture we have circled the 23.6 level as well as a 38.2 level. You can see where these levels acted as an area of support or resistance to the movement of price either down below or up above them.

As you begin to look for areas where the price of gold may begin to move again consider using these lines to help you identify those retracement points. Remember there’s no guarantee that it will stop at these areas, but it does give us an idea of where things may begin to change. Take some time to review this and see how it might help you with your trading.