Next Week’s FOMC Announcement

Next Wednesday, on Dec 18th, the Federal Open Market Committee, or FOMC, announcement will be coming out at 2 P.M. EST. Why is this important? Well, this announcement could be the one from The Fed that might actually start the winding down or “tapering” back of the stimulus program, commonly referred to as Quantitative Easing 3 (QE3).

First of all, what is the FOMC? And then, what is Quantitative Easing? The FOMC is the Federal Open Market Committee and is a committee within the Federal Reserve System that is made up of seven Board of Governors, who are appointed by the President of the United States and confirmed by the Senate for 14-year terms. The Chairman of the Board of Governors, who is currently Ben Bernanke, is appointed from within the board for terms of 4 years at a time. George W. Bush first appointed Ben Bernanke and President Barak Obama reappointed him for another 4-year term. In addition to the 7 Board of Governors, the FOMC is made up of 5 additional members, chosen from the 12 Federal Reserve Bank Presidents on an annual rotating basis. This Committee meets six times per year, which brings us to next week’s meeting. At the conclusion of the meeting, there is a statement that is released which announces the current thinking of the FOMC and the current actions and potential future actions the FOMC is planning to take. Lately, most of the attention given to The Fed has been centered on the FOMC’s stimulus programs, Quantitative Easing.

So, what is Quantitative Easing? Quantitative Easing (QE) is the monetary policy used by The Fed to stimulate the national economy after the financial crisis in late 2008, early 2009. The Fed implemented quantitative easing by buying financial assets from commercial banks and other private institutions, thus increasing the monetary base. This is distinguished from the more usual policy of buying or selling government bonds in order to keep market interest rates at a specified target value. The Fed and other central banks tend to use quantitative easing when interest rates are already at low levels and this alone has failed to produce the desired effect. The major risk of quantitative easing is that, although more money is floating around, there is still a fixed amount of goods for sale. Under normal conditions, this will eventually lead to higher prices or inflation. Since the Financial Crisis of 2008, The Fed has undertaken three separate asset buying programs referred to as QE1, QE2, and, most recently, QE3.

The latest program, implemented in September, 2012, called QE3, was instituted to buy up to $85 billion mortgage-backed securities per month, until which time the employment and the economy improved.

This brings us to next week’s FOMC announcement, will The Fed begin “tapering” QE3 back as they have talked about doing or lay out a credible plan for doing so? The uncertainly of the current actions has created nervousness in the markets. What is the reason for the market’s concern? Well, the main purpose of the Quantitative Easing programs was to stimulate the economy by lowering interest rates. Lower interest rates have also stimulated the stock market because stocks have become more favorable than other investments such as fixed income bonds. As The Fed pulls back on the stimulus program, interest rates will naturally rise and this could negatively impact the stock market, which is why stock investors are obviously nervous.

So stay tuned for the official announcement on Wednesday! It could have big implications for The Fed actions going into 2014.
Using the Stochastic Indicator

Today we are going to look at how we might use the stochastic indicator to help us identify the overbought or oversold condition of the currency pair we are looking to trade. Knowing if a currency pair is overbought or oversold can give us additional evidence that the price might be ready to move in the opposite direction. Let’s first identify what overbought and oversold really means.

  1. Overbought: This is a condition where the currency pair has gone through a period of buying that caused the price to move up. This buying generally pushes the price to a level where it is likely to experience some level of resistance causing it to drop back down.
  2. Oversold: This is a condition where the currency pair has gone through a period of selling that caused the price to go down. This selling generally pushes the price to a level where it is likely to experience some level of support causing it to move back up again.

Warning! Just because an indicator, stochastic, or otherwise, indicates that the price is overbought or oversold, it does not mean that the price will immediately reverse direction. In other words, something that is showing an overbought condition can continue to move higher, while something that is showing an oversold condition can continue to go down. We need to remember that price is king and no matter what an indicator shows, the price will do what it wants to do. If we remember this, and focus on the price, then an indicator like Stochastic can be a useful tool.

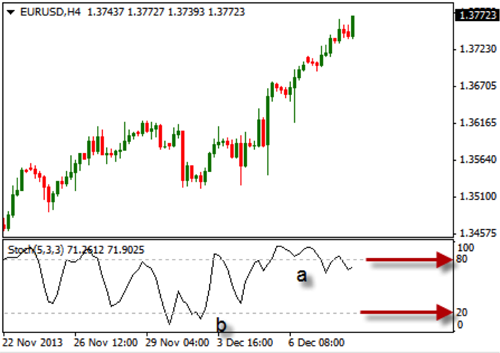
Now that we got that out of the way, take a look at the chart below that illustrates some of these points.

First of all, take a look at the 2 red arrows. The top arrow represents the level of 80 – this is where the price movement would be considered overbought. The bottom arrow represents the level of 20 – this is where the price movement would be considered oversold. Notice how the Stochastic line is near the upper level and has been for some time. The letter “a” shows the area where the indicator had moved above the 80 level and would be considered overbought. You should also notice that the price continued to move higher, even after the Stochastic indicator showed above the 80 level. This is one of the issues some traders will have with this indicator. They will automatically want to sell once the Stochastic line moves above 80. This would be a mistake, as the price continued to move higher. If you look to the left of the letter “b”, you can see where the indicator line was below 20. This would indicate an oversold condition, suggesting to buy the currency pair. In this case, the price responded the way we would like it to.

Using this indicator can be a good way to visualize when the price may be ready to move higher or lower. The key to successfully using this indicator is to wait for the price action to confirm what the indicator is suggesting. Take some time to review this tool to see if it might help you in making the charts a bit clearer for you to trade.

Trading During the Holidays

A common question that I get asked around this time of year, every year, is if it is a good idea to trade during the holidays through the end of the year. The answer can be a little difficult because it depends upon what the volume levels of various markets are, along with what specific markets you’re trading and what region of the world you reside in.

Generally speaking, as we approach the end of the year more and more traders leave the market to do whatever it is that they do for the holidays whether it is to travel or it just take a break from trading. It seems to me that over the past several years, the better the market as a whole has performed throughout the year, the more traders leave the market. I have been told over the years by traders that when they have a successful year they like to take a break until the first full business week of the next year, which in this case will be the week of January 6, 2014. It is a good time to enjoy their personal lives and travel or just to be away from the market. This makes allot of sense for a few different reasons because the market can be a little volatile around this time of year.

The closer it gets to the end of the year the more volatile the markets can get because as more and more traders leave the market there is less and less liquidity so the price action of stocks, ETFs and the Forex pairs can act in an exaggerated way. Often times, you will see very small candles on various time frames commonly jumping from one price level to another. It is common knowledge that a sideways market can be one of the most dangerous types of markets to be in, but a thinly traded market can be just as dangerous. More experienced traders can typically handle this since they have likely been trough these types of markets in the past, but newer, less-experienced traders should be very careful because if you do make a trade and the price action lurches in the opposite direction of your trade, it can take a very long time to recover if it does recover anytime in the near future. You could be in a trade with a negative position going forward into the first quarter of the New Year for quite some time.

I remember back around 2006 and 2007 trading in the Forex market near the end of the year and the price action would reach a given price level and just sit there for extended periods of time which, is almost unheard of during times when there is normal liquidity. The price action would lurch up and down gapping to a given price level just sitting there and then gapping again to another price level, but often times it never really went anywhere to speak of and it seems as though it rarely went far enough to make it worth trading. Over the past few years, I have noticed much more Forex liquidity and much more smoothly moving price action, so it does seem as though there has been a less erratically moving market.

The stock market may tend to contract too as volume reduces. Last year the ATR and volume reduced by approximately 25% as the end of the year approached; I would expect about the same thing to happen this year as well. I may be a little too conservative, but I’m likely going to stay in cash from the close of trading on Friday, December 20, 2013, until the open of the first full week of trading on Monday, January 6, 2014. There is no reason for me to believe that there will be any more liquidity in the market this year than there has in years past, so I will take the time to analyze what has worked for me this trading year and what didn’t, leading me to a logical conclusion of what I will focus on in 2014.

Time to Buy Silver?

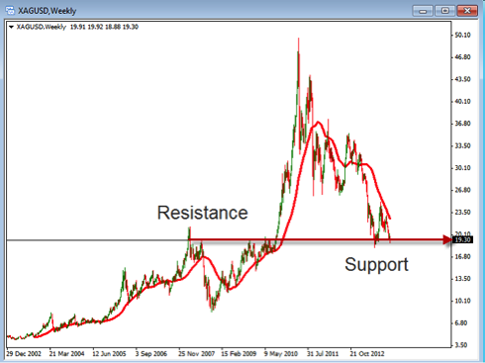
So today we are asking the question, “Is it time to buy silver?” Of course we don’t ever really know for sure, but, as we look at the recent price action, we might see why we are asking this question. Take a look at the chart below to see what we are looking at.

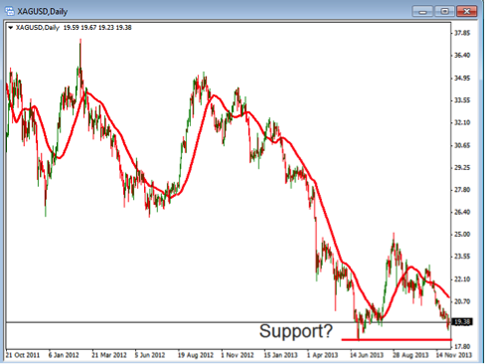
In the above chart we are looking at the weekly time period of the silver. With this time period we are seeing that the price is currently at a level of old resistance and new support. This might indicate that the price is at a point where it might want to go back up again. As we look at the daily chart below, we can see additional evidence that the price might want to go back up.

In this chart you will see a closer look at the current support area. This is what we will look at carefully to see if there is evidence of bullish movement. The key is to avoid the urge to enter prior to confirmation of a bullish move back up. If we get into a trade prematurely, we risk the possibility of the price moving against us quickly. We obviously want to avoid getting in too early so we will look for the evidence that the move is real.

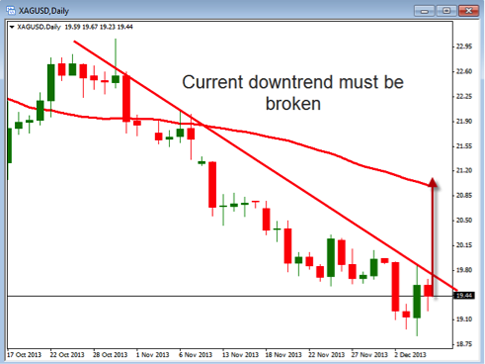
As we zoom in on the daily candles, we can begin to see the areas we need to move above in order to confirm the price action is moving back up again. Currently, we have two points of interest that need to be broken, first the down trend line, which is the first barrier, followed by the 40-period simple moving average, which is the final barrier. Once these two areas are broken, we can clearly say that the downward trend is being reversed. An entry at this point would be based on the evidence seen on the chart. You can also look a placing a buy stop entry order at a level above the 40-period simple moving average in order to enter. Just be careful that you don’t place it then forget you set it, as prices and patterns may change.

So although we don’t know exactly if or when the chart of silver will begin to move up again, it is clear that there are signs that the price may be sitting near a level where it could reverse. As with any trades, we will watch patiently for the setups to occur so we can enter when the evidence has presented itself.

Take some time to look at the chart of silver to see for yourself the upcoming possibilities that could happen in the near future. If the price of silver returns to the prior highs of around $50, we are currently looking at an increase of nearly 250%. This is well worth the time to prepare for another run up in silver in the futures. Again, no guarantees that this will happen, but if it does we will want to be prepared.

Divergence – Is a Market Reversal Looming?

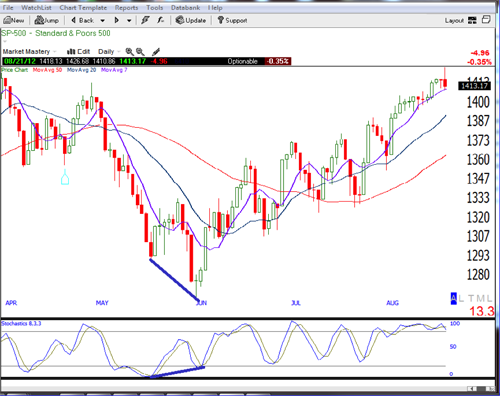
How can price action patterns and indicators predict a market reversal? Last week we talked about price patterns as a possible indication of a market trend change, with examples of double or triple tops or head and shoulder patterns. Another good way to determine a possible change in market direction is to look for Divergence. What is Divergence? The textbook definition of Divergence is as follows: In technical analysis, Divergence is considered either positive or negative, both of which are possible signals of major shifts in the direction of the price. Positive, or Bullish Divergence, as it is commonly referred to, occurs when the price of a security makes a new low while the indicator starts to climb upward setting new highs. Negative Divergence, commonly referred to as Bearish Divergence, happens when the price of the security makes new highs, but the indicator fails to do the same and, instead, closes lower than the previous high. Using divergence, traders can make transaction decisions when divergence is observed, where the price of a stock and a set of relevant indicators, such as the Stochastics, Relative Strength Index (RSI), for example, are moving in opposite directions. Therefore, divergence occurs when the price action makes a new high or low in the direction of the trend while the technical indicator used starts to move in the opposite direction. Bullish Divergence occurs in a down trending market when the price is hitting lower lows, while, at the same time, a technical oscillator, like Stochastics, RSI or MACD, is producing higher lows. When we see Bullish Divergence, this could be a strong indicator of a possible market bottom and a signal to look for a possible trend reversal. See the figure below for an example of Bearish Divergence.

EXAMPLE OF BULLISH DIVERGENCE

If we look at a chart of the Standard and Poor’s 500 there is a strong Bullish Divergence signal that occurs right around the beginning of June, 2012. Notice that in a downtrend the price had hit a new swing low of 1266.74 on June 4th. Also note, at the same time the market was hitting its new swing low, the stochastics indicator is moving higher. Also, since this Bullish Divergence pattern showed on the charts as of June 4, 2012, the Standard and Poor’s 500 started to move up immediately in a bullish direction by more than 150 points. The Bullish Divergence in this case indicated the bottom of the market and a change in momentum from the bear market to a bull market.

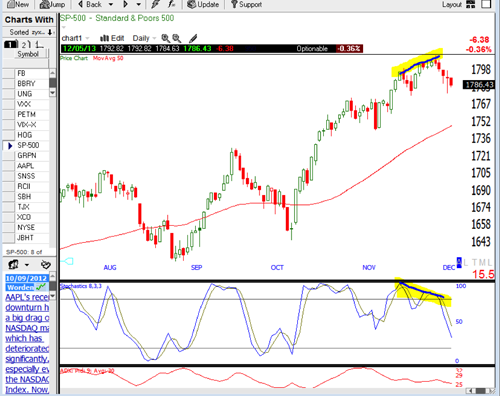
EXAMPLE OF CURRENT BEARISH DIVERGENCE

If we look to the current markets, note the chart below of the SP-500, over the last few days has been clearly moving upward, setting higher highs and higher lows. At the same time, notice the Stochastics Indicator has been pulling back of the same period, setting lower highs, setting up Bearish Divergence, and the market is starting to fall off.

So, are we in for a market correction? Well, according to the definition of Divergence we are clearly seeing weakness in the current up trend. Whether this continues into a full market correction or not, we will just have to wait and see. Also note the Head and Shoulders pattern that is setting up. If we get that to finish and break below the neckline in the next couple of days, LOOK OUT BELOW!

When Will It Move?

Since the stock market has been so flat lately it seems as though it is getting ready to make a big move – the only question is which way that move will be. The S&P 500 has been trading in a very narrow range over the past few weeks, which seems to be creating a lot of tension in the price action. Just by looking at the charts, it appears as though, when it does finally make a move, it may make it very quickly, jumping or dropping big in just one day or maybe over the course of a few days. In either case, it appears as though it is getting ready to do something.

Maybe this is the calm before the storm or maybe a lot of traders and investors are just taking a “wait and see” attitude hoping that the other guys will make a move moving the market so they can react to whichever way it goes. Whatever the reason is it seems as though it’s like a sprinter on the starting block just waiting for the gun to fire to start a race.

I have stated in the past that over the last year, in approximately the end of the 3rd week to the beginning of the 4th week of many months, we seem to see a pullback or a small correction followed by another relatively strong upward move. The upward moves have been at least as strong as the downward moves and, in most cases, the upward move is a little stronger, which has been propelling the S&P 500 to greater and greater heights. The market showed signs of weakness two times in November, but it did recover, continuing to rise slightly each time without really going anywhere substantial or at least it isn’t going anywhere quickly. This may be one of the reasons that I keep waiting to see a big move that seemingly comes from nowhere. Maybe it will be some unexpected current event or a very big surprise in the upcoming economic data, but it just seems like it is willing and able to make a big move, it just needs a catalyst.

It is definitely not uncommon for the market to end a year with a rally. In fact, there have been studies done which state that if you are only invested in the stock market for a few weeks out of every year towards the end of the year you will be able to capture a very large percentage of the total move that the market makes in most years. Since the government’s manipulation has pushed the stock market up so much this year it is hard to believe that it will rally further by the end of the year, but it is certainly possible that it could. It is also possible that so many traders and investors have produced such good results so far this year that they are willing to take extended time off as the end of the year approaches, thereby reducing the liquidity in the markets for those who continue to participate.

If I was going to bet on a market direction, which in a way I am, I am going to bet that the market comes down and I believe that at some point, in the not too distant future, it will come down with authority. I have not believed that there has been much substance to the upward moves that we have seen this year and I really do not believe that anything has dramatically changed leading to any reason for a continued rally. In the first quarter of next year we will need to deal with another debt ceiling issue and the government will run out of money again but it may be possible that both of those issues are far enough into next year so that investors and traders forget about them until after this year ends. This may mean that there could be some stability for the rest of this year but I believe that the market is just waiting for a catalyst, it is waiting for a reason to drop, and when it does, it will be a substantial enough of a drop that it provides us with excellent buying opportunities, which will allow us to set ourselves up for a very good 2014 trading year. Long-term investors will simply give back part of what they gained this year and then gain some of it back. But, if traders are smart and patient, I believe that we can set ourselves up for a good amount of profit after a pretty good drop in prices.