Looking for New Opportunities

What can we do as traders and investors to find new areas to invest in? While looking at emerging markets is a good option, I have noticed recently that some of the old standbys are making an attempt to reinvent themselves. I have seen this specifically in the fast food industry. Taco Bell® is going to begin to serve breakfast, trying to take part of the market away from McDonald’s®, currently, the undisputed fast food breakfast king. McDonald’s® itself is experimenting in a few of its stores by having customers place their own orders on touch screens. They are also increasing the ways that their burgers can be built by adding several new topping choices. It will be interesting in both cases to see how customers like the changes. In the wake of the new style of McDonald’s® restaurants, high school cafeterias look like they may get a boost from a greater menu selection and customers may like being in control of placing their own orders. The wait staff at a lot of sit-down restaurants have been using tablets and iPads® for order placement for a good amount of time so it was really just a matter of time until the fast food companies started using them. It seems as though it may be especially helpful for drive through ordering, at some point, since the drive through of many restaurants are notorious for getting orders wrong.

No matter what you think of fast food in general, or these specific restaurants, the point is that these are the types of things that we need to pay attention to. So we can be ready to jump on opportunities, regardless of if they are new opportunities from new companies or opportunities from established companies.

A new opportunity that was worth paying attention to a few years ago was in the electric car market. When Tesla® came out as an IPO, the stock stayed, basically, flat for over two and half years before it gained momentum. Investors and the marketplace eventually began to take them very seriously. I remember being very impressed with them the first year they had a presentation at Detroit’s North American Auto Show®. They had one high-end car on display that was driven across the country and one slightly less expensive one displayed, with the goal of producing affordable, all-electric cars for the masses. Once their sales and appeal took off, their stock hasn’t stop climbing from their initial price, running up over 1200%.

Today, one of the things that have gotten my attention is the makers of 3D printers. There are only a few of them and, with the prediction that every household will have one within 5 years, means that someone is going to be selling a lot of them. The commercial side is interesting too because most large companies that use 3D printing in more and more of their day to day operations state that they have no interest in developing their own. So the companies that are currently in the market could see a lot of success for a very long time.

I remember reading an article a long time ago about one of the legendary mutual fund managers. When he was asked how he made his investment decisions for the fund’s holdings he stated that he observes what’s popular at the time and the things that people are wearing, eating, buying and doing. He also stated that he observed what his kids are interested in. When you really think about this, it is a pretty good way to get investment ideas in general. If you add in another one of the great fund managers philosophies, which was to be fully invested in stocks 100% of the time, observing the things that are hot, at any given time, and adjusting your holdings as other things take their place, you would have had holdings in Microsoft®, Apple®, Google®, Facebook® and, more recently, Tesla®, with more new and interesting industries and ideas coming up quickly.

Important Area for Gold

Today we are going to look at the longer-term, weekly chart for gold to get an idea of where it is currently sitting and where it might be going. Right now we are seeing gold sitting at an area where some important moves might be getting ready to happen. If we are prepared and watching for the moves, we can take advantage of what might happen.

Before we look at the chart, I want to mention the fact that gold is, and most likely will be, a place of safety when the world becomes a bit uncertain. We saw this happen recently as there have been some military pressures happening over in Ukraine. As Russia deployed their military into an already unstable situation, the market saw that as a potentially bad situation and caused the price of gold to jump sharply this last Monday, March 3, 2014. It also saw a quick reversal to that big move up the next day as the uncertainty cleared a bit. I want to bring this up, as it can cause the price of gold to move differently than what we are seeing on the charts. Remember, news will supersede all indicators on the chart and move the price, regardless of what we see.

Take a look at this weekly chart:

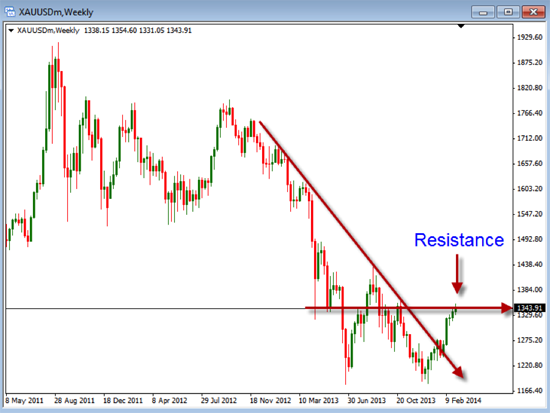
On this chart, you will see two lines drawn that represent areas of support or resistance. The first one to look at is the downward moving resistance line. For a long time, the price was remaining below this resistance. Several weeks ago, we saw the price move above this line. This was our first significant sign showing that the price was gaining some bullish momentum. The next line, the horizontal one, is where the price is currently sitting at. This area acted as support in the past, as well as resistance. Whenever we have multiple areas acting as support and resistance, we need to be aware of what price is going to do there. I mentioned that we are currently at an important level right now and this is because we are at a place where the price can either breakthrough and stay bulling or fail to do so and retrace back down. The most important thing for us right now is to be prepared to take advantage of either situation.

Situation #1
Short on a bounce down from the weekly resistance and look for price to move back and test lower areas.

Situation #2
Enter long as price shows confirmation of a break above this resistance line as it heads back up to the last high area.

Regardless of the price moving up or down, we want to be prepared to take action if we see the opportunity to enter a trade. As with any trade, we will want to make sure we use the correct risk amount so that our position size is at the appropriate level. Take some time to review this so you can make the best decision for your trades.

Basic Japanese Candlestick Patterns

What are Japanese Candlestick patterns and how are they used to identify potential price movements? During the 17th century, Japanese rice traders developed candlestick charts to plot price movements. The individual candlesticks are simply graphical representations of price movements for a given period of time. They are formed by the open, high, low, and close of any time frame.

If the opening price is above the closing price, then a solid candlestick is drawn and is a solid or “filled” candle. If the closing price is above the opening price, then a “hollow” or up candlestick is drawn. Each candlestick is made up of two different parts. The first is the “filled” or “hollow” portion of the candle, which is known as the candle body, and is the difference between the open and closed prices for a specific time frame. The second part of the candlestick is the set of lines above and below the candle body, which are normally referred to as the wicks, and represent the high and low prices for that specific time frame. For example, see the diagram below, if the price closes lower for the time frame, a bearish or “filled” candle is formed, like on the left candle below. If the price closes higher, then we have a bullish or “hollow” candle, like the candle on the right side below.

Japanese candlestick charts are often overshadowed by the use of various common technical indicators that are placed on the charts. However, if you learn to recognize a few of the common candlestick patterns, then you can use candlestick patterns to better understand potential market sentiment.

Two simple candlestick patterns to identify are the doji and engulfing patterns, as described below.

The Doji Candlestick Pattern
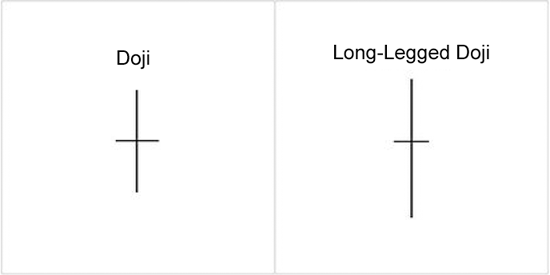
One of the easiest patterns to identify is the doji pattern. What is a doji? The doji pattern is when the individual stock, or any other market instrument for that matter, opens, moves up or down throughout the market day but closes at about the same price as the open. The lengths of the wicks, the high and low, can vary from short to long. The doji pattern indicates indecision in market direction between buyers and sellers. The long legged doji consists of a doji with longer wicks and indicates stronger indecision between the buyers and sellers.

Traders can use the market indecision indicated by the doji pattern to identify a potential weakening of the current trend. This can often trigger a price reversal in the opposite direction.

The Engulfing Candlestick Pattern
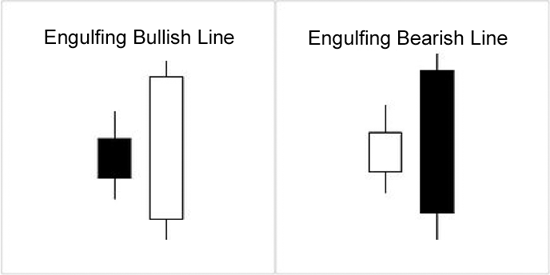
Another one of the basic patterns indicating indecision, and a potential direction change in the market, is the engulfing pattern. Examples of bullish and bearish engulfing candles follow:

The engulfing candlestick pattern is a favorite pattern among candlestick traders because it is a good indicator of a possible market reversal. The pattern consists of two separate candles. The first day is a narrow range candle that closes down for the day. While the sellers are in control of the stock or ETF being charted because volatility is low, the sellers are not very aggressive. The next day is a wider range candle that totally covers, or fully “engulfs”, the body of the previous day and closes near the top of the range. In effect, the buyers have overwhelmed the sellers (indicates demand is greater than supply). Buyers may be ready to take control and push the issue higher. Note in the chart below that the whole market sentiment and trend reversed at the bullish engulfing candlestick formations.

A bearish engulfing pattern would be just the opposite as the bullish engulfing pattern, developing at the top of the market, with the second candle being a down candle, completely engulfing the up candle, indicating a change to the downside.

Conclusion
These two simple candlestick patterns, both dojis and engulfing patterns, can be used to help identify indecisive market sentiment and potential changes in direction. Look for one or both of these patterns to help identify momentum price shifts.

Position Sizing

Today we are going to talk a bit about position sizing. This is something that is critically important, as it is the thing that keeps us away from too much risk in our accounts. If our position size is too large, we have the possibility of losing too much in our account. Many traders feel like they want to make a lot of money so they end up taking large position sizes in the hopes that the price will move in their chosen direction and they will become rich very fast. This is a dangerous way to think and trade. If we are right, then things are great, but when they go wrong, they go wrong really bad and really fast. So instead of thinking about how much money we can make, we really need to focus on being able to consistently be profitable while keeping a reasonable amount at risk.

When we start to trade, we are usually better off starting small and building up. This is true with our position sizing. If we start small and learn to make money a little at a time we can, then increase our position size as our trading proves to be profitable. If we start large and have one or two big losses, then we will be forced to decrease our size because our account is now small. So what can we do?

Let’s take a look at a possible way to start position sizing. The general rule is to never risk more than 2% of our account in any single trade. This means if we have a $10,000 account, we would be risking $200. This would be the maximum amount you should risk, but does not mean this is how much you should risk. As a new trader you may decide that you should cut that in half or more to get your feet wet and make sure you know what you are doing. So if you cut it down by half, you would only be risking 1%.

Another way to begin trading is to just use the smallest lot size you can. If you can, you might consider using micro lots to enter your trades. This means that you would be risking $0.10 per pip on the EUR/USD, instead of $1 or $10 with larger lots. By doing this, you can see if you are able to follow your rules and be profitable in your trades. If you can be consistent and profitable using these smaller lot sizes, you will be able to do the same as you begin to increase the lot sizes. The key is to prove that you can be profitable in the beginning and, if you are only risking small amounts, you are likely to be trading better because you are not feeling the pressure of losing large amounts.

Take some time to review your position sizing rules to make sure you are trading with the appropriate size and, remember, it is ok to start small and build up to larger sizes.

Market Volatility and Trading Risk

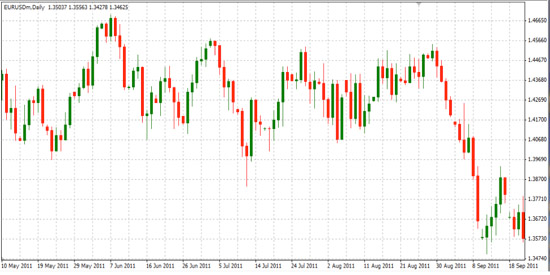
Many traders are feeling the anxiety that comes from the current ups and downs of the market. The first thing to remember is that there is no such thing as a perfect market, but some markets are better to trade than others! In fact the market often cycles through periods of what I will call deliberate trading markets vs. non-deliberate trading conditions, which are more volatile. Certainly more volatile, non-deliberate trading times can increase our trading risk due to this increased volatility. Non-deliberate trading markets are defined in general as a market with the last 20 periods with unusually long candlewicks, wider ranges, trading gaps, etc. Generally speaking, a more deliberate trading market will have fewer, wide-trading days, with none or few unusually long candlewicks or unusual trading gaps.

See Figure 1 below for an example of a non-deliberate market with wider candles and longer wicks or daily trading ranges.

Figure 1: Non-deliberate Ranging Market

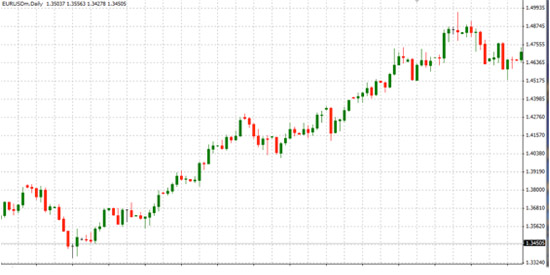
The opposite of a non-deliberate trading market is a deliberately trading, or more trending, market, with a nice trend, narrower bars, and fewer long wicks and gaps shown in Figure 2 below.

Figure 2: Deliberately Trading Trending Market

Now we would all prefer to only trade when the market is more deliberate. There is no doubt that during these non-deliberate times of market uncertainty, these can negatively affect our trading psychology or mindset, leading to fear and anxiety over our trading style and methods. Certainly there are times, like the present, when the market is more uncertain or non-deliberate than we would want. But if we allow the market to get into our heads, we’ll find ourselves overly anxious, and even too discouraged to trade.

However, if we have a good trading method, but start to question the trading methods, every time we have a loss, we may decide that it is better to sit on the sidelines and not trade at all, missing many good trading opportunities. One way that traders, especially new traders, adjust to uncertain times, like we are in currently, is to tighten the stops; however, more experienced traders understand that tightening up our stops during more volatile or rangy times can be the worst thing to do. In fact, doing so can almost guarantee that we will lose on the trades. Sometimes the idea is if we are going to lose anyway, we want to lose as little as possible. This kind of trading attitude may allow our fears to overcome logic and will lead to more unsuccessful outcomes. Still, the best level to place stops and targets are going to be based on current support and resistance levels within the current ranges.

The only real way to reduce our risk is to reduce EXPOSURE. The best way for a trader to reduce exposure in a non-deliberately trading market is by reducing position size. If we are going to reduce our position size, and we normally define our risk as 2% per trade, then we may want to consider reducing our exposure per trade to 1%, or even .5%.

In conclusion, if you are feeling anxious because of the current rangy non-deliberate market, the best thing you can do is simply reduce your position size; therefore, reducing exposure to the non-deliberate volatility. This will help to control the negative emotions of fear and anxiety that comes from trading in non-deliberate trading ranges.

Exiting a Bull Run

With the S&P 500 at all time highs, the NASDAQ at multi-year highs, and the DJIA very near an all time high, it’s pretty safe to say that the stock market has been rallying in spite of any news that may suggest that the economy is slowing down or that its recovery may be slowing down. This is obviously a good thing, but it does bring up a dilemma for traders and investors; it’s a good dilemma to be faced with, but it is still a dilemma. Now we are faced with the question of when will the rally end, how much is enough, and when should we move to cash or short the market if we are a more aggressive investor? For the past several weeks, riding out the most recent leg of the rally has made us allot of money, but what really irritates me is having to give back too much of it when it finally does turn around. We all know it will turn around, it’s just a matter of when, not if, so how do we determine when to get out?

Depending upon the analysis that you did to get yourself into this rally, the answer could be very simple. If you had a good enough system or a good enough method to get yourself into this market, you probably have a good system to exit it as well. This, of course, could be an exit strategy that is triggered when certain technical indicators begin to turn negative or an exit strategy that could be triggered by fundamentals breaking down. But, either way, we still need to have an orderly and logical exit strategy that will allow us to retain as much of our unbooked profit as possible when we do get out.

Riding a bullish market up, not getting out in time, and then staying in for the bearish run that will follow, doesn’t accomplish anything, so capturing as much of the upward move as possible is essential for long-term success. There are several ways to exit a bull run like we are experiencing. Some traders and investors may use a specific profit margin that they want to achieve as a profit target, while some may use a specific dollar amount that the securities that they are invested in must reach, while others will just jump out when they feel that the market may turn around on their positions. Regardless of the way that this is done, it would be a very good idea to pay attention to what the markets do on a daily basis, staying on a heightened alert. The reasons for this are numerous and most of them are basic common sense, but what is becoming troubling, to a certain extent, is how many very large, famous, and successful world-renowned traders are beginning to publicly state that they are looking for a market correction, some say as much a 50%. Most will state that the reason the market has advanced as it has over the past two and a half years is because of the government’s low interest rate policy and the government’s quantitative easing. They state that the markets have been artificially propped up by the government’s intervention, which is very likely true.

I personally don’t care what the reasons are for the continuation of the rally; all that I really care about is that it continues for as long as possible so, at some point, I can capture as much of it as possible. At that point, I will sit in cash or short the market, waiting for the next bull run to begin. The reason it is very important to find a good way to exit the market at as close to its peak as possible is so we can cash out and wait for the next opportunity. It may be in the metals or it may be in real estate or it may be that we should wait for the next market run. Where the next opportunity will come from may not be clear right now, but it will reveal itself to us – opportunities always do, we just need to be able to see them.