The answer is, the market will keep going up as long as there is upward demand and momentum. No one actually knows how far the market will go up for certain, unless you have a crystal ball, that is. However, there are technical clues that can help us determine if we are at the top of the market or if there is continued bullish market momentum. In previous articles, we have discussed the idea of different price patterns and support and resistance levels that we can use to help determine when the current market momentum is strong or weak. Today, I would like to discuss what clues we can look for to help determine the potential future direction of the current Standards & Poor’s 500. Over the last couple of weeks, we have seen the S&P 500 pull back and then move up sharply several times, but, each time, it has left several clues concerning current momentum.
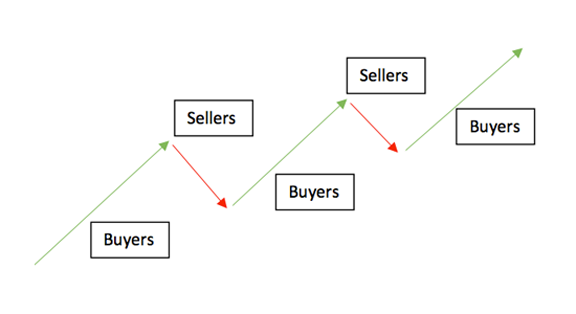
How do we identify market momentum? Once a trend starts, the market just doesn’t go straight up or down, but will have times where the market moves back against the trend or, in other words, pulls back. Often times, because of the market forces of supply and demand, the market finds natural levels of profit taking in most market moves. Let’s first look at these back and forth price patterns that we often refer to as continuation or “Flag” patterns. In a bullish market, these flag patterns are created by the price action moving up first with the trend and then against, or counter the trend, while then moving back up again with the trend. These flag patterns create minor support and resistance zones, or flags, within the current trend. A current chart of the S&P 500 shows three of these flags, or pullbacks, since the beginning of June. See chart below:

The second clue we can look to for evidence of continued market momentum is bounces off of a support level. The definition of support is a price level where the market finds a bottom, or a price floor, as the market is moving down. It is where demand is strong enough to prevent the price from moving any lower. The idea is that as the price gets cheaper, investors become less interested in selling, more interested in buying, and the demand, therefore, picks up. Much like a stone being skipped along the surface of a lake, if the price action “skips” along a short-term support level, this is a very good indication of continued, bullish market momentum. This concept can also be applied to a bearish, down market, but you would be looking at bounces off of resistance as a ceiling, as the market is going down.
Now let’s apply these two technical clues to short-term flag patterns and bounces off of support to the current S&P 500 chart. See the chart and note the three recent bullish flag patterns and the three corresponding bounces off of the 20-period SMA. This is a classic indication of a continuation pattern, confirming bullish momentum.
So in conclusion, do we actually “know” anything about the market’s future direction? No, not really; however, if we see technical patterns like those above of bull flags and bounces off of short-term support, the probability is much higher that the market momentum is strong and will continue to move higher. But if you’re wrong, that is why we always use good risk management rules!