Parabolic Stop and Reverse

Today we are going to discuss an indicator that is used a bit less than some of the other ones we have looked at in the past. The Parabolic Stop and Reverse, or the PSAR, is and indicator that has many different functions when placed on the chart. One of the most common ways to use this indicator is to reverse your position when the indicator changes. You will see that the indicator plots a “dot” either below or above the price on the chart. If the trend is moving up, the dot will be below the price and if the trend is moving down, the dot will be above the price. So as the dot moves from above to below or below to above, you would enter the trade in that direction. Another simple way to use the PSAR is to use it as a trailing stop area. Each time a new candle shows up, the dot will be adjusted. You would then simply move the stop to the area of the new dot.

Now that we have described these two ways of using the Parabolic Stop and Reverse, let’s take a look at how they look on the charts.

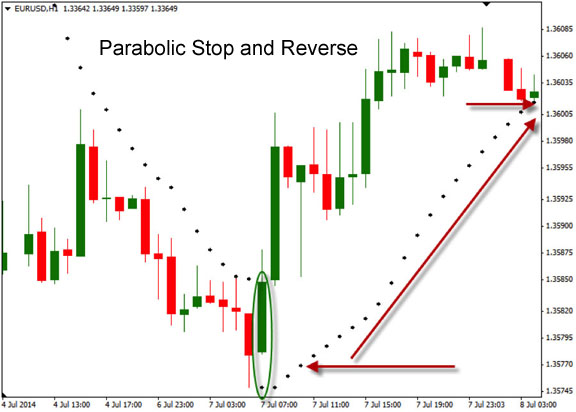
In this chart below, we are looking at the 1-hour chart of the EUR/USD. Notice how, when the price is trending down, the PSAR dots are above the price and, when the trend is moving up, that they are below the price. In this case, if we were looking for a possible entry into this pair, we would have taken a long position on the close of the candle where the dot moved below the price. You can see the green circled area where this happened.

As the price begins to turn down, we can look for the dot to move above the price, suggesting a place to enter a short trade. In the next chart we are showing how the PSAR can show us where to place the initial, then trailing stops.

As we see new dots formed, we can place our stop loss at those levels. You can see that as the price moves up, the PSAR will follow along. Using this to exit will generally give you a good place to put your stop, as it will not be so close that you get stopped out in regular price movements. Once you are stopped out, you will begin to look to enter the trade in the opposite direction. Many traders like this type of stop, as it gives them a specific place to put the stop loss. In addition, it is dynamic to the price movements on the charts, so it gives us a place to trail the stop loss.

As with any indicator, you will want to test it out to see if it will help you in your trading. Take some time to practice with it to see how it will work best. Whether you are using it to look for potential entry points or you are looking for something to help with your stop losses, the PSAR is a good tool to have.

Get the EMOTIONS Out of Your Trading!

I have discussed trading psychology before and it’s a big topic for all traders because it’s such a challenge for so many, especially in a market that is more volatile, like one that we’re in right now. The current uncertainty on the geo-political front in the Ukraine and Russian borders and with uncertainty in the middle east, not to mention the threat of rising interest rates at home, have created a more volatile market. Since we can’t control the world politics or the macroeconomic domestic issues, all we can do is control our trading. The best way to do this is to become very calculated and unemotional about our trading. Some ideas to help with this are as follows:

Prepare before you make a trade. Even before you ever make a trade, get into a trading mindset or, what I refer to as, good “trading health”. How do you do this? Well, make sure that, physically, you are healthy and not overly tired or stressed. Now I say “overly”, because it seems I am always tired and stressed to some degree. Relax for a few minutes, take a short walk, or do some breathing exercises; these will help to reduce the stress in your life. I won’t go as far as recommending yoga, but some quiet meditation is always a good idea before you start trading.

Follow your system or technical trading rules. It doesn’t matter what your style of trading is; whether it is day trading, swing trading or position trading, develop and follow good entry and exit rules. Whatever specific system or method you use, you should backtest and forward test so that you have confidence in the rules for both entries and exits. Once you are confident that the system is profitable, the best thing you can do is to follow it mechanically. This will help you overcome the normal tendency to let emotions get into your trading and can very easily short-circuit your success.

Use strict risk management rules. No matter how good your system is, there is no “Holy Grail” or perfect system. No matter how good of a trader you are, you are going to have some losses. It’s just going to happen and the better you are about accepting this fact and taking losses, the better your overall trading will be. Because you are going to have losses, it is important that you follow good risk management rules to limit those losses. You should always use an initial stop loss order so that you can understand what your initial risk or exposure to the market is. A good rule of thumb that I use is to limit your risk per trade to no more than 1% of you overall account. Also, you should determine the overall risk or the total number of open positions you will carry at any one time. I recommend no more than ten open positions at a time. So if you have 10 positions, with 1% percent risk each, your overall exposure to the market will never exceed 10%. Determining this will allow you to keep your exposure to market risk acceptable and you will never have any huge drawdowns sitting in your account.

So, in conclusion, the best trading success is going to come to those who trade with good trading health, a good trading strategy, and good risk management. By following these steps, you will be able to reduce the emotions of trading and stay in the game for the long run.

Candlesticks

There are several different types of charts that traders can use to help them determine the direction they should be trading. Some of the more commonly used ones are the line chart, the bar chart and the candlestick chart. Some of the less commonly used ones are the range charts and the Renko charts. Regardless of the type of chart you use, the key ingredient in each one of them is the price action that the currency pair is going through. Most of them will show you the various levels that the price has made during the duration of the time of the chart. For example, if the chart we are looking at is the 1-hour time frame, the bar, or candlestick, the chart will illustrate the high, low, open and close of the last 1 hour of time. Now there are variations of the bars and the line charts typically just show the closing price, but the key is that they are giving us information about the price action. As we interpret these charts, we can get a better understanding of the direction and momentum of the price.

For our purposes here today, we are going to look at the candlesticks in a bit more detail. Many traders like the candlestick charts because they seem to be visually easy to read. Traders can quickly look at the chart and identify if the candle is a bullish or a bearish one. As color is added, it allows us to see not only the direction of the momentum, but also the degree to which a movement has happened. Often times, traders will make the candles green if they are moving up in price and red if they are moving down. This can give us a quick understanding of the immediate direction, as well as the longer-term trend as multiple candles of the same color are formed. So if you see multiple red candles being created, you will know that there is more of a bearish trend than a bullish one. This would then lead us to the decision to look for opportunities to short the pair.

Another way that the candlestick can help us in trading is to look at the length that the candle body forms. If the candle body is large, we know that there has been lots of movement happening during the time of the candle. If the body is small, we know that there has been very little price action. In addition, we can see varying lengths of wicks or shadows that extend above and below the body, which shows us the high and low price. As these wicks expand or shrink, they will show us the amount of volatility in the pair.

Candlesticks are a great tool to help you in understanding the price action for the chart you are trading. As you begin to use them, you will find you have greater insight into the direction and strength of a potential price move. Take some time to review these charts to make sure you understand how to best use them.

Setting Profit Targets

Many traders who focus on getting into trades and following good risk management principles will also focus on setting stops to help control risk. This, however, sometimes takes the focus off of setting profit targets. In fact, every time you enter a trade, you should have a good exit strategy, which, most of the time, should include a profit target. Here are a couple of ways to look for good levels to set your profit targets.

1. Using support and resistance to find good targets.

We often talk about using support and resistance to help identify a good place to get into a trade. For example, you want to buy long in an uptrend off a bounce off or support to enter. If in a downtrend, you would use the resistance level to identify an entry off of a bounce lower. Today, let’s discuss using support and resistance to help us set profit targets or good exits. The first thing we need to discuss is setting up our support and resistance levels. The easiest way is to go to the chart and connect the recent significant highs using a trend line at the top of the market to get a resistance level. Then set up your support level by going to the chart and connecting the lows using a separate, but parallel, trend line at the bottom of the market. Once these tops and bottoms are connected, this will show the support and resistance levels over the last several tops and bottoms and this will help identify the support and resistance channel forming the outsides of the movements of the market. Notice the support level will be supporting the market price action as a floor as the market is moving up and down between the support at the bottom and the resistance at the top. In an uptrend, you will want to look for a profit target inside the resistance level at the top. If you set your targets too aggressively, you can short-circuit your trading, so always look for the most probable place for the market to go, which is generally just inside the resistance level at the top, in an uptrend, or just inside the support level at the bottom, in a downtrend.

2. Using Fibanacci levels to identify targets.

The Fibonacci retracement levels found in the Fibanacci indicator can be useful for traders to identify potential reversals on a chart and, therefore, good level to target and exit. For example, once the market has moved up or down in a trend, the market has a great tendency to move back, or retrace, a certain amount against the trend. Because of this common retracement pattern, traders can use the Fibonacci Indicator as reference points to predict certain retracements levels as the market moves back and forth in a trend during a “pullback” or retracement. Often you will find these Fibonacci levels to be very accurate when analyzing chart pattern reversals. As with support and resistance levels, if you can identify specific levels where the market is more likely to go, to you can set your profit targets just inside the next “fib” level, up or down, depending on the direction of the trend.

So in conclusion, it is important when setting up your trades to look for the best or most probable levels to set your profit targets so you can get in a trade and then have a set place to get out. Having profit targets along with setting stops for risk management will allow your trading to be more structured.

Losing is Easy, Winning Takes Guts

I have always told people that entering the market and managing a losing position is very easy; anyone can do these things relatively easily, and most of us do them far more than we care to talk about. The real challenge with trading for many traders is managing the winning positions. Entering a position can be easy because there are really only a few good entry points and many of those can be very obvious. Managing the losers is easy because there isn’t much to do around them; you either leave the position open until it gets stopped out hoping along the way for a recovery, or you bail out of the position at the point that you can’t take it anymore and just give up. The reason that managing the winners can be difficult is because, when you have a winner, you have a lot of decisions to make, so it doesn’t turn into a break-even or a loser. Most traders will get focused on making the right decision; many may take a very defensive posture trying to balance the position between capturing as much profit as possible, while letting the trade progress as far as possible. Similar to a losing trade, many traders will manage a winning position until they can’t take being in the trade anymore, so they close the position, capturing whatever unrealized gain is available to them at the time. Any time you can close a position and capture some profit is a good time to close the trade, but, many times, it may not be the optimal time to close the position.

One problem with trying to find the perfect way to get out of trade is what works for one trade will not necessarily work for all trades, so we must look for the exit strategy that works for most of the trades. This can be achieved by trial and error, observing a good sample size of trades that have come to their fruition and also by applying different exit strategies to open positions based on what we observe to be market conditions at the time. One of the most difficult things around trading is knowing when to get out, which creates an ongoing internal battle between fear and greed; we can be afraid to stay in a trade much longer because the market may move abruptly against us, while, at the same time, we are afraid to get out because, “What if the current trend continues and we could have captured a lot more profit?”

The problem that I see that many traders have with trying to match an exit strategy with current market conditions is that this is, basically, a guess and, oftentimes, the trader will guess wrong. When the trader does apply an incorrect exit strategy, they will, very likely, either stay in a trade too long or they will get out of it too early. Either way, they are leaving money behind that they could have captured by using a better option. Exiting by trial and error over the course of many trades may actually help you gain some insight as to which exit approach is the best one for your trading style; however, this will most likely put you in a position where you give up a lot of profit along the way. You could gain a lot of knowledge, but the result will probably be that your lessons are very expensive.

One excellent way to exit a winning trade is to a pick a specific profit target and use it on every trade. It doesn’t matter if it is based on a given number of dollars, pips, or points, or if it is based on a percentage of movement; pick the strategy that will result in capturing as much of the profit as the winning trades will yield, while not staying in so long that they turn around before you exit. Another excellent way to exit a profitable trade is simply by using the broker’s automated trailing stop. The automated trailing stop option is a good one because you will stay in a trade, riding the move with the stop moving for you to protect your unrealized gain until the market moves far enough against the position to stop you out. There will be an undetermined amount of profit with this strategy, but the further the market goes, the more profit you can gain. Using a combination of these two strategies is a good choice, as well; use a specific profit target while employing the automated trailing stop. Each time the stop moves, it gets closer and closer to the profit target, so, at some point, either end of the trade that is reached first, will still result in a nice win. Unfortunately, there is no one best way to exit trades; this is something that will only come with experience. We just need to put ourselves in the position to get the winning experience as much as possible, so we can get good at managing them.

Deliberate Price Action

In our article today we are going to discuss the important topic of deliberate price action. One of the most important parts of trading is to identify if the price is moving in a deliberate pattern or not. When the price is deliberate, our trade setups are generally going to give us better opportunities to profit from our trades. If we are trying to trade when price is non-deliberate we are going to have less consistent results.

Deliberate markets are ones where the price is consistently moving in a pattern that avoids very big or very flat moves. Non-deliberate markets are ones where the price experiences big and fast moves or it can also become very flat. These non-deliberate movements can oftentimes be seen during times of news, such as economic reports or unexpected world events. In addition, you can see non-deliberate movements when the major markets are not open and the price becomes very flat. Regardless of the reason for non-deliberate price action, we need to recognize what it looks like and take steps to avoid trading during those times.

When price becomes non-deliberate, you will see very big swings and gaps in price. When this occurs, you may see the body of the candle or bar be very wide or you might see the wicks or shadows be very far apart. Either way, you will see the range of the price be in the extreme ranges. This can make it very difficult to identify an actual entry point. In addition, you may notice that the spread between the bid and ask price becomes very wide also. Gaps can occur as the change in price moves so quickly that the next trade happens well above or below the last candle’s closing price. When this occurs, you will oftentimes get poor fills or your stop losses may be missed and you take a bigger loss than what was expected. Regardless of what happens, this type of non-deliberate price action can make it difficult to place successful trades.

The other type of non-deliberate price action occurs when not much is happening in the market, such as when the major markets are closed. Instead of having a large range of movement, you will see very flat price action. This will be seen in the form of very small candles that chop back and forth without going anywhere. This can occur until another event occurs, either in the form of news or a new market opening up. This can be hard to trade because, even if the setups occur, you won’t get the move you are looking for.

Deliberate price action is what we want to be trading. If you can identify when not to trade, you will be placing yourself in the best situation to profit from your trades. By avoiding the times when it is non-deliberate, you will increase your probability of success. Take some time to review your ability to identify both deliberate and non-deliberate price action.

Three Steps to Swing Trading

Whether you are a new trader, just beginning, or have traded for some time, these are the steps to technical trading that will work for any market, whether you are trading stocks, ETFs, or Forex. Sometimes looking at the technical charts can be overwhelming, especially at first, so if you follow these steps, you will be able to identify good trades.

1. Use the charts to identify the trend.

The easiest way to start swing trading is to only trade in the direction of the trend; therefore, identifying the trend, either long or short, is critical to success. One of the easiest ways to identify the trend is to use a 50-period moving average. If the 50-period moving average is moving higher and the price action is above the 50-period moving average, you are in an up, or bullish, trend. But, if the price action on the chart is below the 50-period moving average, and the 50-period moving average is moving down, the market is in a down, or bearish trend.

2. Identify good entries and exits using support and resistance levels on the charts.

It is always best, when trend trading, to trade off of support or resistance levels. Support makes a good floor in an uptrend and resistance makes a good ceiling to trade off of in a downtrend. One of the easiest ways to identify the levels is to go back on your chart and connect the highs and lows in the market with parallel trend lines. In an uptrend, wait for the market to pull back to the support, or floor, and then wait to enter into the trade until the price has resumed or confirmed a bounce with a closed candle moving up in the direction of the trend. This way, you are going long with the bullish trend after a pullback against the trend, after the bounce has occurred. To start, I would try this on a longer-term daily chart, before moving to a 4-hour or hourly chart. For a downtrend entry, you would follow the same pattern, but in the opposite direction. For example, in a downtrending market, you will be looking for the resistance level, or the ceiling. Then you will identify a good entry point once the price has moved up to the top and then bounces off of the ceiling confirming a move down toward the support level. The caution here is waiting until you have a closed candle to confirm the “bounce”. The best place to set your targets is inside the opposite support or resistance level – don’t get greedy!

3. Use proper position sizing to manage risk.

It doesn’t matter what method of trading you use, the most critical element to your trading plan is to limit your exposure to market risk. No method of technical trading is going to be 100% accurate (no matter what advertisements may say). Therefore, you must always be prepared to accept a losing trade. It is best to keep your exposure or risk to less than 2% of your account balance so that when you do have a loss you, will not put too much of your account at risk.

These are 3 basic steps to get started technical swing trading. Remember, trading with the trend, using support and resistance to find entries, while keeping your risk manageable, is a great formula for success!

Flag Pattern Setups

In today’s article we are going to look at a commonly used price pattern called a Flag pattern. These types of patterns are known as continuation patterns, but sometimes they will turn into a reversal pattern. The idea is to look for a trend, then wait for the price to slow down before entering as the price begins to move back in the direction of the previous trend. This type of pattern makes use of some of the most important concepts in technical analysis, namely the trend, support and resistance, as well as momentum.

The picture below illustrates the basic formation of the flag pattern.

The first part of the flag is called the flagpole – this is the uptrend the price is moving in. The next part is the blue box, which represents the flag. Price action will move between the highs and lows within the box, causing the support and resistance lines to be angled opposite the current trend move of the flagpole. The third part of this is the breakout and continuation of the prior trend. This type of price action occurs regularly because the price will often times take a breather midway up the trend. As we identify these areas of consolidation, we can look for opportunities to enter the trade as the trend resumes.

When trading flag patterns, we will be looking for an entry point as the price moves above the flag in an uptrend or below the flag in a downtrend. Using buy and sell stops will allow you to place the entry order outside of the flag formation. In the picture below you can see a few things for trading this pattern.

The first thing that you can see is that the trade would not be taken until the price moved outside of the flag area. This means that you would need to see a clear break above the resistance area. Once it broke above it, you would be entered into the trade with the buy stop order. You can also see the line for the stop loss. This stop loss should be placed back inside the box in case the breakout turns into a fake out trade. This is not unusual to see, so we need to make sure we have our risk under control by using a stop loss. We want to give it enough room to move, but, if it closes back down below the resistance or breakout point, we will want to exit the trade. It is oftentimes stated that the flag pattern occurs half way up the flagpole. This means that, if the flagpole is 20 pips long when the breakout occurs, we will see the continuation move about 20 pips. This will give you an initial target to shoot for when trading the flag pattern.

Although there is nothing perfect, trading flag patterns can be simple and effective as they give us specific entry and exit point on the chart. Take some time to look at these to see if they can help you in your trading.

Using Indicators to Identify Entries

Technical traders use the price charts to determine when to trade and when not to trade. We have discussed in the past how to use the charts to determine the trend and the strength of the trends. Once the trend is determined, either long or short, the next thing to determine is the best time to enter and exit the trades or the trading timing. The following are three indicators that are commonly used to help determine good entries.

  1. Moving averages are technical indicators that can provide a simple way to indentify entry and exit points. Many systems use a combination of moving averages on a chart to identify trading signals. One popular combination of moving averages I like to use for this purpose is a 9 and 18-period moving average. An entry signal occurs when the 9 crosses above the 18 to enter long and when the 18 crosses below the 9 to enter short. Since the moving averages are trend-following indicators, they often will work better in a strong trend when the price action moves above or below a 50-period moving average. This also can provide good buy/sell signals when the price action moves above or below the 50-period moving average line.
  1. An oscillator indicator, Stochastics is good to identify overbought and oversold markets. While moving averages are great to use in a trending market, oscillators work very well in more of a ranging market. Stochastics are probably the most commonly used oscillator indicator. I really like, and use, the Stochastics indicator. Stochastics work on a scale of 1 to 100%. With the Stochastics reading over 80% of 100 indicates an overbought market, while reading below 20% of 100 indicates an oversold market. The Stochastics generally use 14 days as the default setting. When the price action moves below the 80% line, this could be potential short entry in a downtrend, or, if the price action moves above the 20% line, may be a good entry signal in a strong uptrend. This allows you to use it to identify potential areas where the market might make a turn in the opposite direction. When used in conjunction with support and resistance, the Stochastic indicator becomes a powerful tool to identify entry signals, especially in a ranging back and forth market.
  1. Traders also commonly use the MACD for potential entry and exit signals. The Moving Average Convergence Divergence (MACD) indicator combines a moving average crossover system with the overbought/oversold elements of an oscillator, such as Stochastics or RSI. A buy signal occurs when the faster line crosses above the slower and both lines are below zero. A sell signal takes place when the faster line crosses below the slower from above the zero line.

In technical trading, the first important thing is to determine the trend with the 50-period moving average and support and resistance levels, then using the technical crosses described to help determine entries in the direction of that trend will help to identify good potential trades.

Which First – Initial Stop or Risk Management?

Getting into a trade or an investment isn’t really that difficult; you apply whatever method you are using to the given security and, based on the results, you either enter into a position or you do not. Many times where the challenge of trading comes in isn’t as much the entry of a position as it is the exit of the position. There always seems to be a question that revolves around the optimal way and time to exit. How and when do we exit so that the exit will allow us to capture as much of the unrealized profit as possible, while not letting the price action come back too far on us eating up more and more of our potential profit with every move? Before we get into the management of an exit strategy of an ongoing position, we need to learn where to place our initial stop on the given position so that the trade has as much of an opportunity as possible to work for us right from its inception. The initial stop will need to be placed at a level that is far enough from the entry price so that it should not be reached by the price action, while, at the same time, it needs to be close enough to the entry price so we do not allow the balance of our account to be needlessly reduced if it is reached.

One of the biggest trading problems that I see that many traders have is that they create a trading method, while trying to include an exit strategy with the trading method creating the entry and exit at the same time. The problem with doing this is that you really don’t know how well the upside of the method will actually work until it is tested. You don’t know how far in the money or out of the money the positions are likely to go until you have a good sample size of the method’s data while it is in use. A big part of a trading method’s results will come from its initial exit strategy. So finding the optimal initial exit strategy for the given method is essential, but how this is done is what is suspect in many cases.

Take a sample size of your trades, regardless of if they are done with live dollars, done in a demo account, or from backtesting a given method, and find out how far out of the money each of them goes, listing them in order from either biggest to smallest or vice versa. By doing this, you will able to determine what number of trades are successful for each percentile with a given protective stop level. You will be able to determine the stop that you need to win on 50% of your trades, 60%, 70%, etc. This will give you a realistic scale where you will know that when you are in a trade, if you place your protective stop a given percentage away from the entry price, you will typically win on X% of the trades that you participate in. By applying your existing trading method to the given market with this knowledge of the potential downside, you should be able to maximize your profit without taking unnecessary risk.

Traders and investors may consider creating new trading methods in two halves, rather than one complete method all at once. Look at the upside first and then look at the downside once you are satisfied that the method has enough of an upside to pursue. Once you have the upside of the method in place, apply it to the market and follow the procedure mentioned above to determine your maximum risk level. By managing your risk level, you will be able to determine what your win/loss ratio is likely to be and you will also be able to determine what your risk/reward ratio is likely to be. This information is what you will use to establish the initial stop that you use for your method. The result will be that, by employing the given method, you will know that it is likely to win X% of the time with a given risk level and a given risk/reward ratio. Determining and managing the potential downside in this manner will allow you to see how good the method really is and if it is likely to provide enough of an upside to make it a good method.