ETF Trading – Part 2

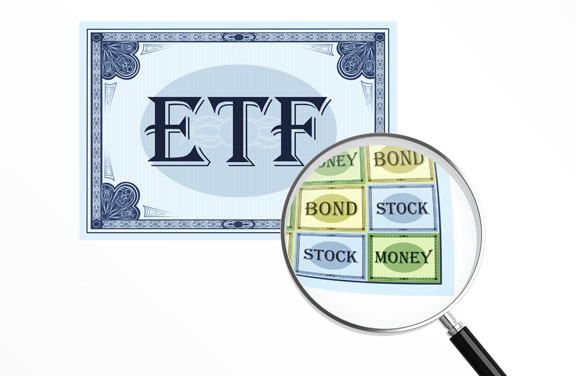
Last week I discussed Exchange Traded Funds, what they are, and how they work. Today, I would like to continue discussing EFTs and how best to trade them. Here are a few rules that I will lay out to help with successful trading of ETFs.

Order Entries

First, when trading an EFT, use limit orders to enter the trade for the best executions. One of the advantages of trading EFTs is that you can use pending orders unlike trading mutual funds. If the ETF you want to trade has a tight spread you can go ahead a use a market order if you are closely watching the market. However, if you are not closely watching the market or the EFT you want to enter has a larger spread, I would recommend that you use a limit order. This will only enter the trade at the price you are willing to pay or better. This allows you to trade in the market without needing to “babysit” the market waiting for the best entry. The downside to using a buy or sell limit order is of course you may not get filled at all on the trade if the market doesn’t trade at that level and you might miss an otherwise good move in your favor. This generally is a tradeoff I would be willing to take, so that you don’t get in the habit of paying to high of a price for your trades.

Avoid Trading ETFs on Volatile Days

On days when the market is more volatile, like days when major news events are happening should be avoided. On more volatile days, the bid/ask spread will likely widen making the trade not as favorable. Also on more volatile days, you may find the volatility will take you out of the trade at a stop loss just before the trade moves in the direction that was originally expected, leaving you with a loss while the trade eventually went in your favor. The days would include days when the FOMC statements are made and especially the monthly Non Farm Payroll release, on the first Friday enough.

Trade ETFs with Good Liquidity

The best ETFs are the ones that trade with better deliberate trading patterns. These ETFs include the ones with good trading volumes and tight spreads. Generally, higher volumes translates into better liquidity which allow for better trading executions. For example the major equity index funds such as the SPY, generally has very good liquidly.

Transaction Costs do Matter

Pay attention to the transaction costs. One of the quickest ways give our money away is by paying high brokerage commissions. You really need to understand how much you are paying for your trading fees; both entry and exits, especially if you have a smaller account with smaller position sizes. In smaller positions the transactions fees become a larger percentage of the trade.

Conclusion

ETFs are a great investment vehicle for many traders looking for good opportunities to trade. But as with any trading, there are smarter ways to do this. These keys outlined above are part of what I refer to as rules that make up some EFT best trading practices, so setup your trades, with limit orders, avoid volatile trading days, focus on high liquidity and low transaction costs to make your ETF trading as profitable as possible.

Does It Really Have to Come Back Down?

The old saying “what goes up, must come down” doesn’t seem to be applying to the stock market much lately, at least it hasn’t over the last few weeks. Everyone seems to be interested in why this is happening. There are so-called experts that are trying to analyze everything from gold to foreign economies to get a feel for what the US stock market may or may not do. Other than pure curiosity or getting educated for future reference when this happens again, I’m not sure that traders and investors should necessarily care why this is happening; they just need to know that it is and ride it for all it’s worth. At some point, it seems as though you should stop thinking and asking questions and just enjoy the ride. The only questions at this point are when do you get out and when will the ride be over?

Though it hasn’t happened yet, and there are no real signs of a turnaround, we still need to recognize the “what goes up, must come down” saying because it isn’t really just a saying when it comes to the stock market, it’s an actual fact. When put simply and applied specifically to the stock market, it is just saying, “the stock market will rise and fall”, based on the history of the stock market, how it is designed, and what it is intended to do; this is a fact. So briefly reviewing the situation, we know that the stock market has risen a lot over the past few weeks, making new all-time highs in the indices. We know that there isn’t an obvious end in sight, though it could be argued that there is no real reason for this to be happening based on corporate earnings, recent statements by the Fed, and recent economic data. So what do we do about it? I say we milk it for all it’s worth, while keeping your finger on the sell button and then get out and take cover.

The question regarding how we know when it will end is somewhat subjective in the respect that everyone will have their own exit criteria and exit strategy. There are as many strategies for exiting a trade as there are for entering one. It’s just that many people want to get as much of the current move as possible – this is fine, just don’t get greedy. All you really need to do is to watch the indices if you are trading or invested in something that mimics one of the major indexes; when they show signs of weakness, get out. If you are invested in individual stocks, which may or may not be moving right along with the move of the overall market, when the major indices begin to show weakness, move your stops up tight and get ready to exit when the issue you’re invested in begins to show weakness.

What specifically is a sign of weakness? It could be an advance bar that closes below yesterday’s low, it could be a shorter-term average that crosses over a longer-term average, it could be when the low of the last X number of days is breached, it could be when your favorite technical indicators tell you to get out or it could be as simple as the first close below a given moving average. How you choose to exit and the exit method that you use is not necessarily the point; the point is to get ready to use it because, even though this ride has been fun and it may be the difference between a good, profitable year and just an okay year, the fun will end at some point, so we need to be prepared and plan our escape well in advance.

SPDR Gold Trust

Today we are going to take a look at what gold is doing by looking at the SPDR Gold Trust daily charts. The symbol for this is GLD and the price action on the chart will closely follow the direction that gold is moving. As you can see, the direction price has been moving since July is down. The question is how much longer will it go down and how long will it take to get there?

This week we have seen quite a bit of news happening including interest rates over in Europe, elections here in the US and on Friday the Nonfarm employment changes. With these events, we have seen some strong moves in gold to the down side. The chart shows a movement down from the 130 area down to the 110 area. Currently, it is sitting at the lowest levels since April of 2010 and has broken prior past lows. You can also notice the gaps that have happened in the past week so the momentum has been very strong to the down side. Often times, when there are gaps, we will see the price move back up to close the gaps. Keep this in mind as we may see the price try to move back up once again.

In this next chart below, we are looking out at a longer time frame using the weekly charts.

With price breaking below the longer-term support area, we have some evidence on the chart that the price may continue to move lower. Often times, the price moves to certain areas and can bounce off these support levels multiple times. Once these areas of support are broken, the price may continue to move lower. In addition, after the breaking of the support, this area can then act as a level of resistance. Because of this, we will be watching to see if this happens.

As with any chart movement, we want to identify several things to know what may happen. We need to look at the trend that the price is moving, we need to look at identifying support and resistance, and we want to see what the current momentum is doing. Knowing the longer-term trend as well as the shorter-term momentum can give us insight into when we may want to enter the trade. As we see these price actions happening on the chart, we can then use support and resistance to help identify where we should place our stops and our targets. With gold, keep an eye out for some continued longer-term downward pressure, as well as some short-term bullish momentum. Take some time to review the charts both on the longer-term like we saw today and then on the shorter-term to identify some possible entry point to take trades. Gold is an important instrument in the market and by knowing what it is doing, we can get a better idea of the strength of the overall market in general.

ETF Trading – Part 1

Today, I am going to discuss one of the fastest growing segments of the market, the Exchange Traded Fund (ETF for short) market. To start with; what is an ETF and how does it work? As the name implies, an EFT is a Fund that at the most basic level is a basket of securities (that make up the fund) that are traded just like individual stocks on an exchange. EFTs can track any of the major indexes, like the large cap Dow 30 and S&P 500, to smaller cap indexes like the Russell 2000 for example. In addition to equity index fund, there are a large variety of EFTs that track with Bonds, sectors, industries, counties, and even commodity assets.

The ETF’s look very similar to mutual funds as they are a fund that holds a group of underlying securities. However, there are some very important differences between EFTs and Mutual Funds. One of the most important and obvious differences between ETFs and mutual funds is the process of buying and selling the fund. Mutual Funds are purchased and the then the value is calculated based on the daily close. With EFTs, they are purchased any time during the market hours on the exchange just like any stock, and the value is moves with the market in real time, instead of just on a daily basis. The real advantage to this is that you can enter or exit the EFT at any time during the market just as you would any other exchange traded security, including using trading orders like stop loss orders, profit targets orders. Also, pending entry orders such as buy or sell limit or buy and sell stop entry orders can be used in addition to real time market orders. This allows you to trade with a variety of trading strategies that have never been able to be used by traditional fund traders. Since you are trading the fund on an exchange there is an accompanying transaction fee, like any exchange trades security, however there are no “load” fees or percentage fees like many Mutual Funds have.

The EFTs are valued in real time as the market for those securities in the fund move which is then translated into a share price for the EFT like any other stock or bond for example. Therefore the share pricing is generally determined by the supply and demand for the underlying securities that make up the fund.

Another of the big advantages of EFTs is the wide variety of ETF’s available to trade. These ETFs are brought to market by a number of different sponsoring fund companies, like SPDRs, iShares, Diamonds etc. Each of the companies then puts together different EFTs to track the wide variety of broad indexes like the Dow 30 or S&P 500 down to more narrow market indexes like different sectors like Real Estate or Financial and even different industries. Also available in the EFT universe are bond ETFs and commodity EFTs like Gold and Silver that make investing in some of these areas easier than ever before.

In conclusion, EFTs should be understood and explored by any serious traders because of the ease of execution for investing in the funds and the wide variety of different funds available, giving the average trader more flexibility than ever has been available with plain old mutual funds.

Happy Trading!

Trends and Pullbacks

In our article today we are going to address the ideas of trends, pullbacks or retracements. As we begin to analyze a chart one of the first things we need to identify is the trend. To keep it simple we will consider the trend as the longer-term direction that the chart is moving. This longer-term movement is considered by many traders to be the strongest bias for price movement. If the daily chart is moving up then we would say it is in a bullish up trend. The trend can be defined on each chart we are looking at and can be different depending upon the time of the chart. For example, we can see an uptrend on the 1-minute chart while at the same time we can see a downtrend on the hourly chart. In the chart below you can see the longer-term trend identified on the 4-hour charts.

In this example, you can see a downward channel formed by the two red lines. This shows us that the longer-term bias of the price action is to the downside. This would show us that looking for bearish trades would put this trend in our favor.

When a chart is trending up or down it will experience times of retracements or pullback within this trend. These are normal price actions that happen which move counter to the prevailing trend. As we identify the pullbacks and retracements we can find good times to enter a trade. In the chart below you can see an example of several pullbacks within the overall up trend.

The green line represents the overall up trend while the four red arrows show were the pullbacks are happening. When we identify these areas we can know that the price is setting up for a possible entry. It is important to identify these areas regardless of the method we are trading.

In addition to looking for the trend and the pullbacks or retracements it is important to know how to identify when these are changing. For example, if we can identify when the trend is changing we can know when to go from bullish to bearish or bearish to bullish. At the same time when we can identify that a pullback is changing we can know when to enter the trade in the direction of the longer-term trend. This can be as simple as looking for the price to change direction or we can use and indicator such as a moving average and watch for it to move up or down. There are many different indicators that you can use to help in identifying the changes.

Take some time to look at your charts and begin to identify both the areas where the price is trending and where the price is experiencing a pullback or retracement. Knowing both of these areas can help us identify the direction we should be trading as well as the best times to go long or short.

Benefits of a More Loosely Defined Approach

One of the most difficult and confusing things about trading is knowing when to take your profit and knowing when to let your positions run. There are only a few good entry points in most trading situations but bad timing when exiting a trade can turn what otherwise would be a good trade into a mediocre or bad trade though a good exit could make an average trade a much better trade. Unfortunately there is no perfect way to exit trades. The reason for this is because the market does not always act the same way so using the same exit strategy on every trade may be a good exit on some of the positions but it will be less advantageous on others. This is just as true for long term investors, exactly when and how long term positions are liquidated can be the difference between a successful trade and a less successful trade. One of the main reasons that the same exit for every position will not always work out well is the same reason that a given trading method will not work in every different type of market. A specific trading method and a specific exit strategy are both static systems but markets are not static systems.

The market is moving and fluctuating and gyrating up and down and reacting real time to what is going on in the world around it while the method and the exit strategy do not change, they look for the same exact thing over and over again until they find it. The problem is that when they do find what they are looking for even though the proper criteria has appeared it does not mean that the price action will act in the predicted way. Since markets are not static systems they will not always act in predictable ways so applying the same entry method or exit strategy to every type of market would be akin to having a round peg and trying to place it in holes of various shapes. When we find a round hole it works great but it works less well on an oval hole and not at all on a square or triangular shaped hole. Basically it’s like we are using the right tool for a specific job but not all jobs are the same job so we either need variety of different tools or a better universal tool that will work for many different types of jobs.

The classic definition of crazy is doing the same thing over and over again while expecting a different result. Often times it seems as though traders apply the same exact principle over and over again to different types of markets while expecting a winning result each time even as results vary widely from one event to the next. It isn’t that the traders are necessarily crazy but it could be argued that their actions are, or at least a little bit.

The more complicated a method or an exit strategy is the more narrow it will become which means that it is more pinpointed making it work in very specific situations but not in a wide range of situations, conversely a more broad based approach or an approach that is flexible and has the ability to work in a variety of market types is likely to have a higher success rate. The longer you look at price charts the more you will see and if you watch price charts long enough you will see that there are very specific patterns or price movements that reoccur time and time again that are not necessarily connected to anything else other than the price action itself. You will notice that when you see one of these moves where the price action goes from the move isn’t perfectly predictable but there is a high probability that it will go in a given direction or to a somewhat predictable level before it goes in the opposite direction. If the method is more loosely defined it will fit into a variety of situations providing much more latitude and likely more trading opportunities while very possibly being much more accurate. It sounds counter intuitive but the more indicators that one uses and the more tightly defined the trading method is the less accurate it may actually be. I use as few indicators as possible and the less I use the better my results are. The price action itself will tell me more than anything else so applying allot of indicators to a chart or having too many rules around entries and exits clutters everything up making me far less effective.