This is a concept that should be in any trader’s ETF Database: Professional traders use stop losses!  Why?  Well, because they know that protecting their money is the most important thing they need to do.  Today I want to spend a few minutes discussing some of the more important concepts in regards to Stop Losses.

Now that we know a stop loss is used to help protect our money and something that professional traders use, we need to define exactly what a stop loss is.  A stop loss is a tool that is use to limit the amount you are willing to loose with any trade you enter.  The stop loss is set at a point where you would not anticipate the price moving to, based off of your current entry signal.  If the price moves to this area you would want to exit the trade with the stop loss and incur your pre-determined loss amount.  Even though we do not like to take losses, it is important that you take them to protect the rest of your account.  Holding on to a loosing position can become very costly. 

There are several things to look for when trying to decide where to place a stop loss.  Take a look at these things to see if they can help you better identify where to place your stop loss.

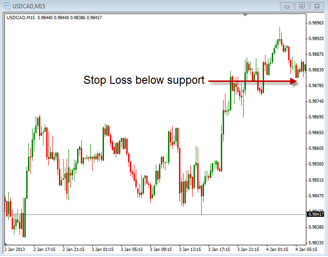
1. Look at the Support or Resistance areas.  The stop loss should be place below the support level for a buy and above the resistance level for a sell.

In the chart above you can see that the trend is moving up and the stop would be placed just below the area of support.  This is critical because if you place the stop above support you have the possibility of getting stopped out before the support can be tested.

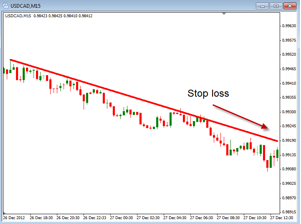
2. Look at trend lines.  Trend lines, like support and resistance, can give a good visual as to where to place the stop losses in both an up trend and down tend.

Here you can see that the tend line is moving down and the stop loss can be place just above this line.  This would be at an area where you would not anticipate the price going if you shorted the pair.

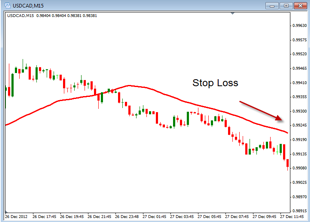
3. Moving Averages.  You can use a Moving Average to help you know where to place your stops in both an up and down trend.


Notice how the trend line and the 40 period Simple Moving Average are very similar in where you would place the stop loss.

Regardless of how you determine where to place a stop loss the most important thing is to actually have one.  Too many traders, both new and old, do not use a stop loss which can cause them to be placed in a large amount of risk.  This risk can cause the account to take huge losses if the stop in not used.  The goal is to keep our risk at appropriate levels and using a stop loss can help you be consistent with that.
Today, I would like to discuss the use of the Fibanacci Retracement technical indicator that many beginning stock traders use to trade stocks, futures ETF’s, etc.  The Fibonacci retracement pattern can be useful for swing traders to identify reversals on a stock chart. Looking at stocks for example, once they have moved up or down in a trend, have a great tendency to move back or retrace a certain amount, rather than to move in a completely straight line or direction up or down. Because of this common retracement pattern, stock traders use the Fibonacci Indicators as reference points to predict certain retracements levels as the stock moves back and forth in a trend during a retracement or “pullback”. You will find Fibonacci levels to be very accurate when analyzing chart pattern reversals. Fibonacci indicators also provide an excellent visual map and identify very accurate support and resistance levels. Some Stock trader’s will also combine Fibonacci Retracement levels  with common candlestick patterns to identify optimum entry and exit points.

An effective candlestick pattern trading method is to look for small double bottoms or double tops and individual doji or shooting star or hanging man type reversal candle patterns within these Fibonacci levels to identify trading opportunities.

Fibonacci levels are where price retracements or “congestion” often form. Just like moving averages, the Fibonacci levels work like price magnets to old highs or lows and can also form good support and resistance levels. For an even greater degree of accuracy they can be combined with the major candlestick patterns

The most common Fibonacci levels used in technical analysis for drawing Fibonacci lines are 62% (61.8% rounded up), 38%, 24% (23.6 rounded up) and 50%. For existing trends, the 24% level should be the minimum retracement but can go down as low as the 62% level. As price retraces, support and resistance occurs at a high rate near the Fibonacci levels. In an existing rising trend, the retracement lines move down or “retrace” from 100% to 0%. In an existing downtrend, the retracement lines move up or “retrace” from 0% to 100%

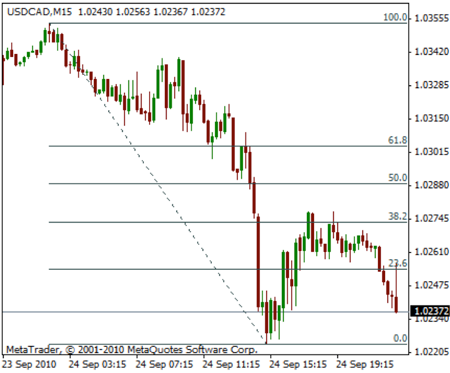
You can see in the USDCAD chart above that the retracement retraced to the 38.2% level before continuing the downward trend.

Technical Traders use these Fibonacci Indicators (Fib-lines or Fib-levels) to predict Price Targets and Support/Resistance Targets. To accurately draw the lines to identify these patterns you begin drawing from the lowest point (which equals your 0 percent line) to the highest point (which equals your 100% line). The 38%, 50%, and 62% lines will provide your reference point for targets.

While there is no “crystal ball” and nothing can predict the future with 100% accuracy, but using the Fib-levels can greatly enhance your ability to be in profitable trades. Adding the candlestick signals provide a great advantage for being able to immediately recognize what is going on with investor sentiment at these levels.

Traders Challenge:  Over the next few days, add Fibanacci levels to your stock charts and study the retracements, along with common candlestick price patterns to help identify support and resistance areas and potential entries.

I have been stock market trading for over 30 years; I opened my first stock market trading account on the next business day after I turned 18 years old.  I have made many observations about the market in general but one of them that to me is as important as any of them and may actually be one of the most important is the real impact of a flat market on our ability to increase our wealth over a long period of time.  The reason that this came up for me is because this past month is a perfect example of what a flat month can do to an investment portfolio.

The S&P 500 closed on October 31, 2012 at 1412.16, it closed one month later on November 30, 2012 at 1416.18.  Throughout the month the index created nearly a perfect V shape with a swing low occurring on 11/16.  If you had taken a long position at the beginning of November and held it for the entire month or if you took a short position at that same time and held for the entire month either way you were about even.  The only real way to have increased your wealth during this time was either to have sold at the beginning of the month and closed the short position in the middle of the month or to have bought in the middle of the month and rode the right half of the V back up.  Either way this would have been allot to ask for from the average investor though some may have achieved it.

Investors that are dollar cost averaging into some type of a longer term investment did not receive any benefit from the market in November either because the shares they purchased at the beginning of the month would be worth about the same at the end of the month and the new shares that they purchased at the beginning of December would still have about the same value.  If you were a long term buy and hold investor the impact of last month does not look that significant because it was a break even month but there is definitely a cost to a prolonged flat investing period.

The reason that a flat month like we had in November is devastating is because it robbed us of time.  Time is not a renewable resource, once it is spent it is impossible to regain.  Having a flat portfolio for a month does not sound that devastating but how many months does that actually happen and more importantly how many years does that happen.  Each month and each year we hope we get closer and closer to our financial goals, whatever they may be, but a flat return in our portfolio over an extended period of time not only robs us of wealth building time it may move the realization of the financial goals that we have out further and further into the future.

If you are investing for retirement, which may be a long term investment, and you will have to rely largely or solely on income from your investment dollars for survival during your retirement years if you have a flat time period during your saving and investing life it could actually move your retirement out at least a year and it could impact your standard of living during retirement.  Adding up all of the months and years of flat returns and negative returns and you will see that retirement may get pushed out further and further into the future.  This may not sound like that big of a thing right now but what happens when you review your portfolio a few years before you were hoping to retire and you realize that it will be impossible to meet your retirement goal on your projected retirement date?  How far out into the future are you willing to push your retirement and other financial goals due to a lack of solid investment returns and keeping lazy dollars on hand that are either non-performing or underperforming?

I was working with some Exchange Traded Fund (ETF) traders today, and we had an interesting side conversation. We talked about how important of a role our emotions play when we trade. Not what we discussed is relevant for any kind of trading, stocks, ETFs, forex… you name it. No matter how you slice it, controlling your emotions will be crucial to your success. So, let’s discuss some of the problems that occur with our trading emotions.  Emotions are a natural part of us as humans so it is something that we all need to deal with.  Emotions are good but can cause us to act poorly when it comes to Forex trading.

I don’t want to talk about specific types of emotions but rather the range of emotions that can occur when trading.  This range of motion is enhanced by the fact that we are dealing with our own hard earned money.  When we are dealing with the emotions of making or losing money this can push our emotions to the extreme levels.  These extreme levels can be the cause of poor decision making when trading.

The two extreme range that can happen with us as we are trading go from extreme happiness to extreme sadness.  These may not be the best way to describe it but hopefully you get the idea that our emotions can range from one extreme to the next.  This fluctuation in emotions can occur over a very short term or can take a long time to develop.

Let’s first describe what happens when the emotions go to the extreme on the happy side.  This might sound like a good thing but can become a negative issue.  As one experiences success or temporary profitable trades our emotions can move to the extreme of happiness causing us to think we are very good at trading.  This may be true but it also may be the result of a lucky or unplanned trade.  Sometimes when we are successful by chance we feel it is because we are trading well.  If our success is the result of trading well we will have long term success, not just temporary wins.  This false sense of happiness is because we got lucky it will cause us to make poor decisions going forward.  This is the type of trader that has a lucky trade, then goes around bragging about how much they made or how great a trader they are.  Sometimes even jumping up and down and singing a happy song.  If you see someone like this you know that it is likely that they are showing signs of the lucky trader.  If we begin to act like this we need to evaluate the reason why we are so happy to make sure it is because we are trading well and not just that we got lucky one time.

The second extreme is extreme sadness.  This is when we have taken loss after loss or when we have taken a loss that was more than we anticipated because we did not close the trade when we needed to.  By not following our rules we do things that make us unprofitable.  This profitability can lead to extreme unhappiness.  In addition, the poor trading leads to more poor trading and we loose confidence in our own abilities.  If we are sad in the end we will stop trading all together.

So, as our emotions go from extreme to extreme we experience a roller coaster ride of emotions.  These emotions usually  make us trade poorly.  But what may be even more damaging is simply swinging from one extreme to the other.  This can cause us to not enjoy our trading and ultimately, even if we are profitable, cause us to stop trading.

The solution to this roller coaster ride of emotions can be many but one thing that needs to be done regardless is to have our rules outlined and we need to follow the rules we are using.  If we can do this we will never be in a situation where we take huge winners and huge losers.  So if you’re trading ETFs, or anything else for that matter, we will be consistent in our trading and our emotions will stabilize so we can develop longer term success as a trader.  Have your plan and trade it!


Today we are going to talk a bit about the idea of “Myopic” trading and what it means to Gold traders, or any trader for that matter.  You may ask yourself, “What is Myopic trading”?  Well, let’s first start by defining what the word myopic means.

MYPOIC = nearsighted, shortsighted, unwilling to act prudently, narrow-minded, lack of understanding.

This should give you an idea of what this word means.  We could probably add other terms to define this but I think these define it well enough for what we need.  As we add this word to “Trading” hopefully we can see some problems that might arise.  As traders, if we become “Myopic” in our trading or in other word shortsighted, we can run into many different problems.

It does not matter if you are trading Stocks, Options, Currencies or Forex, Futures or Gold and Silver this can be a problem for any trader.  As a trader looses sight of the “big” picture they can become near or shortsighted in their decision making process.  As we become so focused on one aspect of our trading we can miss seeing what is really happening.

For Example, some traders will want to be in a trade so bad that they will avoid seeing the obvious things that would keep them out of a trade and only see what they want to see to get the into the trade.  They may look only at a specific indicator, like the stochastic indicator, and see that it is moving up so they buy.  They won’t look at or the avoid looking at all the other things that might tell them to stay out.  So even though the trend is down and they are sitting at resistance and there is news coming out and it has just been downgraded they will still buy it because of one thing they see.

The other issue with being myopic in our trading is that we end up holding onto trades that we should be closing out.  Again, even if everything is telling us that we should close the trade we will find the one thing that tells us to stay in it.  This occurs often times when we enter a trade long and it move down and we are loosing money.  We don’t want to loose the money so we hunt and find the one small thing that says we should stay in it, even if we have 10 major things that tell us to get out.

This is where having your rules clearly outlined and defined can help you.  Understanding and knowing all your rules for entry can keep you from becoming a myopic trader.  Take time to review what you are currently doing to see if you have developed the bad habit of trading myopically.  If you have, go back and review your process for deciding when to take a trade and for getting out of a trade.  Make sure you are aware of the possibility of myopic trading and if you find yourself avoiding the obvious things, stop and reassess your decisions.  Looking at the big picture will help you to make the right decisions in your trades.