20150601_inside-01Hi, my name is Bill Poulos.

These days I’m the co-founder of Profits Run and I’ve taught my unique trading methods to over 50,000 traders worldwide.

But, many years ago, I was a wet-behind-the-ears rookie trying to figure out a way to make money in the markets. Today, I’m going to share two of my biggest failures with you. Because I hope you’ll learn from my profit-killing mistakes.

Big Fat Failure #1: The Time I Lost 30% In A Heartbeat

I first got interested in the stock market when I was a student at GM Technical Center. I’d done a bit of paper trading and I was excited to get started with real money. So a group of friends and I created an informal investing club.

We poured through every newspaper, chart, and research source we could get our hands on. And, eventually, we found six top-performing stocks that we thought were no doubt home runs. From that list, we narrowed it down to the surest of the bunch, a stock called John Blair.

We pooled our money and bought in. We were giddy with excitement. Can you guess what happened next? Almost immediately after we bought in, the stock tumbled and, by the time we got out of the trade, we’d lost 30% of our cash.

Note:

This is a perfect example of an easily fixable mistake. Or what I call a “Profit Killer”. I’ve created a free, unusual 15-second quiz that pinpoints your #1 profit killing mistake. Take the quiz here.

(A new window will open so you won’t lose your place on this page.)

Big Fat Failure #2: How A “Hot Tip” Completely Wiped Me Out

Apparently, losing 30% of my money wasn’t enough to get me to quit. So this time I decided to talk to an “expert”. I was working at GM at the time and heard around the watercooler that “so and so” up on the 14th floor does pretty well in the stock market. (Forgive me, it’s been a few years, so I can’t remember his actual name.)

I went up to talk to him about my next move. “Buy stock in Steel Crest Homes. As much as you can get your hands on!”

Apparently, this “expert” knew something I didn’t. His enthusiasm was contagious and I too became convinced this stock was primed to soar. Only problem was, I didn’t have any money left. So I borrowed $1,000 from the Chrysler Credit Union and sunk it all into Steel Crest Homes.

I locked in my trade at $1.50 per share.

Can you guess what happened next?

Almost immediately, the stock tumbles down to 75 cents per share. I’ve already lost half my money. Money I had to borrow in the first place! So I head back to this “expert” on the 14th floor.

“Buy more!”, he tells me. His faith is unshaken. He still thinks this stock is headed to the moon. So I go back to the credit union and borrow $500 more. I put all $500 into Steel Crest Homes.

This time I didn’t lose 30% of my money. I lost it all. Because, shortly thereafter, Steel Crest Homes filed for bankruptcy.

The Single Most Important Thing I Learned From These Humiliating Failures

I can look back at these losses now and laugh. But, at the time, these failures hit me like a kick in the teeth. Thankfully, the lessons I learned from these failures paved the way for my future successes.

After 40 years of trading, I’ve discovered that there are 7 different profit-killing mistakes that can sabotage your success in the markets. I’ve shared here two of my biggest profit-killing blunders. But I want to make sure you don’t repeat my mistakes. So I created an unusual 15-second quiz that pinpoints and eliminates your #1 profit-killing mistake. It’s 100% free. Take the quiz here.

If you want to share your past trading failures, feel free to leave a comment below. Trust me, it feels good to get it off your chest.

Thanks for reading!

Wouldn’t it be great if you could look at a stock chart and know for sure that the price was about to go up?

Of course, that’s every trader’s dream. It’s what every newbie and experienced trader alike are on the hunt for every single day. It’s also one of the most difficult things to do.

And while it’s impossible to predict what a stock is going to do 100% of the time, there are 3 telltale signs anyone can exploit to increase the odds dramatically of knowing when this is about to happen.

In this short article, you’re going to learn these 3 signs, along with 3 specific techniques you can copy to help you predict when a stock’s price is about to rise.

To begin, one of the most difficult things for any trader is to try and determine when a particular stock has ‘bottomed’, or reached its low point and may be headed for an upward trend.

Of course, everyone wants to buy low and sell high, but if you consider that a stock’s price can be influenced by many variables, such as macroeconomic, political and economic events, being certain that a stock has bottomed is an intimidating task.

Unfortunately, there is not a realistic expectation that you are going to find a way to know for sure what the price will do in the future. Always keep in mind that “expect” is the key word here; no one knows for sure if a stock will move higher.

You need to fight through all the information, noise, hot tips from media personalities, or friends (who themselves are just guessing).

Without discipline, risk management, sound trading methods, and some useful trading tools, you may as well be gambling in a casino.

First, you have to determine your trading time frame: short-term (20 days), intermediate-term (18 weeks) or long-term (18 months).

Depending on your time frame, you can use the following charts:

  • Short-term – Daily
  • Intermediate-term – Weekly
  • Long-term – Monthly

The first requirement, in reviewing the charts, is that the stock must already be in an uptrend; trying to pick the bottom of a downtrend is foolhardy. This requirement, paired with using simple techniques, which I’ll get into below, can help you identify stocks that are very likely to move higher.

With that being said, there are some very useful tools that you can place on your charts to have a reasonable expectation that the price should continue to move higher.

Many traders make their trading decisions based on subjective information, whether it’s from them guessing or having a “gut” feeling or they are listening to what someone else thinks may happen.

One of the most important things you can do as a trader is to develop a process of objective criteria in your trading. This objective criteria gives you a definitive way to say something is happening on the chart, without having to guess.

As a trader, if you can create a step-by-step process of evaluating your charts, you can begin to gain the confidence and consistency you need to make your trades.

So what are some of the more objective things you can look at to decide if a stock is going to move up in the future?

Here are three things that you may want to start using to help identify if the price wants to move up:

Telltale Sign #1: Price Action

This might be the most simple, yet effective, way to identify if price is going to move up. Price action is the key for all other indicators. If there were no price action, the other indicators would be useless.

The first thing you can look at is to make sure that price is making higher highs and higher lows. The stock will not rise if this doesn’t happen.

Each bar has a bar-high, as well as a bar-low. As these highs are on the increase, you can see price action rising.

One way to confirm that the price is beginning to trend up is to look for an initial move in the price action, from making lower lows and highs, to making higher highs and lows.

For example, once the price action has put in 1 higher swing high and 1 higher swing low, you can be fairly confident that the new trend is forming.

Take a look at this chart below:

20150519_inside-01

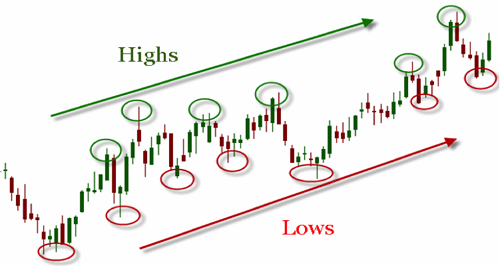
In this example, you can see the red and green circles, which outline the highs and the lows, both moving higher. When we see this type of price action, we can feel comfortable in stating that the price should continue to move higher.

In addition, if the price changes from this pattern, to now making lower highs or lows, you can know that the direction is beginning to change.

Copy This Technique:

An excellent buy point occurs in an uptrend when the market retraces 50% of a previous up move. To determine that level, you take the most recent high and add it to a previous higher low and divide by 2. That will give you the 50% retracement level. Strong support often occurs at the 50% retracement level where the uptrend then resumes.

Win More Trades Than You Lose By Eliminating This 1 Thing?

There are things you do when you trade that absolutely sabotage your chances of building wealth. We call these the “Profit Killers”, & there are 7 of them. Our free, 15-second quiz will reveal your #1 “Profit Killer”, & then show you how to fix it.

Click Here To Take The Quiz To Discover &
Fix Your #1 “Profit Killer”

(A new window will open so you won’t lose your place on this page.)

Telltale Sign #2: Moving Averages

This is another simple tool that you can use to help you know if price is expected to rise. Moving averages come in a variety of types: simple, exponential, and weighted, to name a few. In the example below, the simple moving average is being used. This will give you an idea if the price is trending up or not.

A simple moving average can be calculated by using the open, high, low or closed price. In this example, we will use the closed prices.

So, in order to calculate the 40-period moving average, you would add together the closing prices of the past 40 bars and then divide by 40. This creates the average price over that time period.

It shows you if those prices are increasing or not. While this does not guarantee that the price will go up, it is a good indication that the market wants the price to stay strong.

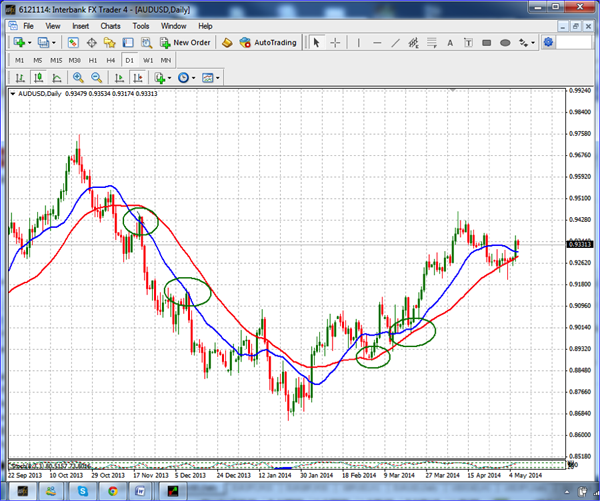
Take a look how this chart shows the red, 40-period, simple moving average moving higher:

20150519_inside-02

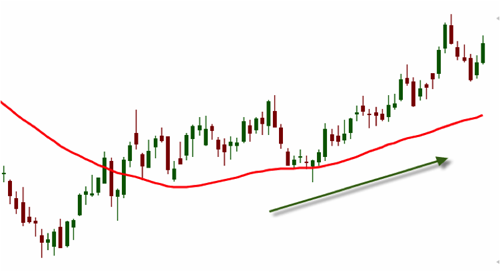
This indicates that the price is strong and is likely to continue rising, at least in the near future. Also notice that the price is above the moving average. This is added confirmation that the trend is strong.

Once the price moves below the moving average it may be indicating that the trend is weakening and you need to look for something else that is going to continue moving higher.

Copy This Technique:

When the 40 simple moving average is moving higher, an ideal buy point would occur when the market retraces to the 40 simple moving average line and then closes higher than the previous bar’s high indicating that the stock will probably resume its uptrend.

Telltale Sign #3: Envelope Channels

This is a tool that can help you better visualize the direction the price wants to move.

Envelope Channels are percentage-based envelopes, set above and below a moving average. The moving average, which forms the base for this indicator, can be a simple, exponential, or front-weighted moving average.

The top and bottom channel lines are plotted the same percentage above or below the moving average. This creates parallel bands that follow price action.

With a moving average as the base, Moving Average Envelope Channels can be used as a trend following indicator.

If the channel that the envelope forms is moving upward, then the price is likely to continue to move it the bullish direction.

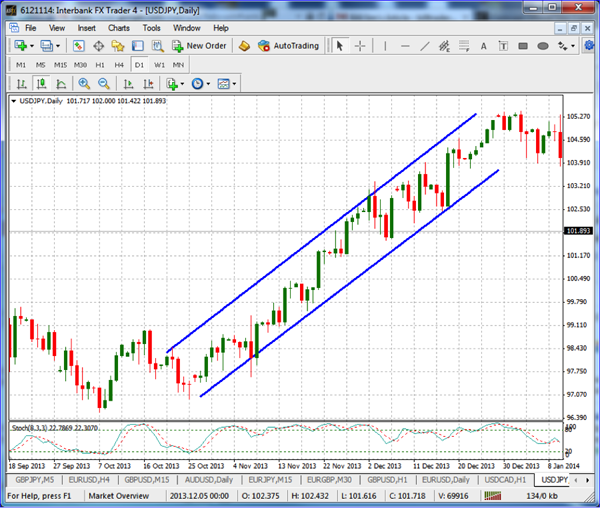
Take a look at the chart below to see how an envelope looks on the chart:

20150519_inside-03

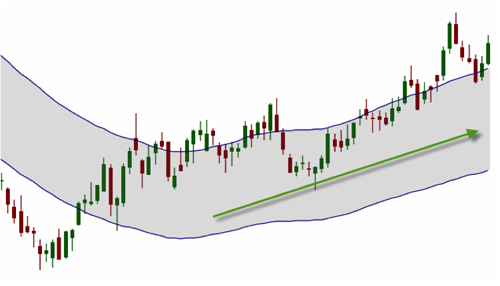
In this example, we have it set using the 50-moving average with a standard deviation of 10. You can make adjustments to these numbers, just be careful that you don’t customize it too much to make it look like you want.

This gives you a good visualization of the direction the price wants to move. An upward moving channel will represent a bullish moving stock.

As this channel changes direction, you need to be careful about continuing in a bullish trade.

Copy This Technique:

A high probability place to buy into an upward trending envelope channel is when the market falls back into the envelope to the center point, which is the moving average that the envelope is based upon.

Next Steps…

So there you have it! Whether you use price action, moving averages, or envelope channels, the key is to have an objective tool that will keep you from guessing what is happening. You should be able to look at the chart and have instant confirmation that the price action is strong and should continue to rise or not.

If you can trade when the price is likely to rise, then you are putting yourself in the best position to profit from that trade. Test out these telltale signs for yourself, copy and implement the techniques, and see how they can help improve your trading.

However, there’s a caveat to all this.

Even if you master these telltale signs and get really good at predicting when a stock’s price is about to go up, chances are that there’s something you’ve been doing in your trading that’s been unintentionally sabotaging your chances of having the potential to build real wealth in your portfolio.

It’s something that makes it almost impossible to consistently get ahead in the markets. I call these things the “Profit Killers”, and I’ve identified 7 of them.

But I also developed a free analysis tool that can pinpoint what your #1 Profit Killer is in about 15 seconds. Once you discover what it is, then it’s easy to eliminate it. And once you do that, your chances of winning more trades than you lose can skyrocket, almost immediately.

Go here to discover your #1 Profit Killer and learn how to eliminate it forever.

The on again, off again saga…

When will the Fed make the decision already to increase interest rates? By how much and by when? This has continued to be one of the dominating factors for the markets over the past few weeks. Every economic report that comes out makes investors update their best guess at when this will happen. It seems that, to an extent, the Fed is, basically, leading the markets around in circles on what looks like a wild goose chase. The question really comes down to whose fault it is…that is if you were interested in assigning blame for this. Is it the Fed’s fault because they are not being decisive or, at the very least, they are being secretive? Or is it the fault of the markets at large because they put so much emphasis on what the Fed says or does not say?

Trying to guess what the Fed will or will not do, to a large extent, seems like a big waste of time. We all know that, at some point, they will raise interest rates, if for no other reason than because they have to, but do we have to be held hostage until they make and announce their decision? I believe that the answer this question is a resounding, ‘yes’. The reason that I believe this is because it doesn’t really matter what the Fed does or when they do it, all that matters is that there are enough investors and traders that are active in the markets that believe that this is important. When it comes to the markets, perception is reality. So what investors and traders believe is real is what is real, regardless of if it is really real or even if it is anything that is important.

The best way to combat this is simply to acknowledge that the situation exists, taking it into account for our individual trading. We do not need to be part of the charade; we just have to be a witness to it, reacting accordingly to whatever they may do. There are plenty of other things going on in the markets to keep us busy, such as a few large mergers and some very intriguing Initial Public Offerings. There have been a few major companies that have just been made public over the past several months, some of which have occurred very recently. There have also been announcements by other companies with regard to new breakthroughs in medicine and fuel technology.

Greek tragedyThe Greek tragedy in Europe is another thing that is more than enough to keep us guessing and off balance when it comes the markets. It was only a few short years ago that a lot of people around the world wanted the Eurodollar to replace the US dollar as the world’s reserve currency. Now there’s never ending talk about the fall of the European Union. There’s no way to know or to predict what will happen in the future, but we do know that there has never been a successful unified union in the world’s history with a shared common currency that was not one sovereign nation. This leads a lot of people to not only question if the European Union will disband, but when will it officially disband. If Greece defaults on its debts, there could be a cascading effect throughout the union, with Greece being only the first nation to fall. There are plenty of others that have the potential to be the next, or even the first, if Greece does not default.

Russia and China are reportedly waiting in the wings, ready to help to pick up the pieces if they’re needed, but they both have a similar agenda, which is to end the US dollar’s position as the world’s reserve currency. A lot of people may not understand exactly what that would mean, and they may not believe that it matters much either way, but the truth is that the US dollar, being the reserve currency, allows the US to print as much money as they want to with little or no repercussions. If the US dollar were replaced by another currency as the reserve currency, it would have an immediate and lasting effect on the US economy.

As I pointed out above, there are a lot of interesting things to worry about and to pay attention to, other than chasing the Fed around, hoping that they’ll actually make a decision or share the decision that has already been made.

The debate is on…

Most investors are familiar with mutual funds, as they have been marketed for many years by the mutual fund companies and are part of or most people’s 401Ks and IRAs. However, Exchange Traded Funds (ETFs) have been around for over 20 years in the United States, but have not been marketed as heavily as mutual funds.

Mutual funds have also been perceived as the better investment vehicle for the buy and hold crowd, as they are considered a generally more passive investment.

In the last few years, many investors have turned to EFTs over mutual funds because they have many of the same characteristics of exchange trades stocks and, therefore, can be more actively traded.

I won’t go into a long discussion about the benefits of active swing trading over buy and hold investing. However, if you look at the overall market, it has been much more favorable for swing trading over the last 12-14 years or so, and have just recently risen to the former levels of 1999 prices.

So to lay it out simply, investors who bought in 1998 or 1999, and have held on to their mutual funds, have lost more than a decade of growth versus a more active swing trader who may have been able to take advantage of trading ETFs.

Here are the main reasons to buy ETFs over mutual funds:

Trade Like Stocks

  1. They Trade Like Stocks

When a new investor buys shares in a mutual fund, he or she pays the end of day NAV (net asset value). Since ETFs are traded on the exchange, they act just like any individual stock issue and can be purchased any time at the current price during the market hours.

Cheaper

  1. They’re Cheaper

The management fees are generally less in the ETF world, as they just need to pick the basket of shares that follow their sector or specialty, and are much less likely to have highly paid fund managers acting as expensive stock picking gurus.

Allow Flexibility

  1. They Allow for Flexibility

When an investor purchases shares in ETFs, unlike mutual funds, they may use the same kind of orders used when purchasing individual stocks, like pending limit orders, pending stop entry orders, stop loss orders, and take profit limit orders, just like stock trading. This ability to trade an ETF just like a stock is a great advantage for more active swing traders, allowing them to apply many different trading strategies to their ETF positions, something that just can’t be done to mutual funds.

Lower Barrier to Entry

  1. There’s a Lower Barrier to Entry

In addition to applying order types, with ETFs, an investor can also buy long or sell short any number of shares that s/he would like, even down to one share if desired. This is a real advantage for the investor with a small portfolio, as many mutual funds have much higher minimum purchasing requirements.

Optionable

  1. They’re Optionable

For investors with experience trading options, you can trade puts and calls on many ETFs, just like any other optionable stock. These are not just for buy-and-hold investors, the active trading community has also embraced these financial vehicles thanks to their ease-of-use and unparalleled liquidity.

These are the main differences between traditional mutual funds and ETFs, as well as advantages of owning an ETF versus a mutual fund.

So if you’re an active swing trader, or even a more long-term investor, are these compelling enough reasons to look into ETF trading?

Do you like losing money?

Of course not! Who does? So stick with me as I explain a very crucial concept if you’re going to be trading.

One of the most important aspects of any trading method is the use of risk control. After you determine the amount you are willing to risk, you need to know how to apply it through the use of a stop-loss. In the simplest terms, a stop-loss is used to prevent you from losing any more of your capital. It is one of the simplest tools that can make all the difference in a trade and almost everyone can benefit from it.

What is a Stop-loss?

Stop-losses are used when trading stocks, option, futures and forex, so it is important to know how to use them correctly. Generally, a stop-loss is an order placed at the time that the trade is entered. It is a tool that is used in trading that will allow you to control your risk by exiting the trade once the price moves against you by a certain amount.20150327_inside-01

When entering a long position by buying the stock or currency pair, you will place the stop-loss below the entry price. When entering a short position by selling the stock or currency pair, you will place the stop above the entry price. The place where you enter the stop will usually be above or below the prior levels of resistance or support. Once the stop-loss is in place, you can then calculate your position size based off of the risk you are willing to accept in the trade.

The Good and The Bad

As you begin using stop-losses, you will recognize that there are some good, as well as bad, things in using them. One of the good things is that it can give you peace of mind knowing that you have limited your risk. Another good thing is that you don’t have to sit and watch your trades all day. The stop-loss will close your trade even if you are not there.

One of the bad things is that you don’t always know for sure where the best place to put it will be. Sometimes a quick move, even if only for a short time, can make your stop trigger and you will get out of the trade only to find that it continued to move in the correct direction. Another potential bad thing is that if the stock gaps down, you may have a bigger loss than what you expected. With a stop-loss, the trade will be closed at the next available price and if that price is lower than your stop price, it is where you will get filled.

Trailing Stop

One benefit that many brokers and dealers have on their trading platform is a trailing stop. This type of stop is one that moves as the underlying price of the stock or pair moves. Generally, if you set a trailing stop, you will do it to lock in profits as the price moves in a favorable direction. If a stock initially has a $1 stop-loss, and you are trailing it, the stop-loss will continue to move behind the price by $1. This means if you have a $5 move, the stop will now be set so if it is hit, you have locked in a $4 profit.

No matter the type of trader you are, a stop-loss needs to be part of your overall trading plan. By using a stop-loss you can have the confidence that you are limiting your risks as you trade. Although there are potential problems with using a stop-loss, it is still better to use them than not. Take time to practice using stop-losses as a form of insurance and so you can have more confidence in your trading.

The markets always wait to react to the Federal Open Market Committee (FOMC) announcements and the March 2015 FOMC meeting was no different. The Fed announced their intentions around interest rates, which were met with the usual results, a lot of drama and, potentially, euphoric buying/selling. It should be no surprise to most people that the when the Fed announced that they are not in any rush to change interest rates, the stock market immediately began to soar higher, the dollar fell like a rock, and the gold price, basically, didn’t care. So which one of the three is smartest?

20150325_inside-01

The stock market was sluggish to down a little in the hours leading up the announcement, but when the announcement was made, the euphoria set in. Traders and investors went on a buying spree, sending each of the major stock market averages back towards their all time highs. From a big picture standpoint, does this really make any sense? If you are looking at a specific stock, was that stock a smarter buy just after the announcement than it was just before the announcement? In the minutes leading up to 2:00 PM was there a dramatic corporate shift that made a given company more valuable within minutes of the announcement? It’s no secret that lower interest rates are good for the stock market because, as rates rise, more and money will move out of stocks, shifting to interest bearing securities, but does that make a specific stock a better buy at 2:05 PM than it was at 1:55 PM, just ten minutes earlier?

20150325_inside-03The dollar fell quickly and for quite a long time in the Forex market, which actually does make some sense; it may make more sense than what occurred in the stock market. When a country’s interest rates increase, their home currency will typically rise versus other currencies, especially the countries that have lower interest rates. This is because more and more foreign investment will flow into the country to gain the higher interest rate. When the announcement was made that the Fed will not rush to raise rates, selling USD to buy higher interest-bearing and riskier currencies makes some sense. All things being equal, traders and investors will be willing to hold a, somewhat, riskier currency if they believe that there is stability in their home economy.

What kind of a statement does it make that the news, by comparison, had very little effect on the price of gold? Traders and investors did not rush to sell their gold positions or rush20150325_inside-03 to buy more; generally speaking, they held their positions with very little change. The fact that the price of gold was so indifferent to the news may lead one to believe that the news really isn’t all that important or meaningful. Just because rates are not going to rise within the next month or so does not mean that they aren’t going to rise at all.

When situations like this occur, you really don’t need to know much about the market, or even much about trading. What you need to know is that people will react, and oftentimes overreact, to some of the simplest things. Human nature often lends itself to react to events on an emotional basis, rather than on a rational basis. So the strong, positive reaction in the stock market may not mean that much from a value-oriented or technical standpoint. In situations like this, you can trade based on the emotions of the market, rather than the market itself, because the emotions are what dictates what will happen. When it comes to the equity markets, perception is reality. So if a lot of traders or investors believe that something is important or true, they are correct, simply because they believe it and not necessarily because the information is actually important or factual. In some situations, we can trade based on the human nature and emotions of traders, rather than trading based on the specifics of a given security or the market as a whole.

No one can predict the future. But in the right hands, a good technical indicator can be a powerful tool for predicting what will happen next in the market.

Trouble is, there are over 300 technical indicators to choose from. Talk about information overload! More is not always better. So in this article, I’ll reveal my 10 favorite technical indicators, why I like these 10, and how to use them to improve your trading results.

We believe, as Einstein said, that, “Everything should be made as simple as possible, but not simpler.” Keeping it simple, here are our top 10 choices of technical analysis indicators, why we like them, and what they’re used for.

  1. Simple Moving Average (SMA)

SMA

There are several types of moving averages available to meet differing market analysis needs. As the name indicates, it is an “average” and its direction shows if the tendencies of buyers are long or short. In general, we prefer the 5-period for the shorter-term average and 50-period for longer-term.

One of our favorites, and one of the most commonly used by traders, is the simple moving average. It is the most basic type of moving average. Generally, when you hear the term “moving average”, it is in reference to a simple moving average.

Used for identifying:

  • Trend
  • Support and Resistance
  1. Exponential Moving Average (EMA)

EMA

The exponential moving average is similar to a simple moving average, except that more weight is given to the latest data. Be sure to check out our video on ‘Exponential Moving Averages Explained Simply In 2 Minutes’.

Used for identifying:

  • Trend
  • Support and Resistance
  1. Fibonacci Retracement

Fibonacci Retracement

The Fibonacci retracement is based off of a sequence of numbers that is found in mathematics and nature itself. It is one of the indicators that is widely used by technical analysts and traders of stocks, futures, ETFs, and Forex.

The Fibonacci retracement is the potential distance that a financial asset may retrace before resuming its ongoing trend. The indicator is used to draw a horizontal line at two extreme points, which is typically a swing high/low and then dividing the vertical distance by the key Fibonacci ratios of 23.6%, 38.2%, 50%, 61.8% and 100%, adding horizontal lines at each level. The horizontal lines act as support and resistance.

Check out this example of how the pattern can be useful for swing traders to identify reversals on a chart.

Used for identifying:

  • Support and Resistance
  1. Stochastic Oscillator

Stochastic Oscillator

The stochastic indicator shows when issues are overbought and oversold. You may not want to buy an overbought issue or sell an oversold issue.

Used for identifying:

  • Overbought / Oversold Market
  • Trigger Entry
  1. Moving Average Convergence / Divergence (MACD)

MACD

The MACD is supposed to reveal changes in the strength, direction, momentum, and duration of a trend in a stock’s price.

It utilizes a fast moving average and a slow moving average, indicating entry and exit points that occur when the faster moving average crosses the slower moving average.

Used for identifying:

  • Trend
  • Trigger Entry

Win More Trades Than You Lose By Eliminating This 1 Thing?

There are things you do when you trade that absolutely sabotage your chances of building wealth. We call these the “Profit Killers”, & there are 7 of them. Our free, 15-second quiz will reveal your #1 “Profit Killer”, & then show you how to fix it.

Click Here To Take The Quiz To Discover &
Fix Your #1 “Profit Killer”

(A new window will open so you won’t lose your place on this page.)

  1. Average True Range (ATR)

ATR

The ATR was originally developed for commodities, but the indicator can also be used for stocks and indexes. It is used to determine price volatility and it can also be used to set profit targets and protective stops. Learn more about and how to calculate the ATR.

Used for identifying:

  • Stops / Targets
  • Volatility
  1. Average Directional Index (ADX)

ADX

The ADX is used to measure the strength of a trend, not its direction. If you are trading stocks, ETFs or Forex pairs, it’s best to avoid low ADX numbers. If you trade ETFs, in particular, you will want to learn how to use the ADX to give your ETF trading an edge.

Used for identifying:

  • Strength of Trend
  • End of Trend
  1. Bollinger Bands

Bollinger Bands

Created by John Bollinger in the 1980s, Bollinger Bands is a technical analysis tool evolved from the concept of trading bands.

They are bands that are plotted on a price chart 2 standard deviations above and below a simple moving average. The standard deviation is a measure of volatility, so the bands will expand when the price action is more volatile and they will contact during less volatile times. When the price action nears the upper band, the issue is considered to be more overbought and, when it nears the lower band, it is considered to be more oversold.

Here, we’ll go on to show you how to trade the market using Bollinger Bands.

Used for identifying:

  • Squeeze play
  • Volatility
  1. Relative Strength Index (RSI)

RSI

The RSI is intended to chart the current and historical strength or weakness of a stock, Forex, option, or other market-based issue on the closing prices of a recent trading period.

The RSI can be calculated using the following formula:

RSI = 100 – 100/(1 + RS*)

*Where RS = Average of x days’ up closes / Average of x days’ down closes

Used for identifying:

  • Divergence
  • Short-term direction
  1. Pivot Point

Pivot Point

A pivot point, which is simply the average of the high, low and closing prices from the previous trading day, is used to determine the overall trend of the market over different time frames.

You can use pivot points to help you quickly and easily identify the trend. Remember not to overcomplicate things.

Used for identifying:

  • Identify trend changes

Remember, sometimes simpler is better, so keep it simple! What are some of your favorite technical analysis indicators?

But I’ve got to mention one last thing: All technical indicators are nothing more than tools. There’s an old saying you’ll hear on the golf course whenever golfers blame a bad shot on their clubs:

“Blame the archer, not the arrow.”

So, while technical indicators can be useful, the key to successfully trading the markets starts with eliminating your #1 profit killer.

Click here to pinpoint and eliminate your #1 profit killer in just 15 seconds.

Everybody is good at something, but not everyone is good at the same thing. Some people are good at selling, some people are good at teaching, some people are good with their hands, but not everyone is good at all of these things, and a lot of us aren’t good at any of them, though we are good at other things. Trading is no different; some people are good at trading, while others are not. The difference between trading and many other professions or disciplines is that it seems as though many people have a fascination with it, regardless of what they are actually good at. It seems as though people want to try to be traders because of the money that they can make, because there is no age limit, because of the freedom that they can have and, possibly, because you can spend a small amount of time on it while still being very successful. I think that all of this is great and people should try new things, but the sad truth is that most people should not be traders.

It takes a particular mindset to be a trader, which is a mindset that most people do not have. If trading was easy and everyone could do it, none of us would have regular jobs; we would just sit around all day and trade with each other, but that isn’t how it works. It takes just as much effort, just as much studying and learning, and just as much discipline to be a trader as it does to be successful in any other profession.

Most successful traders that I have talked to are flexible in their thinking in the respect that they do not think they know everything; they recognize that they can learn from other traders, regardless of the other traders’ experience level and they know that others may see situations that they have never seen before. Some of the common traits of the most successful traders that I have known include excellent analytical skills along with the ability to keep their emotions out of their trading. If a trader takes trading personally, they will likely be very unsuccessful. So if that isn’t something that they can do, they may be better off leaving their money in a bank account. If they can remove their emotions from trading, it will immediately decrease their overall aggravation and stress level while increasing their chance for success. The analytical part is the ability to read and understand charts and technical indicators along with the ability to understand tendencies of a particular company or industry, which may be more fundamental than technical. Both can be very helpful when trading and can be helpful in understanding an entire industry. Depending upon the market or the security that is being traded, understanding economics is important as well and, depending upon the specific security, it may be essential.

The number of traders that can consistently trade successfully is relatively small when compared to the number of people that actually trade. It seems as though everyone wants to be a trader, regardless of if they are good at it or not. I believe that trading is very appealing to people who are good in many different professions because it is something that can be done alone, over the Internet, without a broker’s involvement. You can trade with a relatively small amount of money and, in today’s world, the Internet makes it incredibly easy to access all types of information. In the past, a lot of the information that is available today would have been very difficult to obtain for the average person. The problem with all of this is that now that it is so easy to trade via the Internet, many people want to be point and click traders, which doesn’t always work out how they hope that it will. I’m definitely not down on trading, but, from a realistic standpoint, many traders that I talk to would be far better off learning to manage their own money rather than trying to trade with it.

Support and resistance is an important element of trading. The main reason support and resistance is so important is because identifying these levels can help you to better identify good entries. Beginning traders who are following the markets will generally start by noticing tops and bottoms of the markets. These tops and bottoms are the basis of support and resistance levels.

What is Support and Resistance?

A support level is a price level where the price tends to find a price floor, or support, as it is going down. It is where demand is strong enough to prevent the price from declining further. The idea is that as the price gets cheaper and investors become more interested in buying and less interested in selling.
Resistance level is the opposite of support. It is where the price tends to find a market ceiling, or resistance, as the price is going up. It is where demand generally weakens enough to prevent the price from increasing further. The idea is that as the price gets more expensive, buyers become less interested in buying and sellers are more interested in selling.

Identifying Support and Resistance Levels

The first step to identifying support and resistance levels is to go on a chart and connect the recent significant highs using a trend line at the top of the market. The next thing to do would then be to connect the lows using a different trend line at the bottom of the market. Once the tops and bottoms are connected, this will show the support and resistance levels, as well as help identify the support and resistance levels with a channel forming the outsides of the market. This is illustrated in the chart below. Notice the trend line is supporting the market price action as a floor and the market is moving up and down between the support at the bottom and the resistance at the top.

20140304_inside-01

In addition to trend lines to identify support and resistance levels, you can also use Moving Averages to identify good support and resistance. You can use a 40-period SMA and a 20-period SMA. In an uptrend, when the price action moves down, between the 20-SMA and 40-SMA, the price is in a good general support zone. If the price action moves back above the 20-SMA, this may be a good time to enter the market long. The same is true in a downtrend, if the price action moves up to the top, between the 20-SMA and not above the 40-SMA, and if the price moves back down below the 20-SMA, this may be a good short entry. Note in the chart below that when the market moves between the 20-SMA (blue line) and the 40-SMA (red line), you are in a good support level at the bottom or a good resistance level at the top.

20140304_inside-02

Your first loss is your best loss; if you try to get it back in a vengeful way, everything can go downhill for you very quickly. Stemming this negative tide can take a lot of self-control, so if you have an undisciplined personality by nature, this is what could make or break you as a trader. I typically communicate with hundreds of investors and traders each week and one of the most troubling things that I see is when a trader loses on a given trade and then doubles up or more on the next trade trying to make back the loss and trying to make the profit that they missed out on when the loss occurred. When this strategy works out, it can work out very well, but when it does not work out, it can be a nightmare, unnecessarily draining your account of the cash that it needs to move your trading business forward. This type of reaction to a loss is almost purely emotional, sometimes it occurs out of ego and sometimes it occurs out of anger, but it always occurs out of a lack of discipline or self-control.

One of my basic business beliefs is that there is no room for emotions in a business situation and, since trading is a business, removing the emotions from trading decisions seems like common sense. Many traders have big egos by nature. If they have taken the initiative to learn to trade, they are likely self-motivated people. Since trading is something that you can do on your own without relying on others, it is very appealing to independent-minded people. These are good traits for traders to have, but when they cannot keep their emotions or their ego in check, it can lead to a lot of problems. When a trader takes losing trades personally, it is when things can spiral out of control.

The market isn’t out to get anyone; in fact, the market couldn’t care less about any of us, so when we make a bad decision and we lose on a trade, or when we do everything right and the trade still doesn’t work for us, it isn’t anything personal. Trading is a business and all trades are just business decisions, some work out well and others won’t. When a trader gets angry at the market and trades to get revenge from an earlier loss, it rarely works out well. Typically, what will happen is that they will make mistakes or look for a setup that really isn’t there. The point is that the trader is likely entering the market at a time and a place that they shouldn’t be entering at all and they, very likely, have the wrong mindset that it takes to succeed. They are looking to get even and they are looking to take it out on the market, but what will often times happen is that, instead of doubling up on a winning trade, they double up and lose again, compounding their problems and frustrations.

Trading from a conceptual standpoint is very simple – we look at the charts based on whatever time frame we are trading on and we will see that there is either a valid setup or there isn’t. If there is no valid setup, we move on and look at the market again at the end of the next period, but if there is a valid setup, we enter into a position based on our trading method. It’s not complicated and there is no gray area around this, either there is a valid setup or there is not. Regardless of how devastating your last loss may have been, it should have no impact at all on your future trading decisions. Apply the same method to the same market, in the same way, using the same rules for position sizing, and simply move forward. Sometimes you win and take some money from the market and sometimes the market wins. All you can try to do, as a trader, is to win more than the market does.