The more complex a trading system is, generally speaking, the more confusing it is to understand, the harder it is to follow, and the more difficult it is to implement. For starters, let’s talk about simplifying. This can apply to many areas of life; however, it is a critical element to having a successful trading plan.

Let’s start with trading strategies. Don’t make your trading strategy too complicated. This may sound obvious, but many beginning, and even very experienced, traders tend to make their job as a trader more difficult than it needs to be. One common error in trading is the idea that we need to have some fancy, complicated strategy with some wild combination of indicators and crazy settings to have a successful strategy to trade. This could not be further from the truth; in fact, as you speak to successful traders, they will often times tell you that they started with many indicators on their charts and now only use very few, if any. Some of the more successful traders will look more at price action than indicators to trade. This does not mean you should not use indicators, just that you need to use them only if they are going to help simplify your trading process. Simpler is almost always better, especially when trading. So many of the indicators give similar information that using too many will make charts complicated and just confuse the trading opportunities. Using a few simple indicators to confirm the price action is generally much better and simpler. For example, a couple of moving averages can be used to help confirm the trend and momentum, along with support and resistance level derived from the price action (highs and lows). Looking for too many signals may only lead to lower probability trades and worse overall results. So make sure that your trading strategy is simple enough to implement in most market conditions.

In addition to using more complicated indicators than are necessary, also avoid the temptation to trade too many positions (or too many pairs in forex) and too many time frames. Trying to trade the 5-minute charts, the 1-hour charts and the daily charts may have you chasing to many trades in too many securities to successfully manage. This often leads to poor decisions and bad trading discipline. Again, the most successful strategies are simple to understand and implement. In addition to a simple trading strategy and simple rules, simple, clear risk management rules are essential to a good trading plan. Never trade larger sizes than appropriate for your trading account. For example, keep a simple rule such as never risk more than 2% per trade, based on a hard stop loss order, no more than 10% of your total account at any one time, and limiting you’re trading to no more than 5 trades at a time.

The best way to get good at trading is to focus on practicing your system and avoid the temptation to always be looking for a better system. Start by picking what you want to trade, use just a couple of indicators, and pick just a couple of time frames to use.

In summary, keeping it simple is actually the smartest way to trade – keep your trading system simple, your charts simple, your entry and exits simple, and, most important, keep you risk management rules simple!
I believe that, for some traders, there is a natural tendency that makes them want to trade against the prevailing market trend. Most traders have heard the old adage “the trend is your friend”, but saying it and applying it are two completely different things. When traders see an ongoing trend develop and age, I believe that it becomes easier and easier for them to believe that it’s going to end, which makes it very difficult for them to enter the trend to participate in it. We know that all trends will end at some point, but if we are watching a current trend, waiting for a reversal or some other kind of move in the opposite direction, we’re very likely missing out on making some relatively easy money. The market does all the heavy lifting for us; all we need to do is to figure how to enter the market as early in the development of the trend as possible.

Getting into the flow of a current trend isn’t always the easiest thing to do from a psychological standpoint, but, most of the time, it seems as though it is the easiest way of trading with the least amount of risk and resistance. When a trend develops, many traders will find that getting into it at a given point is tough because the longer it goes, the more likely it seems that it may be over, so it seems as though there is a good possibility that they are entering at the end of the trend just before it turns around to stop them out. The problem with waiting for the prevailing trend to end is that, depending upon market conditions and the time frame that is being traded, it could take a significant amount of time for you to get a confirming move in the opposite direction, which means that you could be standing on the sidelines instead of capturing the money that is right in front of you.

The current direction of the market isn’t always obvious and there are as many ways to determine its direction as traders can think of. Some traders may simply look at the direction of a longer-term average as a gauge for the market’s direction, while some will look for a shorter-term average crossing over a longer-term average. Some traders may use a specific indicator, such as the color change of the Heikin-Ashis to determine this. Regardless of how you do it, once you do determine the direction of the overall market, you may consider just trading in that direction, only taking long positions when the overall market is long and only taking short positions when the overall market is moving down. Of course some issues will move counter to the current direction of the market and many will move independently of it, but, generally speaking, for the overall market to be moving in a given direction, the majority of stocks in the index must be moving in that direction or the index wouldn’t be trending that way.

I believe that many people have a contrary mindset by nature, which oftentimes will make them want to trade against the prevailing trend or, at least, it will make them look for the end of the current trend, hoping to get into the market in the other direction. This may not be an overall contrary mindset as much as it is looking to get into the next trend as close to its beginning as possible. Practicing recognizing what is a reversal in the market versus what is just a pullback could be the difference between long-term and short-term trading success. Watching a longer-term trend and entering in the direction of the trend, based on a pullback to that trend, while still looking for a reversal trade to set up, is actually a pretty easy thing to do. The market goes up and it goes down, but it never goes straight up or straight down. So picking a spot to join an existing trend that has been progressing for an extended period of time is an excellent way to participate without the aggravation of always looking and waiting for the end of something or the beginning of something new.

Trading is actually not that complicated when you break it down to its simplest form. When we are trading, we are merely trying to recognize repetitive patterns that occur in the market as early in their development as possible. We really only need to know a few things, which include our entry point and our exit point. Getting into the market is pretty easy for most traders because most of them will have a set of qualifications or setup conditions that must be met, which may require specific indicators or the price action or some combination of all of these to be aligned properly before a potential setup is deemed to be valid. There shouldn’t be a lot of thinking that goes into entering the market, all of the thinking around this is typically done well in advance when the trading methods is created or learned from a third party. The exit strategy can be a little more difficult to manage, but as long as there is a preset set of criterion to determine when and how to exit an open position, it should not be that tough.

Regardless of what the method or system is that we are applying to our trading, our setup conditions have either been met or they have not; there shouldn’t be any guessing or anything that is left up to chance or interpretation. If our setup conditions are satisfied, then we enter the market applying our preset parameters to the trade and, if they are not, we discard it altogether and look for the next valid opportunity. This is very simple, it’s black and white, and shouldn’t have any gray area at all.

Now that we have firmly established how we handle the outer ends of a trade, the entry and the exit, what do we do about the middle of the trade, the part between the entry and the exit? The only way I see that this part of a trade can be managed effectively is by doing absolutely nothing with it. Between the entry and exit of a trade, there is nothing for you to do, the market does all of the work for you, it goes where it’s going to go and the most likely result of over-managing your position is failure.

If you have thought far enough in advance to have created specific entry and exit rules, they are likely to be based on a specific time, which means that the results and expectations of the trades will also be based on that time. When I say time, I mean an actual time, not the general time frame of the charts that you are using. If you have created your method based on 1-hour charts, then all of your research, your data, and everything around your expected results, will be based on a 1-hour time frame, a complete 1-hour candle. If you are looking at your open positions at any time, other than at the top of the hour, with the intent of manipulating something around them, there is almost nothing good that can happen for you.

When you create a set of expectations that are based on one thing, in this case, the close of hourly candles, but you manage them based on another thing, which is likely any time other than the close of a one hour candle, there is virtually no way that you can be successful. All you’re doing is undermining your own method or trading strategy. If you know by looking at the closing candles of an hourly chart that your trades should be successful at least 80% of the time, this number is based on the information that comes from the top of the hour, not 10 minutes after the hour, not 30 or 45 minutes after the top of the hour; it comes from the top of the hour. This means that the only way to achieve your expected 80% positive results is to discipline yourself into entering and setting up a trade and then letting it go until it comes to fruition without your involvement. There is rarely anything to gain by managing an open position before the current candle closes. If your method was created using closing information, it has to be managed based on the same information and, if it isn’t, you are entering a trade by using one method, but managing and exiting it with an entirely different method. Over time, this inconsistency alone should result in failure.

How do you know the difference between trading and gambling? Can you tell when you have crossed the line and become one versus the other? I believe that one very good way to know which one you are is if you have a trading plan that your trading business actually follows. Of course this would also require that you actually declare your trading business as a trading business and admit what it actually is that you’re doing. If you do have a detailed trading plan and if you follow it and stay disciplined, regardless of what is going around you, it is entirely likely that you are trader. If you are the type of trader that quickly jumps in and out of the market regularly, with no real plan, applying very little thought to what or why you are trading, then you may be a gambler. An obvious question may be is one preferable over the other or do you end up in about the same place over time regardless of what you are actually doing?

I personally don’t believe that you do end up in the same place. I believe that a lot of wannabe traders call themselves trades, but they are really just gambling and, if that is the case, they should admit that they’re gamblers and gamble in areas where gambling was meant to take place. If you are gambling, you are playing a game of chance, but, with games of chance, such as card or dice games, there are a tremendous number of variables; however, regardless of the number of variables there can be, they are, for the most part, known or, at least, expected. There may be a lot of variables when playing a hand of poker, but you know that all of the variables are centered on the cards. When gambling in the markets, not only do you have all of the variables that surround the market that you’re are gambling in, but you have the added variables of all of the people that effect your position. You don’t know when a world leader will die or be assassinated, you don’t know who will attack whom, and you don’t know when an officer of a major corporation will do or say something stupid that will adversely affect your position. You don’t even know when a cataclysmic natural event may affect you.

If you want to be a professional trader, then treat trading as a business, and a business is a business, regardless of the industry it is in. Make sure that your trading business is properly capitalized for the type of trading that you want to do and make sure that you have a very detailed and organized trading/business plan. Reduce and eliminate as many variables as possible and, just like any business, the more you plan ahead, the more variables you will be able to eliminate. When you are operating your trading business, you will see that every trade is just a business deal; some work out well and some do not, but there should never be one business deal that is so important to a company that the company cannot survive without its success. Applying the same concept to a trading business means that there should never be one trade that is so important that it is the deciding factor of whether the trading business can survive or not.

If you own a company that sells something to earn profit, or if you repair something for profit, or if you provide some kind of a service to earn a profit, these things are no different than if you trade for profit. It seems that a lot of traders want to deny that they are actually running a business, which could in fact be because they are running the trading business so poorly. It isn’t that they are bad traders, they are just in denial regarding what they are actually doing. Not acknowledging or admitting that a trading business is actually a business is one way to hide from its results and it is a good way to avoid responsibility. It is very easy to say that you have a trading account that you play in from time to time, but when you state that you are running a trading business, there’s nowhere to hide; you’re either succeeding or failing, just like any other business. At some point, just playing around in an account doesn’t mean anything, but when you actually declare that you are running a trading business and you expect to trade profitably and be successful, that is when you will begin to see consistent and positive results. Remember that even professional speculators have a plan.

Speaking with many different new traders, we often hear them speaking about how much money they want to make when they are trading. They speak about things like their winning percentage and how much they are going to make with each winning trade. They focus on the great vacation they are going to take, the new car they are going to buy, quitting their jobs, and many other wonderful and worthwhile things they want to do with all the money they are going to make. While it is important to have dream and set lofty goals, oftentimes, this approach to trading can cause us to become poor traders. Generally speaking, we can pick out new traders from experienced traders by listening to what they talk about. Like I said, new traders focus on their wins, while experienced traders focus on their losses.

While this might seem a little strange, the fact is, experienced traders know that, if they do not focus on their losses, they end up losing control of their trading. Newer traders, while understanding that they need to control losses, have not learned the importance of this concept. If you cannot control your losses, eventually they will control you. There are several things that you need to know in relationship to your trading losses.

First, know how much you are willing to lose in each trade and in each day. By setting your loss limit, you will know when you must stop your trade. Many traders will set a per trade risk amount that they are willing to lose on each trade. Someone might be comfortable risking 1% on any single trade they take. This means that they have set a limit to what they are willing to lose every time they take a trade. This is the easy part when it comes to knowing how to lose. The hard part is to actually take the loss when it happens. A simple way to do this is to just set a stop loss and leave it alone. Traders who do not do this end up taking bigger losses because they become afraid to take the loss when they are supposed to.

Another way to make it easier to take our loss is to trade a smaller risk amount. If you are finding it difficult to take a 1% loss, then you need to trade smaller. There is nothing wrong with starting with very small trade sizes if it allows you to better take the loss when you are supposed to. As you become comfortable with taking the losses when you need to, you can then gradually increase the amount you are risking to a higher level.

As you begin to focus on learning how to take your losses, you will find that you will become better and more consistent at winning. Your wins will take care of themselves as you take care of your losses. Becoming proficient at taking losses will put you closer to becoming the successful trader you want to be. Take some time to review how you take your losses so you can make the changes you need to in order to become the best trader possible.

Lately the economic news that has been coming out of Washington has not exactly been stellar, though our economy does seem to be holding its own somehow. This has contributed to the stock market gyrating daily by a good amount. It seems as though it is very common these days for the market to make a big move at the open, one way or the other, but by the end of the trading day, it has either given back a lot of what it has gained or it has gained back a lot of what it gave up early. So though there has been a lot of activity, there hasn’t necessarily been a lot accomplished by the activity. From a trader’s standpoint, we don’t really care which way the market goes, we just want it to go, so this spiky up and down, non-directional movement can be annoying.

Economic reports have been coming out with largely mixed results with, possibly, a downside bias. There has been a lot of recent optimism about the drop in oil prices, which I have to agree is a good thing. I don’t know anyone that isn’t enjoying the lower prices that we have recently been seeing. The thing that I found odd about this is that the most recent retail reports that have come out, which are reporting on December 2014 sales, have been well below what the analysts expected. This means, of course, that people spent less money around the holidays than what was expected. The thing that I find odd about this is that the reason economists believed that people would spend more around the holidays is because of the drop in oil prices; they believed that, since people are paying less for a gallon of gas, they would spend that money elsewhere.

I’m not sure why they had this thought process because it seems to me to be a little out of touch with reality. If the average person is living paycheck to paycheck and all of the sudden they get a reprieve in one of their monthly expenses, such as the price of gas, they have more disposable income each month. But I’m not sure what would lead anyone to believe that they are going to take that savings and spend it, leaving themselves in no better position than they were in when the price of a gallon of gas was higher. It seems like common sense to me that most people, or at least many people that are in that situation, would not spend the money that they are saving on gas, but, instead, they would keep it, giving themselves a little more room, financially, each month. It seems peculiar to me that this was such a surprise to the economists; it almost seems as though they are out of touch with reality or at least with what the average person’s reality may be.

There have definitely been times in the past where the average household was earning more money and, subsequently, spending that money on large ticket items or on lower to medium priced luxury items, but that was occurring several years ago, before the great recession, and when the economy, as a whole, was doing very well. We have recently gone through the aforementioned great recession, more people are back to work, but wages have been falling, or at least not rising, and there is a lot of uncertainty about the economy in nearly every newspaper you read or every TV news show that you watch. I believe that common sense in this case would be that if people are able to save money in a given area of their monthly expenses, there is virtually no reason to put it out in other areas; there is no reason to be that confident in our current economic situation. Keep as much money as you can in reserves for a rainy day because, as we have seen in the recent past, the rainy days that people always talk about actually do happen.

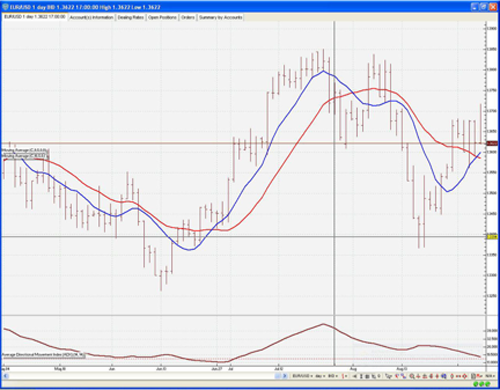
Most good charting software and trading platforms, provided by a good broker or bank, include the ability to plot daily bar charts where the daily bar “closes” at 5:00 p.m. EST. This time is selected because it is coincident with the New York session “close” and the Sydney “open”, which is a relatively quiet time in most markets until the Tokyo session begins at 7:00 p.m. EST, followed by the London (and European) session beginning at 3:00 a.m. EST. We can then use these daily bar charts to develop trading strategies that require only the use of these charts without requiring intraday charts.

Figure 1: EUR/USD Daily Chart

Figure 1 shows a plot of a daily chart for the EUR/USD pair using VT Trader, which is a widely used and representative charting software and trading platform. On this chart, each bar represents one day’s trading activity from the high price of the day to the low price of the day. The horizontal mark to the left of a daily bar is the open for the day (this is based on the first trade after 5:00 p.m. EST). The horizontal mark to the right of a daily bar is the close for the day (this is based on the last trade as of 5:00 p.m. EST). So, as you can see, daily bar charts are readily available in the 24/7 Forex markets.

Also plotted on this chart are a few technical indicators. Two simple moving averages are plotted in blue and red and the ADX indicator is plotted at the bottom in brown. A simple moving average is calculated by adding up the prices for a number of bars and dividing that sum by the same number of bars. Moving averages help to determine the prevailing trends of the market. The ADX indicator is a complex formula that helps to determine the degree of trendiness of a market. These are only a few of the indicators that are available through VT Trader in applying technical analysis.

If you look closely at the chart from left to right, you can see that this market was in an uptrend and then later formed a double top before falling into a downtrend, only to reverse again into an uptrend at the end of the chart. This type of behavior is typical of what you can expect to see on a daily chart and these shorter-term trends can definitely be traded using good end-of-day trading methods.

A good end-of-day trading method should be based on an evaluation of the market after the daily bar “closes” at 5:00 p.m. EST for trade opportunities to be considered after the open of the next bar, which occurs as of the first trade after 5:00 p.m. EST. In actual practice, because the markets are relatively quiet during this time, trades for the new daily bar can be placed anywhere from 5:00 p.m. to 7:00 p.m. EST, when the Tokyo session begins. Trading in this manner then requires only a few minutes each day, at the same time, without worrying about an open position if it is properly protected with stops and profit targets.

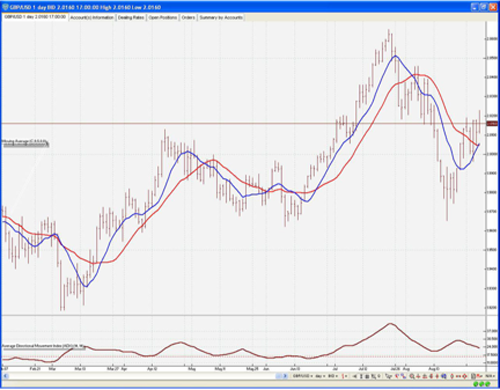
Figure 2: GBP/USD Daily Chart

Figure 2 shows a plot of a daily chart for the GBP/USD pair using VT Trader with the same technical indicators as the previous chart. With this software, it is a simple matter to toggle from one pair to the other for quick visual analysis.

If you look closely at the chart from left to right again, you can see that this market was chopping sideways until a major move up occurred over a period of more than 20 days and then the market reversed abruptly and retraced that entire gain even faster, after which a new rally started. Again, this type of behavior is typical of what you can expect to see on a daily chart and these shorter-term trends can definitely be traded using good end-of-day trading methods. You can also see that if you do not pay close attention to risk management that these abrupt swings could do great damage to your account. Like any endeavor that offers great reward, you must get the proper education and training in order to stay out of trouble and realize that potential.

If you didn’t set your financial goals for 2015, before the end of 2014, you may be late in doing so. But even though the New Year has already begun, setting goals for the year as soon as possible is still a good idea. If you don’t, you may experience the old adage, “If you fail to plan, you plan to fail.” So sitting down and spending time on what you want to accomplish this year is essential. You rarely get anywhere, at least not efficiently, if you don’t plan your journey ahead of time. I understand that, for many people, talking about finances is at, or near, the bottom of their list of things they want to do. But if you put the time into mapping out your goals, each year thereafter, your financial goal setting will be much easier. If you set your 2015 goals as soon as possible, at the end of this year, you will have nearly a year of data to review to see what worked and what didn’t. Going forward, it is more about modifying an existing plan than it is creating a new plan from scratch, so sitting down and doing the hard work now makes everything easier in the future.

Generally speaking, planning for the future in all aspects of one’s life is a good idea, but the way that our society works today, and the way our economy is structured, it is possibly more important now than it was at anytime in the past to plan for your financial future. In the past, people worried about the future a lot less because, if they were employees that worked for large corporations, they were typically guaranteed retirement income and retirement benefits for life, which may no longer be the case. This put them in the position where they could concentrate on other financial goals without the need to emphasize retirement. Today, even people that are working for large corporations, from a retirement standpoint, are not much different than self-employed people or any other person that doesn’t have guaranteed retirement benefits. People with no retirement benefits have to create the benefits on their own through savings and proper investing of the funds that are earmarked for retirement. In today’s world, many people who work for large corporations are no different in this regard because, in many companies and industries, pension plans have gone away. Even for people who think they have a guaranteed pension, based on what we have seen over the past several years, it may not be as guaranteed as they think it is.

If we didn’t learn anything else in the recent past, what we should have learned is that, even for those of us who do have a pension plan, to look forward, we still need to have a plan B. In this case, plan B would look a lot like what a person’s plan is that does not have a pension plan in place. Regardless of what our position will be during retirement, or whatever the goal that we’re actually saving for is, we need a plan to get there. Laying out the initial plan is the hard part, everything after that is, basically, maintenance. Our financial plans are just like any other plans – over time, they need to be updated, adjusted, improved upon and, in some cases, overhauled altogether, but the bottom line is whatever we want to do in the future, there’s no better time to start the planning process than right now.

Many people are resistant to putting together a financial plan for themselves because it takes discipline to do it and even more discipline to follow it. Some people won’t do it because they don’t believe that it will ever do much good for them, they don’t have a long-term vision. The truth is that having even minimal financial goals is better than not having any at all. It is late to plan for 2015, but it is definitely not too late. If nothing else, planning now for the remainder of 2015 could be looked at as a precursor to our 2016 planning when we’ll have another chance to plan in a timely fashion.

Unlike stocks and futures that trade through exchanges or the NASDAQ, Forex trading is done through market makers that include major banks as well as small to large brokerage firms located around the world who collectively make a market on a 24/7 basis. The Forex market is always “open” and is the largest financial network in the world with a daily average turnover of trillions of dollars.

Forex trading involves trading currency pairs, such as the EUR/USD pair (Euro Dollar/US Dollar pair), where a buyer of this pair would actually be buying the Euro Dollar and simultaneously selling short the US Dollar.

The format of a Forex pair is YYY/ZZZ, where the first currency, YYY, is called the “base” currency and the second currency, ZZZ, is called the “counter” currency. The price for a Forex pair is expressed in terms of the counter currency.

The price of the EUR/USD pair is expressed in US dollars, the counter currency, as 1.3667, for example. This means that the base currency, the Euro dollar, in this case, equals US $1.3667. The price of the USD/JPY pair is expressed in Japanese Yen as 108.02, because, for this pair, the Japanese Yen is the counter currency. This means that the base currency, the US dollar, in this case, equals 108.02 Japanese Yen.

Prices are expressed in pips, which are nothing more than the minimum increment that a currency pair price can change. For example, if the EUR/USD price changes from 1.3790 to 1.3791, the price is said to have gone up by 1 pip. Most major pairs are priced to 4 decimals, which is the equivalent of 1/100th of 1%. The exception would be the Japanese Yen pair that only trades to 2 decimals. This is because there are usually over 100 yen to the dollar.

Forex pair quotes are on a bid-ask basis. The bid is the price that the market is willing to pay a seller at a point in time for a specific currency pair. The ask is the price that the market is willing to sell to a buyer at a point in time for a specific currency pair. The difference between the bid and the ask is called the bid/ask spread. For example, a typical EUR/USD quote could be 1.3784 bid / 1.3787 ask, which is a spread of 3 pips. Since the spread is how the market makers are compensated, there is no commission when placing a trade.

It is also important to note that the spread will vary depending on market conditions. So the quote itself, for any given Forex pair, is the bid/ask combination, at a point in time, based on the market driven floating exchange rate. The quotation lists the bid price first, then the ask price. For the EUR/USD example above, the quote would be expressed simply as 1.3784/1.3787 or 1.3784/87.

Trading is done in lots, either a 100,000 unit standard or 10,000 unit mini lot. For example, for a standard lot purchase, if the EUR/USD quote was 1.3784/1.3787, then buying a EUR/USD pair means buying 100,000 Euro dollars and selling short $137,870 US dollars. Therefore, for a standard lot in which the USD is the counter currency, 1 pip will equal $10 ($1 for a mini lot). For other major counter currency pairs, 1 pip will range from $8 to $10.

Forex dealers offer leverage as high as 100:1 and sometimes higher. At 100:1 leverage, 1 standard lot pair, in which the USD is the base currency, would require $1,000 in margin ($100,000/100). On the other hand, a 1 mini lot pair would require only $100 in margin ($10,000/100). If the account value falls below the margin requirement, the dealer will close out the trade automatically.

Buy-and-Hold investing may have worked decades ago, but I’m about to show you that it’s a losing strategy now and I believe it will never be a viable option again, at least not in our lifetimes.

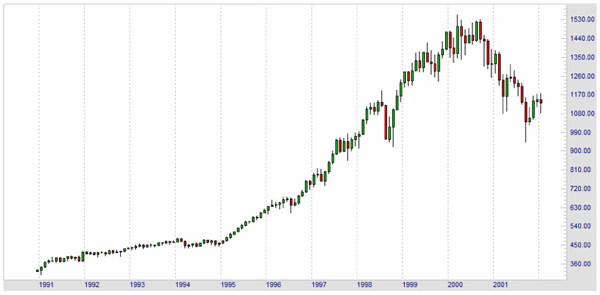
Look at this S&P 500 chart from 1991 through the end of 2001:

For the first nine years of this chart, the buy-and-hold strategy was probably a good move. You didn’t have to be a genius to have a good shot at making money in the markets, but it all started to fall apart around 2001. However, most investors thought the market would correct and continue its climb, like it did for most of the ‘90s.

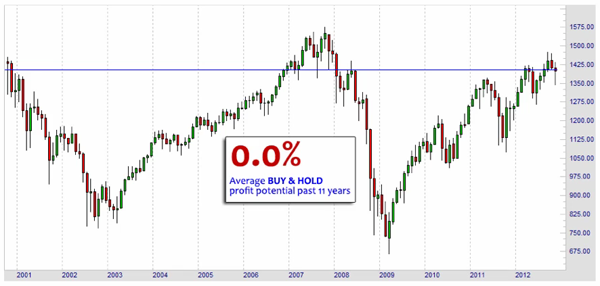
Well, of course, that didn’t happen, as you can see in this S&P 500 chart for the next ten years:

This decade pretty much put the final nail in the coffin of the buy-and-hold investing strategy. Over a period of eleven years, the S&P 500 was flat after experiencing many huge ups and downs. Almost everybody who had open positions in early 2008 went into shock by the end of that year when the market crashed hard. You can see, by looking at the chart, that the general market dropped over 50% and individual portfolios dropped even more than that. Why? Because they had no exit strategy and if you have no exit strategy, you are constantly vulnerable to dramatic collapses in the market at any time. These collapses have happened several times in the past, and they’re going to happen several times in the future. Just ask yourself, “Would it be okay with you if your portfolio dropped by 50%?” If your answer is, “No”, then ask yourself what you are doing to protect yourself against that possibility, because it will happen again. Of course there’s no way to predict any of these market moves, but the good news is that you don’t have to predict anything to be able to have the potential to make a lot of money in a market like this.

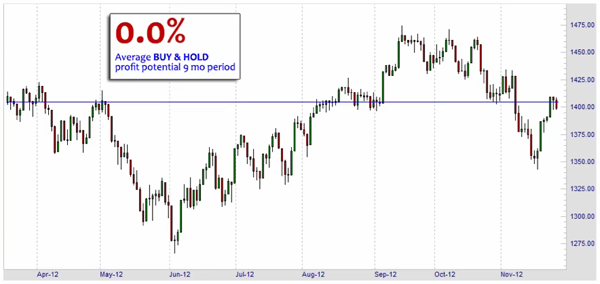
Let me show you what I mean – here’s another chart of the S&P 500, this time, zoomed in to a recent nine-month period:

A buy-and-hold investor would have seen their portfolio at break-even over this period, and that’s if they were able to keep their positions open and ride out the storm, which is very tough to do. What do you tell your spouse when you have to cancel that vacation you were planning on taking because you just took a big loss and you have no idea how to recover? It’s not an easy situation to be in.

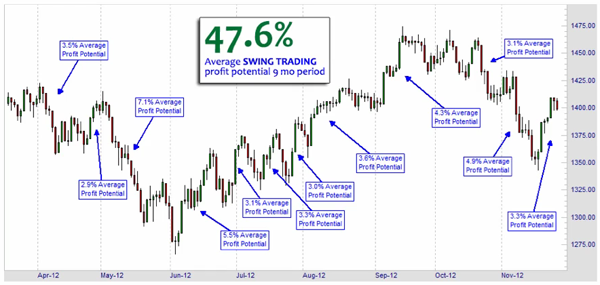
If you look at the same nine-month period through the eyes of a trader, this is what you see:

A whopping 47.6% of profit potential by swing trading the short-term trends that are, literally, everywhere on this chart. Just to be clear, this is assuming you’re using a good swing trading method and this is profit potential. It doesn’t mean you would have made 47.6%, but it does mean that a good method had a good chance of getting a lot of that potential, and that’s exactly what short-term swing traders do.

So the choice is really yours. There are two different realities and the question you should be asking yourself is which one do you choose? In the training videos, I’ll be teaching you how to go after the 47.6% of profit potential in this example. Sometimes there’ll be less potential, sometimes there could be a whole lot more. The bottom line is that, once you have a step-by-step plan, you’ll know exactly how to take advantage of any market, no matter what happens.