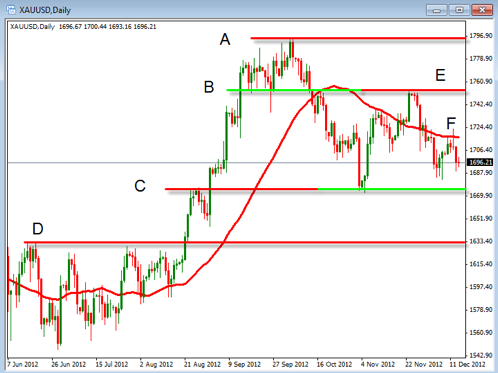
Today we take a look at the daily charts for both gold and silver. Being able to identify trends and support or resistance on the daily chart is critical to our overall success in evaluation of the charts. We will evaluate the chart below by looking at each part individually.
A= This is the past high point on the daily chart of gold. This area is important to identify because it is where there may be some long term resistance to price movement. This is common to identify in any chart we are looking at for both determining possible targets and where the price may stop moving.
B= This line shows the concept of how support areas can become resistance areas on the chart. Once we see an area of support in the past we want to look for it to act as an are of resistance in the future.
C= The reverse is true for old resistance becoming new support. This area can also form the support area in a triangle price pattern.
D= This is the most recent area of strong resistance which we want to identify if the prior level of support is broken.
E= The new level of resistance formed off of the support line B
F= This is the 40 SMA which is moving down and an indication that the trend is to the down side.
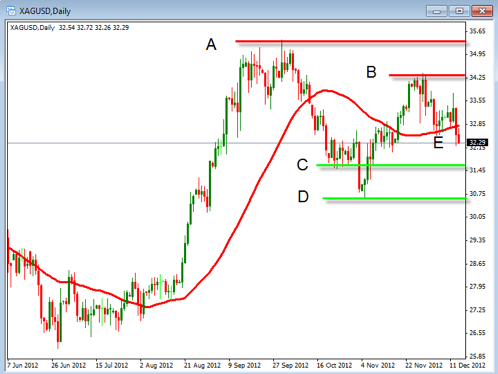
As you evaluate a chart step by step you will be able to have more confidence that you are looking at things correctly. Now take a look at the chart of silver.
A= Longer term resistance
B= Short term resistance
C= Short term suppot
D= Longer term support
E= Moving Average direction
So as we look at the chart of Silver we can get a good picture of the areas where the price may be going and were it may be stopping its movements. The goal should be to quickly identify what is happening on the chart so you can make good decisions about how to trade it.
With both the chart for gold and silver we can reasonably make the determination that the price action is a bit sideways and consolidating. This gives us the opportunity to better know what we should do with our trades and where to enter or exit them. Take some time to practice drawing these lines to see what conclusion you come up with.

