Trading During The News

Today we are going to discuss a bit about trading during the news. This is something that every trader will have to deal with as news, both financial, political, and other types of news, is constantly being released. Because of this constant news coming out, we will need to know how to approach our trades so the effects of the news are minimized.

For example, this week we have a couple of major news releases coming out. First, we have the FOMC statement and interest rate coming out on Wednesday, followed by the nonfarm payroll employment changes on Friday. These are two fairly significant reports that will be release, so we need make sure we are prepared for the possibility for strong, or increased, volatility.

As with most reports, the market will have an estimate or forecast for what it thinks the number should be. If the report comes out better or worse than the forecasted number, we can expect to see that the volatility will increase. If the number comes out at the forecasted number, then we may not see a lot of movement. With the FOMC number, it is sometimes followed by a press conference, which can cause the effect to be even more extreme in its movements.

There are a couple of things that you will want to consider when trading during potentially higher volatility news releases. First, you want to make sure you are using proper risk management. This means that you should consider using a smaller risk percentage than normal. So, if you normally risk 2% per trade, you would consider dropping it to 1% per trade. The next thing you might consider is to increase the amount of your stop loss. This might sound a bit more risky, but, in reality, if the price action becomes more volatile, we will be better off by giving the price a bit more room to move during these volatile times.

The other thing to consider is how to take advantage of this possible increase in price action. If we are expecting the price to move strongly one direction or the other, we can look to place a buy stop or sell stop above and below the current price. Doing this before the release of the news can allow us to take advantage of the big move. If we are trying to catch the big move up or down, we really don’t care which way, we only want it to move a lot. As we look to place the entry stop orders, we need to remember that spreads can widen enough that we could get filled before the announcement is actually released. This would put us into the trade prior to the move actually happening.

As you approach the news you can practice in a demo account to see how the price action is affected by the news. Take some time to see how this might be a time where you could place some trades and see big moves in your favor. Just remember to use good risk management and to practice before you try it in your real account.

The Forex Market is Lacking Volatility

Volatility in the Forex market has been decreasing since 2007, due in large part to the economic issues of 2008. The way that the economic downturn has affected the currency market, and others as well, is that it lead to the Fed here in the US, and other central banks from around the world, to print and distribute money in massive quantities through their quantitative easing programs. I am not speaking for or against quantitative easing; I am simply presenting this as a fact that we must recognize and deal with. The moves that we see in the currency market are simply smaller than they were in the past, meaning, of course, that there is less profit to be made. In the past, traders would look at fundamental analysis, technical analysis, and momentum, but, often times today, these types of analysis don’t tell you much. The lack of volatility can clearly be seen in the reduced daily and weekly ATRs, which are now about 50% of what they were, and smaller in some cases. Moves that one would have expected to eat up several hundred pips a few years ago now fizzle after reaching a fraction of that number.

One thing that a lot of traders have been looking at to counteract this is the carry trade, which is simply earning interest from the disparity in interest rates between the two currencies in a given pair. If you borrow a lower interest yielding currently to buy a higher interest yielding currency, the difference in the interest rates will provide you with a profit. Conversely, if you do the opposite, you will pay the interest differential, so be very careful which pairs you choose if you do look to profit in this way.

I have a personal unintended example of this in a Forex demo account that I have had open for a very long time. I never trade in a demo account, but I was looking at longer-term charts to see if one of my favorite trading methods would be effective on these time frames. On March 6, 2014, I saw something that made me want to enter an AUD/USD long position based on my method on a weekly chart. My intent was to see if I could get 300 to 500 pips from the upward move that I believed was coming. My trade was one standard lot, which took $1,200.00 of the demo account’s fake money to cover. My open trade, which I completely forget about most of the time, hit a high during the first week of April, going 385 pips in the money, or about $3,850.00, based on my standard lot. This would have obviously been an excellent return if I had paid attention to the trade and liquidated it, but an interesting side effect of not liquidating the trade is the amount of profit that has built up from the rollover. The rollover is the interest profit or expense that I previously mentioned in the carry trade. In this case, as of April 25, 2014, the rollover profit on the trade is $208.50; based on my $1,200.00 investment, this is nearly a 130% annualized return.

I am a shorter-term trader, so I never think about profiting from a position in this manner, but this trade has gotten my attention. Taking positions like this in a longer-term account may make a lot of sense because, not only do you have the opportunity for the capital gain, it may also provide a place to park smaller amounts of cash to gain a better return, versus the little or no return it can get in a bank. You would need over $41,000.00 in an interest bearing account for one year at .5% to earn about this same amount. If you can do the same thing in a fraction of the time, with a fraction of the money, it may be something to consider. This trade is still up over $2,000.00, but even if it wasn’t as long as it is in the money, the account is able to enjoy a very nice interest yield, which is something that is very rare today.

Stochastic Technical Indicator and Divergence

Today I am going to discuss the use of the Stochastic technical indicator. So what are Stochastics and how are they used? The Stochastic indicator is one of the most common indicators used in technical analysis. Dr. George Lane in the 1950’s promoted the Stochastic Oscillator. Today, Stochastics are used for technical analysis in most markets, including stocks, ETFs, options, and Forex.

The Stochastic technical indicator is used to measure the range and momentum of price movements. It is very important for traders to understand momentum, which is the rate of the rise or fall in price. The Stochastic indicator is measured on a scale from 0 to 100, with high and low levels that are generally set at 80 and 20 percent levels.

The Stochastic indicator is sometimes referred to as a leading indicator because it can identify a potential change in momentum, even before that change appears in the price action. This is referred to as divergence, which may indicate a potential change in direction of the trend in advance.

The Stochastic indicator shows the location of the closing price, relative to the recent high-low range. Many traders also use Stochastics to identify overbought and oversold areas, as well as identifying entries and exits, using the crosses of the %K and %D. However, I consider divergences as the most powerful use of Stochastics.

The way that divergence works is that when a new high or low in a security occurs, but is not followed by the Stochastic indicator, it indicates a potential trend reversal. For example, bearish divergence occurs when the price makes a higher high, but the Stochastic indicator makes a lower high. This shows that the upside momentum is slowing, even though prices are continuing to make new highs and a trend reversal lower is very likely.

Bearish Divergence
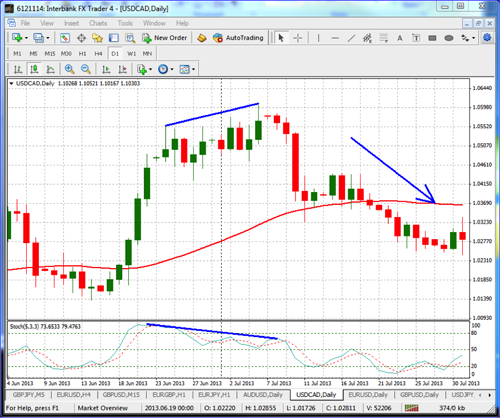
Bearish Divergence is the opposite of bullish divergence and occurs when prices are making new higher highs, and, at the same time, the Stochastic indicator is showing lower highs. For example, in the USD/CAD daily chart below, the Stochastic indicator is making lower highs at the same time the price action is setting higher highs. This bearish divergence could be used to indicate a possible trend reversal with the prices moving lower.

Bearish Divergence on the USD/CAD Chart

Bullish Divergence
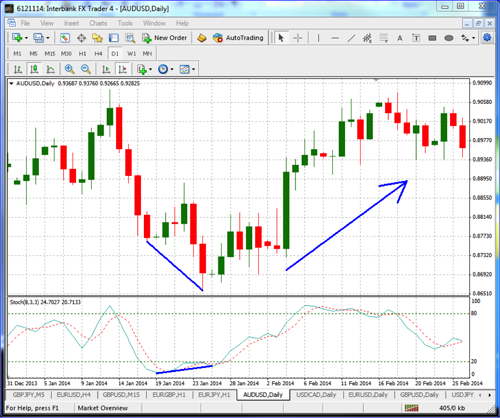
The AUD/USD daily chart example below is an example of bullish divergence. As the price action continued to lower, at the same time the Stochastic indicator in the lower window has started to move higher, thus indicating a potential change in the price movement or trend before the price action shows any real sign of a reversal. Note the significant change in trend direction after the bullish divergence is indicated.

Bullish Divergence on the AUD/USD Chart

Understanding the trend and potential reversals is one of the most important things to understand as a trader. So take some time to look for these divergence signals using the stochastic indicator. They don’t happen every day, but when they do, they are very powerful indicators of trend changes!

Key Ratios

In our article today we are going to discuss some of the key ratios that are looked at when evaluating our trading results. Many traders will discuss the Reward:Risk ratios that are used when they are trading in order to know if their risk might be too much. We are going to discuss two other ratios that are important to understand – Win:Loss and Average Win:Average Loss ratios are the ones we will be discussing.

The first ratio we will look at is the win:loss ratio. This ratio is not known before we trade; if it were, we could just take the winning trade and avoid the losing ones. Rather, this is a ratio that we look at to understand how well our method of trading works from a winning perspective. Many traders want to have as many wins as possible, but, in reality, this may not be the best way to trade. For example, many traders would say that having a win:loss ratio of 90:10 would be fantastic. This means that they are profitable 90 times out of 100, with only 10 losses. While, at the same time, they would look at a win:loss ratio of 10:90 as being horrible. With only 10 winners, out of 100 trades, you could see why this might not seem good. In reality, looking at the number of wins and losses is only a small part of the overall picture because we could be right 90% of the time and still not be profitable, while we could be right 10% and be profitable. The key to know is what is happening with our next ratio.

This next ratio that we need to look at is the average win:average loss ratio. This looks at how much we make when we have a winning trade and how much we lose when we take a loss. The way we identify this is to take all of our winning trades and add together how much we made, then divide it by the total number of winning trades; this will give you your average win per trade. You would do the same thing with the losing trades to get the average loss per trade. If our average win:average loss ratio is not proper, then we can have a large winning percentage and still lose money. On the other hand, if our average win:average loss ratio is good, we don’t need to worry as much about being right all of the time.

Let’s take a look at an example of both cases after 100 trades:

  1. 90% right, but average win of $1 and average loss of $10.
      1. 90 win x $1 (avg. win.) = $90
      2. 10 losses x $10 (avg. Loss) = $100
      3. Net loss of $10
  1. 10% right, but average win of $10 and average loss of $1.
      1. 10 wins x $10 (avg. win) = $100
      2. 90 losses x $1 (avg. loss) = $90
      3. Net profit of $10

As you look at both of these examples, you can see that the first one, being right 90% of the time, was a loser because the average losses were so big. While in the second example, being right only 10% of the time resulted in a profit because the losses were so small compared to the wins. Generally, you would not want to be on the extreme like these examples, but the point is that if we can have a good win:loss ratio, along with a good average win:average loss ratio, we can have a good system that we don’t need to be right all of the time and can still be profitable. Take some time to review these ratios on your own trading method to see what you might need to improve upon.

How Reliable is Backtesting?

One of the first things that traders want to know when they hear of a new trading strategy is what the results of backtesting are and over what period of time was the testing done. My opinion is that the bigger and more important question should be how reliable is backtesting, regardless of how long it was done? More times than not, it seems as though trading methods are created by looking at recently closed bars, but they are not always applied to the price action as it moves live. The creator, believing that they may have found something that will give them an edge over other competing traders, then goes back through their charts applying the method to past data. If they are being honest with themselves, they will stick very dogmatically to the rules that they have developed. However, often times, there will be moves in the market that are slightly out of sync with the method, but they work out to be profitable. This can lead to slight adjustments being made to accommodate the successful trades, which, of course, weren’t valid trades at all, based on the original method. This will typically happen at least a few times, so by the time backtesting is complete there is a different set of rules.

One could make the argument that this is a good thing because backtesting told you what would work and what would not work. Under the circumstances, however, often times, there are enough changes made to the method through backtesting that the original spirit of the method is gone. This may also mean that the original trades that generated the original idea may no longer be valid under the new set of criteria. In large part, this can be a circular exercise where the method is adjusted to fit past data, which can change its relevance to the original data that the method was based on.

When creating methods and backtesting them, we need to have the same discipline that is required to trade live. We must take whatever method we have created and apply it in an unbiased fashion with no adjustments or changes to affect the outcome of the data. When we do make changes to accommodate the past data, the data is flawed and, to a large extent, it becomes useless. What can work well, however, is if we recognize that there may be some helpful changes that can be made to the method, so we create a secondary method that includes the adjustments. Comparing the results of the new method to the results of the original method can be very helpful. If we consider the method to be a completely new method, every time we make a major change to it, we can then determine which version of the method works best and we may even come up with a hybrid of all of them, or something altogether new.

One problem that I have seen in myself in the past, and that I have seen in other traders as well, is that we want the methods that we create to work so badly that we are willing to lie to ourselves. We then tweak them sometimes beyond recognition, when, in most cases, it would be better to abandon them altogether in favor of a completely new idea. There is no “right” way to trade and there isn’t a “best” method; the right way and the best method to trade is the way that works best for any given trader and there is no one method or one idea that will work best for everyone. What will typically happen when we lie to ourselves in the backtesting phase of our method is that when we apply it to our live trading in real time, we may get disastrous results, which, of course, may cause us to change the method even further. This is what will lead us on a never-ending quest to find the perfect method, but we’re really just running in circles; we will never find what we are looking for because we are too scattered in our thought process and too willing to lie to ourselves to make ourselves feel successful. Focus on one idea until you determine that you should abandon it or replace it. Then move on to the next one, operating your trading business in an orderly fashion, just like any business should be run. You will eventually find the way that works best for you so you can move forward and actually make some money!

Trading Price Breakouts

Today I want to talk about a way to enter trades that takes advantage of the price action happening on the charts. Breakout trades are a commonly used as a way to enter trades. By looking at the price action it takes advantage of the momentum that happens on a break of a prior level of support or resistance. The important thing to know is where these levels of support and resistance are located. Although generally not an exact level, support and resistance can be looked at as areas where the price has a hard time moving. These areas, when broken, lead to good opportunities to buy or sell.

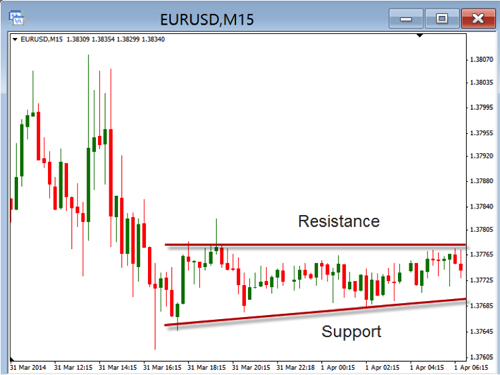
As you begin to look for these types of trades, you will want to first define the area where the price has been moving in a sideways or consolidating fashion. Take a look at the chart of silver below.

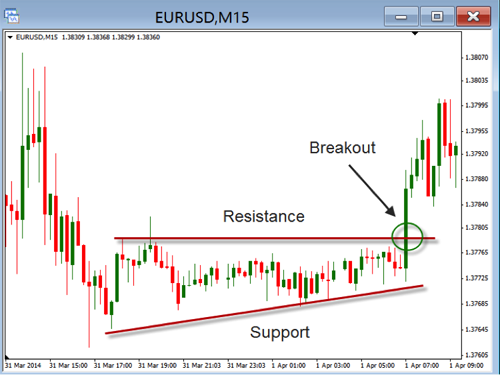
In this chart you can see the 15 min. candles have been moving sideways and consolidation between the area of resistance and support. As we identify this consolidation we can then begin to look for the price to break out of it and begin to move higher or lower. The chart below show what happened once the breakout occurred.

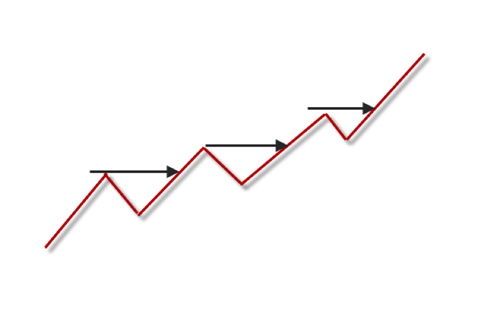
You can see that the price clearly move above the resistance to close out of the consolidation. This momentum move is one in which we would look for some continued bullish direction. In addition to trading the breakout of price support or resistance, we can look to enter trade on breaks of prior high or low swing area. Take a look at the illustration below.

In this picture above you can see that the black arrows are showing where the past swing highs were located. As you look to trade breakouts you can use these past swing highs to look for you entries. Similar to the breakouts we discussed above these points can be areas where the price continues to move in the direction of the break. The reverse would hold true if the trend was moving down and we were looking at the break of the swing lows.

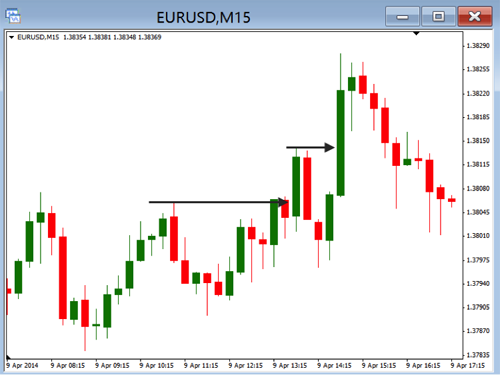
In the above chart you can see where these breakout points are shown but the black arrows. As you look for these type of breakouts you will want to make sure you have your stops set. Stops in both types of breakout should be place back below the prior area of support if the trend is up or above the area of resistance if the trend is down.

As you watch the price action on the charts break to new levels of highs or lows you will want to consider using breakout trades to enter the market. These entries are often times best entered by using buy and sell stop orders. Buy stop orders are place above the resistance area while the sell stops are place below the support areas. Once the price momentum begins to move through the support or resistance the trade will be placed.

Take some time to review what you are doing during the times when the price is beginning to breakout to see if taking these types of trade will help in your trading.

3-Step Guide to Creating a Written Trading Plan

It is really important for every trader to have a written trading plan. A good written trading plan can be broken down into three important parts.

First, any written trading plan should include a solid trading strategy or method with written rules. These rules should include market entry/exit strategies and current market conditions, depending on the markets traded, whether stocks, options, Forex, or ETFs. Also, the method should include active trade management strategies, such as trailing stops for exits, etc. These strategies should be backtested on previous data and forward tested on a demo/paper trading account by any user to help establish and maintain confidence in the method.

Second, a trading plan should include specific risk management rules with clear and understandable risk levels, including position size calculations in order to control the risk with each and every position entered. A good rule of thumb is to not risk any more than 2% on any one trade and no more than 12% maximum total risk in the account.

Third, any good trading plan should include a regular and repeatable routine. The more consistently a trader follows a set routine, the more consistently s/he will be with the implementation of a good trading strategy. Several traders have told me recently their biggest challenge is not finding a good strategy, but, rather, implementing a consistent routine. Once a routine is carried out consistently, trading success will become much more likely, depending on the market strategy.

A consistent routine is best written down as a checklist so that it is simple to use and repeat. Each individual trader needs to adapt a checklist to his/her individual needs. The checklist example below is an outline that will get a new trader started. Modifications should be made depending on the trader’s preferences, type of trading (day trading, swing trading, position trading) and trader’s experience.

A. Check on the current day’s economic calendar for any scheduled reports and announcements for the day – this covers the fundamental analysis. Check the expected numbers against reports that will be published during the day.

B. Check the charts for price action – this is mainly for a trader who trades using technical analysis. Normally, you will check to see if the prices have violated any support/resistance areas. For technical trading, some of the most popular indicators and tools used are Moving Averages, MACD, Stochastics or RSI.

C. Write down thoughts for that trading day while going through the checklist – this step is for the trader to write out trading ideas for the day, how much to risk, where to take the position, where to exit, and how large the position size to take.

D. After the trading session is over, or after the trading day is complete, it is important to document or journal each trade, with entry, exit, profit, loss, risk in trade, justification for entering, etc.

In conclusion, if you don’t already have a written trading plan with a simple, easy to use daily checklist, including the elements above, I strongly suggest you develop one. You can either use the example above or create one that fits your style and strategy. This will allow you to be a much better trader, with more consistent results!

Risk/Reward Ratio – It’s Value and Shortcomings

The risk/reward ratio is a long-standing measure of a trade’s performance. It is used to measure the performance of trades after they are over, as well as an indicator as to whether a specific trade should be considered. How useful it actually is to any given trader is largely dependent upon their trading style and the method or system that they employ.

The ratio is typically expressed in multiples of “R”, “R” being the risk factor of a trade. A trade’s risk is typically measured from its entry point to its protective stop. The greater the profit of a trade is, as a multiple of “R”, the better the trade’s results are considered to be. If the entry price per share for a long trade was $50.00, with a protective stop of $48.00, we have a 4%, or a $2.00 risk, or “R” value, on the trade. A common thought process is that if the trade yields a return that is 2 or 3 times the risk, then it is a good trade and, for a potential trade, if the expected return is 2 or 3 times the risk, it is a trade that most traders would participate in.

This works well and it all makes sense as long as your stop does not change and remains constant throughout the life of the trade. But, as soon as we change our stop, we change the current ratio and, I believe, that changes the initial ratio’s relevance. When we change the ratio, what is it telling us and how important was its value to begin with? If a trader has a trading style that dictates that the parameters of their trades stay constant throughout the life of their trades, the ratio will remain constant. But what happens if a trader employs a trading method that dictates that the protective stop is moved, either manually, at regular intervals, or by using a broker’s trailing stop? Of course the original risk/reward ratio will not change, but is that relevant as the trade progresses and we move our stop, protecting more and more unrealized profits? How much of a difference did it make that the beginning point of a trade had a given risk/reward factor?

I have also spoken to traders over the past several years that use the philosophy that once they setup their trade, they live and die with it; if it is successful, they will win, and if not, they will accept the loss. If that is the prevailing thought process, then using the risk/reward ratio as a measure of past trades, as well as potential trades, makes a lot of sense. I typically do not have this particular thought process. I believe that the primary goal of my trading is to increase the value of my trading account and my overall net worth, regardless of how it is done. I don’t believe that any one trade is that important to my success, so I am more than willing to move my stop as quickly as is practical, under the given circumstances, and I really like moving my stop to the breakeven level. I will also employ the broker’s automated trailing stop when I can. Based on this style of trading, I have found that I rarely even think about the risk/reward ratio, with the only occasional exception being at the beginning of a few trades that I am considering.

I have spoken to some traders throughout the years that are very insistent that a specific risk/reward ratio be met before they would even consider participating in a trade; some can be almost boastful about how staunchly they follow this rule, which, of course, is fine, I am just not sure how much it actually tells them. Some traders will flat out tell me that the reason that they look for a specific multiple of “R” is because some self-proclaimed trading guru states that is what should be done. Generally speaking, I believe that, unless a so-called trading guru can show you their specific results, there isn’t much of a reason to pay attention to them. Anyone can pontificate about any subject, and trading is no different. Just because someone claims to be an expert trader, it does not mean that they are, and, even if they are, it doesn’t necessarily means that their trading ideas and rules are applicable to anything that you are doing. Though trading is largely technically oriented, there is an infinite number of ways to trade, so being creative and finding what works best for you is usually the best thing to do.

Update on Gold

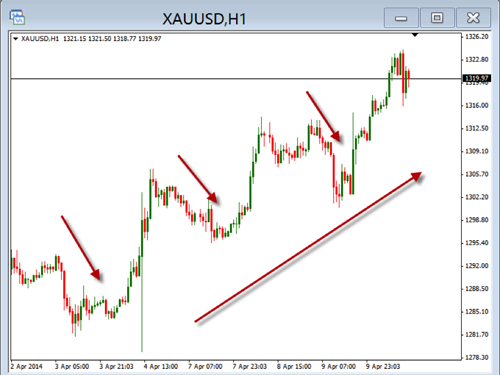
Today we are going to look at several charts of gold to look at the long, intermediate, and short-term trading opportunities. We will first look at the daily charts to see the overall trend that is happening, then drop down to the 4-hour chart, and, finally, look at the 1-hour chart to look for some potential opportunities.

Daily Chart

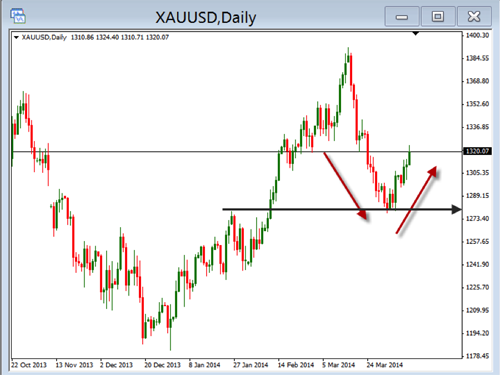
As we look at the daily chart, we can see a couple of important things. First of all, you should recognize that the price had a very strong move up this year, followed by a strong retracement. This retracement is where the down red arrow is on the chart. The black horizontal arrow is showing an area that acted like support. Finally, the up red arrow shows the bullish move back in the direction of the prior trend. With this bullish momentum, we could look for some trading setup on the daily chart to go long or we could use it to indicate that we should be looking to buy on the shorter time frame charts.

4-Hour Chart

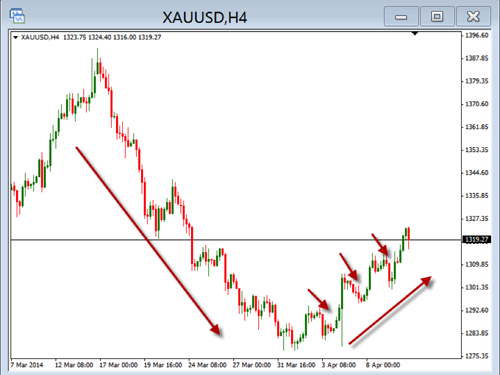
In this 4-hour chart, you can see a bit clearer the retracement and the new bullish move back up. I have drawn on here 3 small down arrows, which represent small pullbacks during this most recent bullish move. These pullbacks are areas where we might look to enter a long trade. Currently, the price has moved up and is likely to pull back again. Once this happens, we could look for an entry on a bullish bounce up from the support area.

1-Hour Chart


In this chart, you can see an even closer look at the times where the pullbacks happened. By waiting for these pullbacks, we can look to enter in at good times. As the price begins to move back up, we would look to place our trades in the direction of the current momentum.

We could continue our look at the shorter-term charts by going down to the 30-min or 15-min in order to find even shorter-term setups. Regardless of the time frames you are trading, it is a good idea to look at multiple charts in order to see the bigger picture.

So, as far as the current gold situation goes, we are looking at some bullish momentum, but have not seen the pullback we need in order to place a long trade. As we continue to watch for entry, we will want to see this pullback before going long. Once this happens, we will then be prepared to enter a long position for gold. As always, make sure you keep your risk at a comfortable level so you can continue to trade, even if you take a loss.

In addition to looking at gold, you may want to consider silver as a trade. You would look for the same things on the same time frame charts as we did for gold. After you do your evaluation, you should have a level of comfort that will allow you to take trades, knowing you have looked at all the key elements. Take some time to review this so you can have the confidence you need.

The Basics of Call and Put Options

Today I am going to discuss a basic strategy for buying call and put options. Let me caution everyone that options carry some additional inherent risk over buying or selling short the underlying security because options contracts expire, and you are leveraging your money, which carries additional risk as well. This is not meant to be a comprehensive lesson, but more of an introduction to the basic concept. I would suggest, if you are interested in buying puts and calls, that you find some additional options education and you paper trade several positions before putting real money on the line.

Here are 3 keys to make simple options trading more successful:

  1. Find highly correlated call and put options with a delta coefficient of 0.8 or better. The best correlated options to their underlying securities are the options with a high delta coefficient, commonly just referred to as the “delta”. This is the ratio comparing the change in the price of the underlying security to the corresponding change in the price of an option. For example, with respect to call options, a delta of 0.8 means that, for every $1.00 the underlying stock increases, the call option will increase by about $0.80. For put options, the delta coefficient, on the other hand, will be negative, meaning with a -0.8 delta, for every $1 the underlying security goes down, the put option will go up roughly $0.80.
  1. Find call and put options with more than 500 contracts outstanding. A call or put options is a contract that gives the owner the right, but not the obligation, to buy 100 shares of the underlying security. The fewer contracts that are outstanding, the more thinly held the option is. Avoid thinly traded call and put options with fewer than 500 contracts outstanding, as these options will have lower liquidity and inherently higher risk. The higher the open interest, the better. Also note that open interest is different than daily trading volume, which has little or no effect on open interest.
  1. Use risk management rules to avoid overleveraging. This is VERY IMPORTANT! Call and put options are much less expensive than if you were going to purchase shares of the underlying security, often many times lower. Therefore, it is tempting to want to purchase more call or put options than is prudent from a risk management perspective. For example, if you want to keep your risk profile in your account to a maximum of 1% risk for any specific position and, to do that, you would be purchasing 100 shares of a given stock to maintain that risk profile, you would be limited to purchasing 1 call option contract that controls 100 shares to keep the risk profile the same. If you purchased 4 call options contracts, you would be controlling 400 shares and, with the equivalent stop loss levels, would be carrying 4 times more risk than the 100 shares you would have purchased based on the 1% risk in the example above. Therefore, it is important to calculate the number of underlying shares you would purchase of the underlying security and then purchase the corresponding number of contracts to control that number of shares. For example, if you would purchase 200 shares of a stock you should only purchase 2 call options contracts. This will keep you from overleveraging your account on that position.

Follow these 3 rules, find options with a high delta (0.8 or higher), open interest above 500, and don’t overleverage or buy too many contracts for your risk profile. These rules may help trading call and put options in an effective and successful way for you to trade the stock market. Again, make sure, if you are interested in options trading, that you paper trade first and get some additional options training before you put live money on the line.