Know How to Lose

Speaking with many different new traders, we often hear them speaking about how much money they want to make when they are trading. They speak about things like their winning percentage and how much they are going to make with each winning trade. They focus on the great vacation they are going to take, the new car they are going to buy, quitting their jobs, and many other wonderful and worthwhile things they want to do with all the money they are going to make. While it is important to have dream and set lofty goals, oftentimes, this approach to trading can cause us to become poor traders. Generally speaking, we can pick out new traders from experienced traders by listening to what they talk about. Like I said, new traders focus on their wins, while experienced traders focus on their losses.

While this might seem a little strange, the fact is, experienced traders know that, if they do not focus on their losses, they end up losing control of their trading. Newer traders, while understanding that they need to control losses, have not learned the importance of this concept. If you cannot control your losses, eventually they will control you. There are several things that you need to know in relationship to your trading losses.

First, know how much you are willing to lose in each trade and in each day. By setting your loss limit, you will know when you must stop your trade. Many traders will set a per trade risk amount that they are willing to lose on each trade. Someone might be comfortable risking 1% on any single trade they take. This means that they have set a limit to what they are willing to lose every time they take a trade. This is the easy part when it comes to knowing how to lose. The hard part is to actually take the loss when it happens. A simple way to do this is to just set a stop loss and leave it alone. Traders who do not do this end up taking bigger losses because they become afraid to take the loss when they are supposed to.

Another way to make it easier to take our loss is to trade a smaller risk amount. If you are finding it difficult to take a 1% loss, then you need to trade smaller. There is nothing wrong with starting with very small trade sizes if it allows you to better take the loss when you are supposed to. As you become comfortable with taking the losses when you need to, you can then gradually increase the amount you are risking to a higher level.

As you begin to focus on learning how to take your losses, you will find that you will become better and more consistent at winning. Your wins will take care of themselves as you take care of your losses. Becoming proficient at taking losses will put you closer to becoming the successful trader you want to be. Take some time to review how you take your losses so you can make the changes you need to in order to become the best trader possible.
The State of the Economy

Lately the economic news that has been coming out of Washington has not exactly been stellar, though our economy does seem to be holding its own somehow. This has contributed to the stock market gyrating daily by a good amount. It seems as though it is very common these days for the market to make a big move at the open, one way or the other, but by the end of the trading day, it has either given back a lot of what it has gained or it has gained back a lot of what it gave up early. So though there has been a lot of activity, there hasn’t necessarily been a lot accomplished by the activity. From a trader’s standpoint, we don’t really care which way the market goes, we just want it to go, so this spiky up and down, non-directional movement can be annoying.

Economic reports have been coming out with largely mixed results with, possibly, a downside bias. There has been a lot of recent optimism about the drop in oil prices, which I have to agree is a good thing. I don’t know anyone that isn’t enjoying the lower prices that we have recently been seeing. The thing that I found odd about this is that the most recent retail reports that have come out, which are reporting on December 2014 sales, have been well below what the analysts expected. This means, of course, that people spent less money around the holidays than what was expected. The thing that I find odd about this is that the reason economists believed that people would spend more around the holidays is because of the drop in oil prices; they believed that, since people are paying less for a gallon of gas, they would spend that money elsewhere.

I’m not sure why they had this thought process because it seems to me to be a little out of touch with reality. If the average person is living paycheck to paycheck and all of the sudden they get a reprieve in one of their monthly expenses, such as the price of gas, they have more disposable income each month. But I’m not sure what would lead anyone to believe that they are going to take that savings and spend it, leaving themselves in no better position than they were in when the price of a gallon of gas was higher. It seems like common sense to me that most people, or at least many people that are in that situation, would not spend the money that they are saving on gas, but, instead, they would keep it, giving themselves a little more room, financially, each month. It seems peculiar to me that this was such a surprise to the economists; it almost seems as though they are out of touch with reality or at least with what the average person’s reality may be.

There have definitely been times in the past where the average household was earning more money and, subsequently, spending that money on large ticket items or on lower to medium priced luxury items, but that was occurring several years ago, before the great recession, and when the economy, as a whole, was doing very well. We have recently gone through the aforementioned great recession, more people are back to work, but wages have been falling, or at least not rising, and there is a lot of uncertainty about the economy in nearly every newspaper you read or every TV news show that you watch. I believe that common sense in this case would be that if people are able to save money in a given area of their monthly expenses, there is virtually no reason to put it out in other areas; there is no reason to be that confident in our current economic situation. Keep as much money as you can in reserves for a rainy day because, as we have seen in the recent past, the rainy days that people always talk about actually do happen.

End-of-Day Forex Trading

Most good charting software and trading platforms, provided by a good broker or bank, include the ability to plot daily bar charts where the daily bar “closes” at 5:00 p.m. EST. This time is selected because it is coincident with the New York session “close” and the Sydney “open”, which is a relatively quiet time in most markets until the Tokyo session begins at 7:00 p.m. EST, followed by the London (and European) session beginning at 3:00 a.m. EST. We can then use these daily bar charts to develop trading strategies that require only the use of these charts without requiring intraday charts.

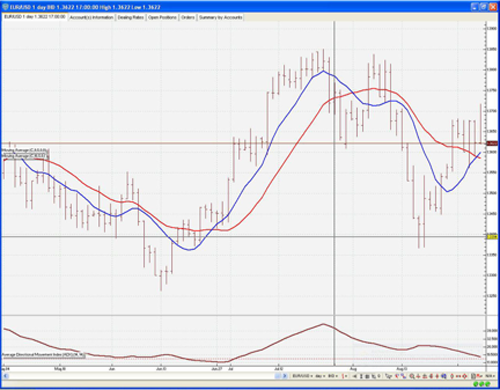
Figure 1: EUR/USD Daily Chart

Figure 1 shows a plot of a daily chart for the EUR/USD pair using VT Trader, which is a widely used and representative charting software and trading platform. On this chart, each bar represents one day’s trading activity from the high price of the day to the low price of the day. The horizontal mark to the left of a daily bar is the open for the day (this is based on the first trade after 5:00 p.m. EST). The horizontal mark to the right of a daily bar is the close for the day (this is based on the last trade as of 5:00 p.m. EST). So, as you can see, daily bar charts are readily available in the 24/7 Forex markets.

Also plotted on this chart are a few technical indicators. Two simple moving averages are plotted in blue and red and the ADX indicator is plotted at the bottom in brown. A simple moving average is calculated by adding up the prices for a number of bars and dividing that sum by the same number of bars. Moving averages help to determine the prevailing trends of the market. The ADX indicator is a complex formula that helps to determine the degree of trendiness of a market. These are only a few of the indicators that are available through VT Trader in applying technical analysis.

If you look closely at the chart from left to right, you can see that this market was in an uptrend and then later formed a double top before falling into a downtrend, only to reverse again into an uptrend at the end of the chart. This type of behavior is typical of what you can expect to see on a daily chart and these shorter-term trends can definitely be traded using good end-of-day trading methods.

A good end-of-day trading method should be based on an evaluation of the market after the daily bar “closes” at 5:00 p.m. EST for trade opportunities to be considered after the open of the next bar, which occurs as of the first trade after 5:00 p.m. EST. In actual practice, because the markets are relatively quiet during this time, trades for the new daily bar can be placed anywhere from 5:00 p.m. to 7:00 p.m. EST, when the Tokyo session begins. Trading in this manner then requires only a few minutes each day, at the same time, without worrying about an open position if it is properly protected with stops and profit targets.

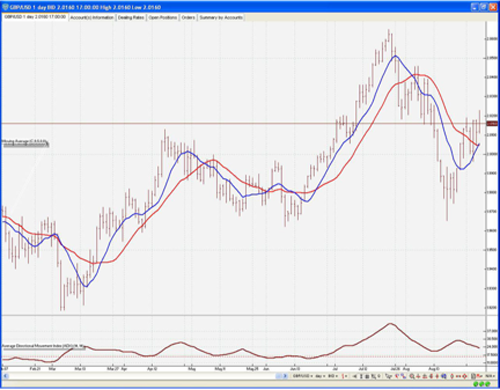
Figure 2: GBP/USD Daily Chart

Figure 2 shows a plot of a daily chart for the GBP/USD pair using VT Trader with the same technical indicators as the previous chart. With this software, it is a simple matter to toggle from one pair to the other for quick visual analysis.

If you look closely at the chart from left to right again, you can see that this market was chopping sideways until a major move up occurred over a period of more than 20 days and then the market reversed abruptly and retraced that entire gain even faster, after which a new rally started. Again, this type of behavior is typical of what you can expect to see on a daily chart and these shorter-term trends can definitely be traded using good end-of-day trading methods. You can also see that if you do not pay close attention to risk management that these abrupt swings could do great damage to your account. Like any endeavor that offers great reward, you must get the proper education and training in order to stay out of trouble and realize that potential.

Financial Goals for the New Year

If you didn’t set your financial goals for 2015, before the end of 2014, you may be late in doing so. But even though the New Year has already begun, setting goals for the year as soon as possible is still a good idea. If you don’t, you may experience the old adage, “If you fail to plan, you plan to fail.” So sitting down and spending time on what you want to accomplish this year is essential. You rarely get anywhere, at least not efficiently, if you don’t plan your journey ahead of time. I understand that, for many people, talking about finances is at, or near, the bottom of their list of things they want to do. But if you put the time into mapping out your goals, each year thereafter, your financial goal setting will be much easier. If you set your 2015 goals as soon as possible, at the end of this year, you will have nearly a year of data to review to see what worked and what didn’t. Going forward, it is more about modifying an existing plan than it is creating a new plan from scratch, so sitting down and doing the hard work now makes everything easier in the future.

Generally speaking, planning for the future in all aspects of one’s life is a good idea, but the way that our society works today, and the way our economy is structured, it is possibly more important now than it was at anytime in the past to plan for your financial future. In the past, people worried about the future a lot less because, if they were employees that worked for large corporations, they were typically guaranteed retirement income and retirement benefits for life, which may no longer be the case. This put them in the position where they could concentrate on other financial goals without the need to emphasize retirement. Today, even people that are working for large corporations, from a retirement standpoint, are not much different than self-employed people or any other person that doesn’t have guaranteed retirement benefits. People with no retirement benefits have to create the benefits on their own through savings and proper investing of the funds that are earmarked for retirement. In today’s world, many people who work for large corporations are no different in this regard because, in many companies and industries, pension plans have gone away. Even for people who think they have a guaranteed pension, based on what we have seen over the past several years, it may not be as guaranteed as they think it is.

If we didn’t learn anything else in the recent past, what we should have learned is that, even for those of us who do have a pension plan, to look forward, we still need to have a plan B. In this case, plan B would look a lot like what a person’s plan is that does not have a pension plan in place. Regardless of what our position will be during retirement, or whatever the goal that we’re actually saving for is, we need a plan to get there. Laying out the initial plan is the hard part, everything after that is, basically, maintenance. Our financial plans are just like any other plans – over time, they need to be updated, adjusted, improved upon and, in some cases, overhauled altogether, but the bottom line is whatever we want to do in the future, there’s no better time to start the planning process than right now.

Many people are resistant to putting together a financial plan for themselves because it takes discipline to do it and even more discipline to follow it. Some people won’t do it because they don’t believe that it will ever do much good for them, they don’t have a long-term vision. The truth is that having even minimal financial goals is better than not having any at all. It is late to plan for 2015, but it is definitely not too late. If nothing else, planning now for the remainder of 2015 could be looked at as a precursor to our 2016 planning when we’ll have another chance to plan in a timely fashion.

The Basics of Forex

Unlike stocks and futures that trade through exchanges or the NASDAQ, Forex trading is done through market makers that include major banks as well as small to large brokerage firms located around the world who collectively make a market on a 24/7 basis. The Forex market is always “open” and is the largest financial network in the world with a daily average turnover of trillions of dollars.

Forex trading involves trading currency pairs, such as the EUR/USD pair (Euro Dollar/US Dollar pair), where a buyer of this pair would actually be buying the Euro Dollar and simultaneously selling short the US Dollar.

The format of a Forex pair is YYY/ZZZ, where the first currency, YYY, is called the “base” currency and the second currency, ZZZ, is called the “counter” currency. The price for a Forex pair is expressed in terms of the counter currency.

The price of the EUR/USD pair is expressed in US dollars, the counter currency, as 1.3667, for example. This means that the base currency, the Euro dollar, in this case, equals US $1.3667. The price of the USD/JPY pair is expressed in Japanese Yen as 108.02, because, for this pair, the Japanese Yen is the counter currency. This means that the base currency, the US dollar, in this case, equals 108.02 Japanese Yen.

Prices are expressed in pips, which are nothing more than the minimum increment that a currency pair price can change. For example, if the EUR/USD price changes from 1.3790 to 1.3791, the price is said to have gone up by 1 pip. Most major pairs are priced to 4 decimals, which is the equivalent of 1/100th of 1%. The exception would be the Japanese Yen pair that only trades to 2 decimals. This is because there are usually over 100 yen to the dollar.

Forex pair quotes are on a bid-ask basis. The bid is the price that the market is willing to pay a seller at a point in time for a specific currency pair. The ask is the price that the market is willing to sell to a buyer at a point in time for a specific currency pair. The difference between the bid and the ask is called the bid/ask spread. For example, a typical EUR/USD quote could be 1.3784 bid / 1.3787 ask, which is a spread of 3 pips. Since the spread is how the market makers are compensated, there is no commission when placing a trade.

It is also important to note that the spread will vary depending on market conditions. So the quote itself, for any given Forex pair, is the bid/ask combination, at a point in time, based on the market driven floating exchange rate. The quotation lists the bid price first, then the ask price. For the EUR/USD example above, the quote would be expressed simply as 1.3784/1.3787 or 1.3784/87.

Trading is done in lots, either a 100,000 unit standard or 10,000 unit mini lot. For example, for a standard lot purchase, if the EUR/USD quote was 1.3784/1.3787, then buying a EUR/USD pair means buying 100,000 Euro dollars and selling short $137,870 US dollars. Therefore, for a standard lot in which the USD is the counter currency, 1 pip will equal $10 ($1 for a mini lot). For other major counter currency pairs, 1 pip will range from $8 to $10.

Forex dealers offer leverage as high as 100:1 and sometimes higher. At 100:1 leverage, 1 standard lot pair, in which the USD is the base currency, would require $1,000 in margin ($100,000/100). On the other hand, a 1 mini lot pair would require only $100 in margin ($10,000/100). If the account value falls below the margin requirement, the dealer will close out the trade automatically.

Buy-and-Hold Investing is Dead

Buy-and-Hold investing may have worked decades ago, but I’m about to show you that it’s a losing strategy now and I believe it will never be a viable option again, at least not in our lifetimes.

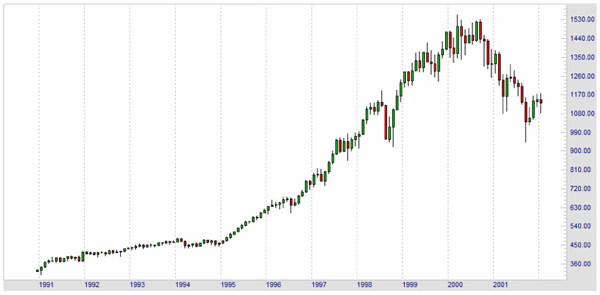
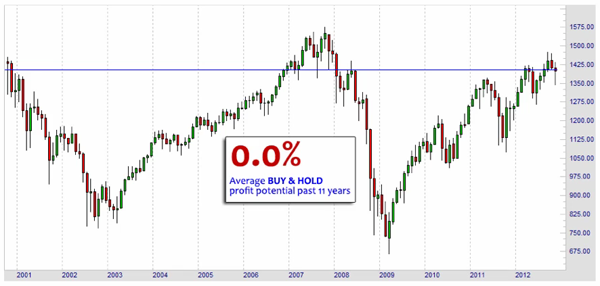
Look at this S&P 500 chart from 1991 through the end of 2001:

For the first nine years of this chart, the buy-and-hold strategy was probably a good move. You didn’t have to be a genius to have a good shot at making money in the markets, but it all started to fall apart around 2001. However, most investors thought the market would correct and continue its climb, like it did for most of the ‘90s.

Well, of course, that didn’t happen, as you can see in this S&P 500 chart for the next ten years:

This decade pretty much put the final nail in the coffin of the buy-and-hold investing strategy. Over a period of eleven years, the S&P 500 was flat after experiencing many huge ups and downs. Almost everybody who had open positions in early 2008 went into shock by the end of that year when the market crashed hard. You can see, by looking at the chart, that the general market dropped over 50% and individual portfolios dropped even more than that. Why? Because they had no exit strategy and if you have no exit strategy, you are constantly vulnerable to dramatic collapses in the market at any time. These collapses have happened several times in the past, and they’re going to happen several times in the future. Just ask yourself, “Would it be okay with you if your portfolio dropped by 50%?” If your answer is, “No”, then ask yourself what you are doing to protect yourself against that possibility, because it will happen again. Of course there’s no way to predict any of these market moves, but the good news is that you don’t have to predict anything to be able to have the potential to make a lot of money in a market like this.

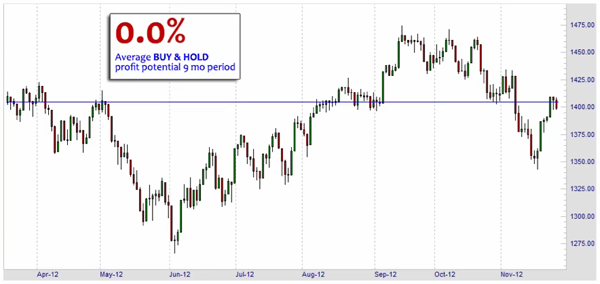
Let me show you what I mean – here’s another chart of the S&P 500, this time, zoomed in to a recent nine-month period:

A buy-and-hold investor would have seen their portfolio at break-even over this period, and that’s if they were able to keep their positions open and ride out the storm, which is very tough to do. What do you tell your spouse when you have to cancel that vacation you were planning on taking because you just took a big loss and you have no idea how to recover? It’s not an easy situation to be in.

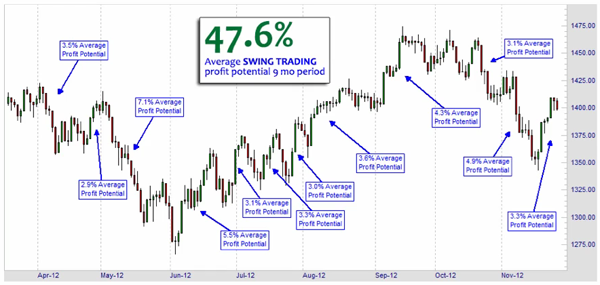
If you look at the same nine-month period through the eyes of a trader, this is what you see:

A whopping 47.6% of profit potential by swing trading the short-term trends that are, literally, everywhere on this chart. Just to be clear, this is assuming you’re using a good swing trading method and this is profit potential. It doesn’t mean you would have made 47.6%, but it does mean that a good method had a good chance of getting a lot of that potential, and that’s exactly what short-term swing traders do.

So the choice is really yours. There are two different realities and the question you should be asking yourself is which one do you choose? In the training videos, I’ll be teaching you how to go after the 47.6% of profit potential in this example. Sometimes there’ll be less potential, sometimes there could be a whole lot more. The bottom line is that, once you have a step-by-step plan, you’ll know exactly how to take advantage of any market, no matter what happens.

Start 2015 with a Solid Risk Management Plan!

Many traders get into trouble if they trade on emotions instead of rules. Just like you need rules to tell you when to enter and exit a trade, you need rules to limit your risk in your trades. In fact, trading without a risk management plan can lead to big losses and potentially ruin your trading account no matter how good your trading system is. Many traders don’t have a formal risk management plan or, if they have one, they may not be consistent in following it. By contrast, professional traders have very specific risk management rules that they follow consistently.

Your risk management rules should incorporate clear risk levels, including position size calculations in order to control your risk or exposure for each and every position entered. The most important key to successful trading truly is risk management. I would even say that risk management is more important than the method or the system you use to trade!

Remember this, even if you have a good system that works very well most of the time, no system can remove all market risk. There is no perfect system! Therefore, the only way to be successful in the long run as a trader is to manage the risk you take with each and every trade. Said another way, the very best of systems can only put the probabilities in your favor and minimize losses, not eliminate them. With each trade you take, you should know how much of your account is at risk if the market moves against you due to anything that you cannot predict. Here are two rules that, if you develop and follow, will help you manage your risk effectively.

The first rule of risk management is to always use a stop loss. Nobody likes to take a loss, and I am no different; however, by managing your risk on every trade, you will adhere to the “slow and steady wins the race” theory of investing and never go for the “home run” trade.

The second rule to managing your risk is to manage your position sizes. You should never get into a position where you are risking too much of your account on just a couple of trades. Instead, if you follow the 1% (2% maximum) rule, or only risking 1% of your account on any one specific trade, limit the total number of trades to a maximum of 10, or 10% total risk at any one time, and use proper stop loss and trailing stop orders when you get into trades, you will be able to sleep a whole lot better at night knowing that you will never be in a “bet the farm” type of position.

So if you don’t have a written plan, take the time to write down risk management rules as a part of your overall trading plan. Then, once you have determined what these rules are, it is very important that you apply them consistently to every trade you enter. This will help you to be much more consistent and disciplined with your trades if you follow your plan. Also, if you always have good risk management, you will have much lower anxiety levels as you trade!

How Do I Know Which ETFs to Buy?

Like you do with stocks, you have at least a few broad choices to determine what ETFs to buy. You can use one of three: fundamental analysis, technical analysis, or a combination of the two.

With fundamental analysis, you are trying to analyze economic factors, financial performance, competitive strengths and weaknesses, growth rates, threats to the business, and so on, of the units (stocks, bonds, etc.) held by the fund. From that analysis, you can select the best funds to buy. Another fundamental strategy is to switch in and out of different ETFs on a rotational basis to those that appear to be the leaders at any point in time.

Most fundamental approaches to investing in ETFs include a buy and hold kind of strategy, where you are always 100% invested. One of the big problems with this approach is a long portfolio of ETFs will get hammered in a bear market and take, possibly, years to recover to the initial investment level, which is no different than would be in the case of individual stock or bond trading.

With technical analysis, you are trying to analyze the action of the ETF share prices using trend lines, support and resistance levels, moving averages, and countless other price-related indicators to determine good trading opportunities. Technical analysis is based on the belief that all fundamentals are already comprehended in the price of the shares and, so, an analysis of price is all that is required to make trading decisions.

Most technical analysis approaches involve trading in and out of ETFs for a relatively short time frame, rather than always being in the market, fully invested, thus having the potential to stay in cash or be predominantly short in a bear market. The challenge for technical analysts is to develop an edge when trading the markets with common technical indicators, but using uncommon trading tactics.

I believe the best approach to trading ETFs is with swing trading. Swing trading is a commonly used term to describe any method of trading whose trade duration lasts from a few days to a few weeks, using daily charts. Position trading, on the other hand, is any method of trading whose trade duration lasts from weeks to months. The next category would be investing, which is typically viewed as being in a position for months to years.

Swing trading gets its name from putting on trades that attempt to capture swing moves, typical of a bull market, from a swing low (when the market corrects down after a sustained rally and then begins to go up once again) to a new swing high, which would mark the end of the new rally. Or, in a bear market, where the market makes a swing high (when the market rallies up after a sustained move down and then begins to go down once again) to a new swing low, which would mark the end of the new leg down.

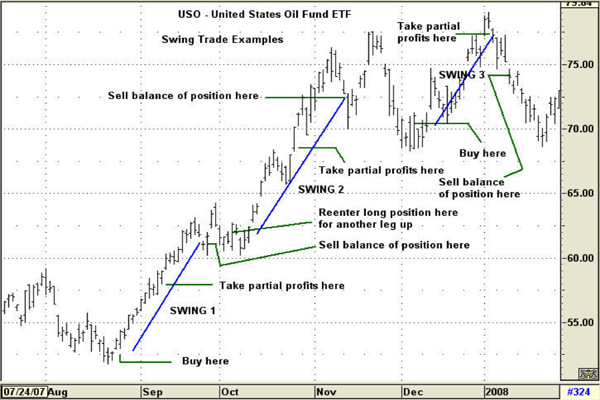
Here is an example of swing trades that could have been made with good trading methods with USO – United States Oil Fund ETF.

This has been plotted using Advanced GET charting software:

Swing Trading Examples

There are many methods available that can be classified as swing trading methods. Some are good and some are not.

I believe that swing trading, with the right methods, is the best way to trade ETFs for a few reasons:

  1. I believe that the trader has the opportunity to achieve the greatest gain for the time invested, meaning that only end of day data is considered in making trading decisions and, consequently, it is not necessary to sit in front of a computer all day long during market hours.
  1. With swing trading, you have the opportunity to use your account dollars more efficiently. For example, if it were possible to gain 10% in one trade, lasting for 3 weeks, and then redeploying those same funds in the next trade opportunity, wouldn’t that be better than tying up those same funds for a 1 year trade that yielded 10%?
  1. I believe you can use much tighter stops than is possible for methods aimed at longer trade durations.

New Year Trading

Happy New Year to everyone! I hope you have taken some time to review your trading from this last year and are all ready to go for 2015. If not, it is still not too late to evaluate and make changes. As we enter into the first full week of trading, we still need to recognize that there may continue to be more volatility in the markets. This is a good time to review our risk management rule for our trading.

We often times hear that we should not risk more than 2% of our account in any single trade. While this is true, it may also give us a false sense of security. If 2% is our maximum amount, that means we are able to risk less than 2%. In fact, it may be a good idea to set a lower maximum amount as we first begin to learn how to trade. By risking less, we are going to be less emotional when we take a loss because the loss will be relatively small. Too many traders are more concerned about winning that they forget they need to control their losses. By controlling our losses, we are able to trade more freely.

One of the most important parts to our success in trading is to know how to take our losses and how to keep these losses small. Oftentimes, traders will begin trading with a set stop loss but end up moving it because they are afraid to take the loss. If we are not willing to close the trade at our stop loss point, we need to move it to where we will be comfortable taking the loss.

This might mean that we have a larger stop loss on our trades. Some traders feel that this is not a good thing and that a tight stop loss is better. The problem that a tight stop loss brings us is that we will get stopped out quickly if the price moves a little. They feel that having a tight stop loss is less risky because they are not letting the price move against them much. Again, if it is too close, we can get stopped out in the normal price fluctuations – this is NOT a good thing. On the other hand, if we have a wider stop loss, we are giving our trades the opportunity to allow for the normal fluctuation that happen in the market. We won’t get stopped out prematurely causing us to become frustrated with our trading.

The fact is if we are setting our position size based off of a certain percentage risk, we are risking the same, regardless of having a wide or tight stop loss. Wider stop losses will simply have us trading with a smaller position size. Learn to place your stop loss in the appropriate place and you will find that you stay in trades longer, giving you the opportunity for success.

Take some time to review you risk rules for your trading so you can trade better in 2015 than you did in 2014!