Practice Stock Trading By Swing Trading

So, which is the better way to invest in stocks; buy-and-hold investing or swing trading?

For decades now “Wall Street,” has preached that the only “safe” way to invest in stocks successfully is to buy-and-hold for the long run.  Wall Street “experts” have claimed there’s no reliable way to time the market, and you have to be fully invested at all times to benefit from the growth potential that equities offer in the long term. But, does this traditional stock investing philosophy stand up to the current reality?

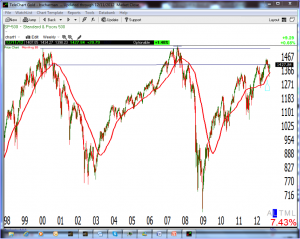
Let’s look at the current chart of the S&P 500 below as of the close of Tuesday December 11, 2012.   Note that it closed at 1427.84 which is LOWER than the high 4 years ago of 1557 in 2008, and is also lower than the high of 1500 in 1999 over 12 years ago.   As we look back 12 years ago and see that the market has not risen, but has actually gone down. There is literally NO growth in the last 12 years, but actually has a loss over time for the buy and hold investor.  Note there have also been periods when the market has been down significantly from the highs during the last 12 years only to barely climb back to the previous highs, without really breaking any new ground.

The investor’s who were betting on the “buy and hold” strategy to increase their portfolio over the last 12 years, have not only “lost” net worth but have lost more than a decade of opportunity!  One contributing factor to this slow down in overall growth are the almost continual bubbles and market corrections due to economic uncertainty.  First, the Internet bubble bursting at the end of 1998, then the attacks on the World Trade Center in Sept 2001 and the recession that followed, then the Real Estate Bubble in 2008, now we see the current debt bubble building in the European Union and here in the United States.  These bubbles create a lot of volatility in the market and lead to market swings and profitable trading opportunities.  And there doesn’t seem to be an end to these bubbles in sight.  Because of these “swings” the market has had tremendous movement over the past few years; therefore an active swing type of trading would have been much better and more profitable strategy

While many on Wall Street won’t admit it, the time for making money using buy and hold strategies are gone.  The best strategies over the last 12 years have been swing type strategies that take advantage of both the swings up and swings down in the market by both buying in the up trends and selling short in the down trends.

Swing trading has also become much easier and less expensive with the maturing of the internet over the last few years, giving “active” swing trader’s easier access to online brokers and broader investment choices like ETF’s, cheaper commissions, and cheaper, easier to use trading tools.

The old line brokers, still make loads of money selling “buy and hold” mutual funds to investor’s, 401k accounts, for example. The brokerages who issue mutual funds really hope that these accounts become more of a “buy and forget” investment, so they can continue to rake in billions in management fees.

With all of the tools now available, along with the strategies and new instruments available, smart and savvy investors have all but abandoned the “buy and hold” philosophy, in favor of more “active” swing strategies. In light of the fact that going back 4 years or 12 years the overall market hasn’t gone up but is actually lower; who can argue?

Trader’s Challenge: Buy and holder investors- Find a good short term or long term swing trading method (depending on your individual trading style) and take a more active role in your financial/investing future.

 

Out Of Control Politicians + Internet Stock Trading = Trouble

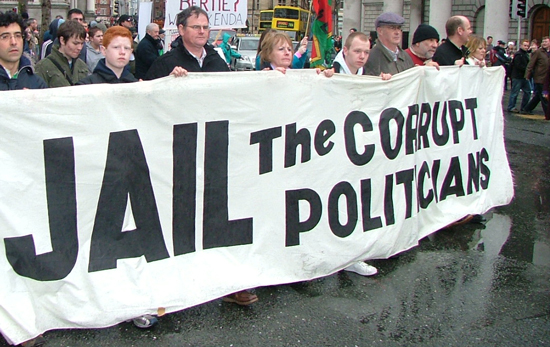
So what happens if there is no agreement in Washington by our politician employees by the tax cut deadline and our economy falls over the so called fiscal cliff? What does that mean to people like you or I who do internet stock trading for a living? How will our politician employees, who were hired to represent their employers to the best of their ability, make sure that our economy, their employer’s economy, does not slow down and stagnate?  Our politician employees, while frequently doing things that are completely ridiculous, are very consistent in at least one area; they operate under a system of crisis management.  Everyone in the country that is interested or at least paying attention has heard by now that Bush era tax cuts that have been in place and extended are about to expire.  This is no secret; regardless of if the average person on the street does not know what the fiscal cliff actually means or how it will impact them personally the politician employees that we hired to represent us certainly know.  They have also known for quite some time that there is a specific deadline and some sort of action must be taken to avoid the tax increases that most economists believe will slow down the already slow US economy to a crawl at best.

My questions are:  Why hasn’t this already been taken care of?  Why are the politician employees that we hired and pay to take care of such things for us procrastinating, posturing and wasting time when they have all been very clear on the fact that there is a drop dead date associated with the current tax cuts that we have all enjoyed?  Why is this even a relevant issue at this point when it should have been cleared up months ago?

The only answer that I can come up with is that for some reason our politician employees must believe that the drama and fighting and bickering that they have been doing over this issue somehow justifies their existence.  Each side must somehow believe that if they didn’t put up a very loud and obnoxious public fight their employers/bosses, who of course are us tax payers, would somehow realize that they aren’t doing their jobs very well and may possibly (hopefully) replace them all when the next opportunity to do so comes around.  Maybe this is all a diversion meant to create the illusion that they are worth the money and benefits that they receive from us during the time they are in our employ and of course for life.  I have never been able to figure out what any politician employee could possibly do in their career of representing us to garner a lifetime stipend with no reduction in pay or benefits.  Oh yeah I almost forgot, you just have to be in a position to vote your own lifetime salary and benefits into law riding on the backs of working people many of whom cannot afford to pay to keep their own homes or feed their own children while the politician employees relentlessly suck them financially dry.  They may even believe that a loud and very public debate will make them appear as though they are actually earning their salaries so they can continue to fall down in most other areas that are less publicly presented.

Maybe creating a loud and very public scene will get the attention that our politician employees clearly need and are looking for but I believe that most employers would prefer their employees go about their business and do the jobs that they were hired to do in a calm, quiet and professional manner.  If employees in the private sector acted the way our politician employees act they would be fired immediately and rightfully so.  I just hope that our politician employees are right in the respect that the loud and inefficient way that they conduct our business will continue to get allot of attention so that when the next opportunity for rehire comes up we will remember this and fire every one of them.  Hopefully we will be able to find replacements for each of them that will actually do the jobs that they are overpaid to do and move our country forward.  If that doesn’t happen, of course, they can be fired as well.  Maybe someday we will even find politician employees that will vote to end the lifetime stipend and benefits that we all have to pay.  Supporting your own family is tough enough but having to support former politician employee’s families is disgusting.

Technical Foundations of Trading Stock

Today we are going to discus the concept of evaluating a chart based off of technical fundamentals for trading stock.  What does that mean? Well there are certain things that need to be looked at on every chart in order to properly evaluate it for trading.  As you trade your preferred strategy you will need to first identify some common technicals about the chart.  These common things begin with looking at the trend, then following that by identifying the areas of support and resistance.  Once these things have been identified you can then apply your rules to trading.

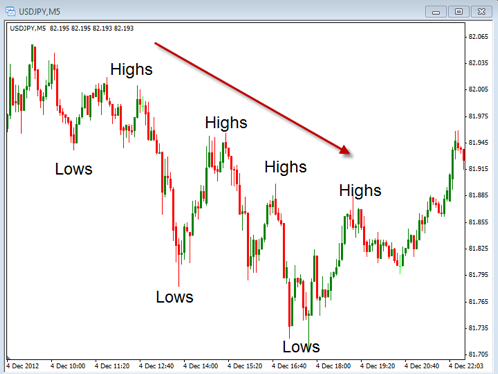
So, lets begin by looking at the charts below to see what we need to look for when identifying both the trend and support / resistance.  In this first chart you can see an example of how to identify the trend by using only price action on the chart.


Notice that the action of price on the chart forms consecutive areas of lower lows and lower highs.  This situation provides us with the information needed to consider this as a down trending pair.  The opposite would be true if the prices were making higher highs and higher lows.  In this situation the trend would be considered up.  Regardless of what else you use on a chart to help you identify the trend you will always use price action to help confirm your conclusion as to whether or not the trend is up or down.

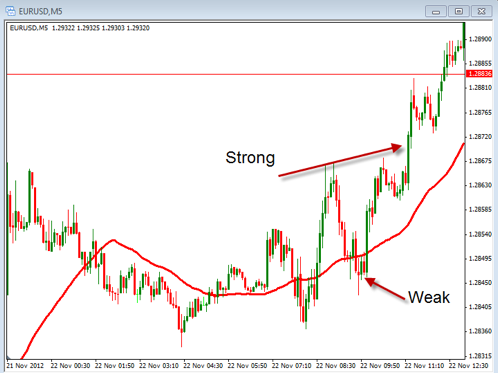
The next chart illustrates the trend by using a simple moving average with a period of 40.  Here you can see and easily identify the direction that things are moving.  An up trend would be in place if the simple moving average was going up and a down trend would be in place if the line is going down.  You can also use the location of the price to determine the strength of the trend.  If the line is going up and the price is above the line then the trend would be considered stronger than if the line was going up but the price was below the line. The reverse would be true for a down trend.  Take a look at the chart below to see both a strong up trend and a weak up trend.

The other part of evaluating the chart from a technical stand point is to look for the areas of support and resistance.  These can be discretionary in applying them but necessary as we look for places to enter our trades.  The main idea for identifying these are to look for places on the chart, either horizontally or diagonally, that act as a barrier to price movement.  If this barrier is stopping downward movement then it is acting as support.  If the barrier is stopping upward movement then it is acting as resistance.  In future articles we will discuss more about the topic of support and resistance.

As we learn to properly identify trends and support and resistance we can look to enter our trades at the best possible times.  In the end we want to be entering in the direction of the trend when the price is near these areas of resistance or support.  To go long we would want the trend up while price is sitting near support and is we are looking to go short we would want the trend down and sitting near resistance.  Take some time to review this and apply it into your trading and while you’re here, check out a quick video I did on yet another easy trading method:

Now, How To React To The Fiscal Cliff

Hi everybody,

Yesterday I went on a bit of a rant about the fiscal cliff, how we got there, and what’s going to happen next. Well… I wasn’t quite done! So I’m going to get back into it, but this time, I’m going to leave you with more than my analysis of the situation. I’m going to give you a clear way on how to survive this fiscal cliff business, and even profit from it. Now, let’s assume that the president, the House, and the Senate come together with this plan I just outlined in my previous post, and we are able to reduce the deficit by $300 billion.

(Side note: the annual deficit for the past four years has been running $1 trillion a year.)

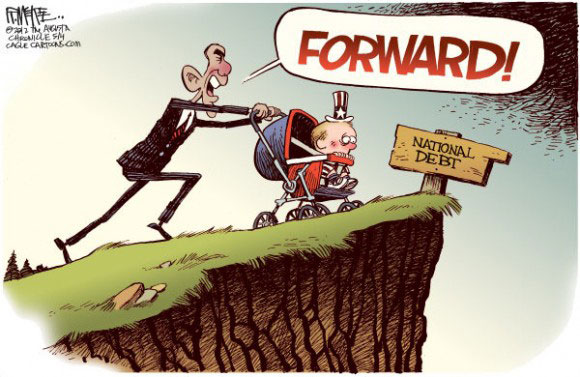
Where do you think the projection for 2013 is? It is $1 trillion. If they agree to this compromise, instead of the deficit in 2013 being $1 trillion, it will be $700 billion. Here is our current deficit, so that means it is going to go up in 2013 another $700 billion after all of our great politicians have declared victory. At the end of 2013, it is going to be $16.7 trillion.

If the republicans cave and the democrats get their way, the spending will not go down at all; it will actually go up. This deficit would then be even higher.

Either way, here is our year-end deficit for 2013. How about 2014? It will go up another trillion. Whatever they come up with here will only apply to this year with some vague projection for future years. They are good at making a vague projection and then they never make good on it. I would say it is a pretty good bet that the deficit is going to go up another trillion.

You have to ask yourself, “What does all this mean—a trillion dollars?” A lot of people cannot even relate to that and I do not blame them. It is certainly a bigger number than I am used to.

The GDP of the United States (the Gross Domestic Product, the sum total of all the economic activity in the United States) is in this same area; it is around $16 trillion or maybe a little higher. The annual deficit added to the current total debt is now approaching 100% of GDP.

In a couple of years, it is going to go like this: 110%, 120%, 130%. You know, Greece is at around 125%. We are not far behind Greece. The only difference I can tell between us and Greece is that we have a printing press and Greece does not. This is why we are able to forestall the day of reckoning.

People around the world are very, very, very nervous about the U.S. government’s situation and they are getting more nervous about the dollar by the day. This is why they are buying gold and silver. This is why there is so much turmoil in the financial markets day in and day out. The dollar’s days are numbered as far as its position as the reserve currency of the world.

The markets are going to go into great turmoil. You do not want to be sitting there wondering what is going on when that happens because it will be too late.

Let me make one other point. Some of you are familiar with the Laffer Curve. This is total taxes collected and this is tax rates. This is a 0% tax rate and this is a 100% tax rate. Obviously, if the tax rate was zero, you would not collect any money. As you increase the tax rate, the government collects more and more money.

When you go passed a certain point, the government actually collects less money even though the tax rate goes higher. You never hear about this from the politicians, but this is a well-documented fact in any economy, not just the United States. When rates go to a certain point, the revenues drop. Why? High tax rates kill business.

How does this happen? Business’ rate of return drop, so they invest in fewer projects or they pull their money out of the country all together. This means there are fewer jobs, less economic expansion, the economy suffers, and it is just a vicious cycle.

When the politicians talk about increasing the rates on the rich, you do not hear them talking about whether that will actually bring in more money. At this point, if we increase the rates to here, we are actually going to collect less money. You see, you will never hear about that until a year or two years later after all the hoopla is over with. This is why I call it a soap opera in Washington, why it is a sideshow. It is Washington insanity being played out day in and day out.

The media is very complicit in all of this. They just love it because they can get you all excited every day about the latest goings on, about what Obama said, about what Boehner said, and about what Reid said. It is all a sideshow. Even if they come to this agreement here, you can see from what I showed you that we are still left with an ever dramatically increasing deficit which will kill the dollar and ruin the economy. If the dollar goes down, the economy is going to be ruined and there is going to be a day of reckoning, I am sorry to say.

This sounds like a fantastic scenario. It will never happen in America. However, these numbers are fantastic and they have never happened before. We are in uncharted waters.

You have a choice to make. You can just sit here and hope things get better, the so-called “putting your head in the sand” and ignore everything or you can decide not to be a victim of these shenanigans and take action. You do not have to participate in this. You do not have to be entranced by the media and the politicians. You can take action and actually benefit from this insanity.

I think you do it, because markets become more and more volatile in this situation, there are more and more tradable short term trends than ever before. The markets are moving so fast. What used to take a year or two for a market to accomplish in going up or going down can now happen in a month. You have seen it.

In my view, it is time, if you have not already done so, to learn how to become a nimble trader of the markets by paying attention to risk first and foremost. You cannot just willy-nilly jump into the markets; you have to understand the dynamics, risk management, position sizing, and then how to wait for the very best opportunities.

If you have never traded, all of that sounds very complicated. I am here to tell you that it is not complicated, but you have to decide to peel away from watching the media for a half-hour or an hour a day. Quit doing that.

Ask yourself how it helps you to watch the news for an hour. It does not help you. Instead, use that time to learn how to trade. Start trading the stock market. Learn how to trade forex. Learn how to trade options.  I do not care how you do it, but go and do it. If you do not, these people that you think are going to help you are not your friend; they are not going to help. They are in a box and they have no way out. It is up to you to take action.

If you want to see my deliver my rant on camera, from start to finish, just watch my video below:


The Truth About The Fiscal Cliff

Anyone watching the little soap opera that’s going on in Washington? They’re calling it the fiscal cliff, and I’m having a hard time keeping quiet about it.

I don’t care where you are in life. Who your political affiliation is with… it does not matter. In my opinion you are being systematically screwed by your government. The fiscal cliff is a carefully orchestrated side show to keep you distracted from what is really going on.

I am going to show you in very simple terms why you are being screwed; why you are in jeopardy. You need to wake up if you have not already awakened to what is going on, so you can take appropriate action to safeguard yourself and your family.

This is not going to be exact, but it is going to be directionally correct.

The fiscal cliff, speaking in general terms, means that if the government does not take other action by January 1st , then the so-called Bush tax cuts (which are now over eight years old) will expire. This is going to increase the tax rate in 2013 and—if it does not stop the economy, slow it down and cause a recession—could bring in an additional $100 billion. In addition, there would be mandatory cuts in spending somewhere around $600 billion.

If that goes into effect, it will definitely throw the economy into recession, and yet, there are many people who think we’re already in a recession.  If that is the case, then it will just throw us into a deeper recession.  It is not a good thing.

Instead of that, you have the president who, in my opinion, is not leading; you have the House with their proposals; you have the Senate absolutely quiet, doing nothing; and the clock is ticking toward the so-called fiscal cliff.

Now, let’s suppose that the president gets what he wants. He wants to increase the marginal tax rate on “the rich.” “The rich” refers to anyone who makes over $250,000 a year which is mostly small-business owners who provide most of the employment in the country. This does not make sense to me.

Let’s say, though, “What do I know? Maybe he’s right. Let’s increase the taxes on the rich and collect the $100 billion.” Well, the president does not want to cut the $600 billion. He does not want to cut at all. In fact, his proposal right now asks for more spending, not less spending.

However, let’s say the republicans get what they want. They want to cut spending on 2013 because they know the size of government is out of control and getting worse by the day, but they do not want to cut it $600 billion. Let’s say they want to cut it $200 billion.

Let’s say they are both successful and we end up averting the fiscal cliff. We reduce the annual deficit for 2013 by $300 billion. Everyone will declare victory and all is well.

Well, all is not well. This is why you are being screwed. A lot of you already know that we have a $16 trillion national debt. Most of that debt is shorter term to midterm. Interest rates on that debt are about 1.5%. You know the fed is manipulating rates and keeping them low ostensibly to stimulate the economy. I think it is because the government cannot afford higher rates.

At 1.5%, they are paying $240 billion a year just in interest. Can you imagine what happens if those rates ever go to 5% which is more typical in the past 20 years? In interest alone, they are going to be paying $800 billion a year.

Did you know that the annual total tax collection from individuals this past year was about $1.1 trillion? Can you imagine if interest rates go to 5% and the interest paid by the government is $800 billion? That is going to practically consume the entire tax revenue from individuals.

This is just getting back to the normal level of interest rates.

I’m running out of time right now, so I’m going to have to stop here for a bit. But I’ll be back soon with the 2nd 1/2 of my “rant” and I promise that it won’t be just the doom and gloom… although there’s plenty of that to go around. I’ll actually touch on a few ways that this might all be a good thing … if you do the right things.

At the end of the day, that’s the point I’m trying to make. We’re in trouble here folks. Deep trouble. But it’s survivable if you start taking your financial future into your own hands.

Till then, take a look at my video below where I tell you the WHOLE story.


Stock Trading For Beginners? Try This Easy To Use Indicator…

Today, I would like to discuss the use of the Fibanacci Retracement technical indicator that many beginning stock traders use to trade stocks, futures ETF’s, etc.  The Fibonacci retracement pattern can be useful for swing traders to identify reversals on a stock chart. Looking at stocks for example, once they have moved up or down in a trend, have a great tendency to move back or retrace a certain amount, rather than to move in a completely straight line or direction up or down. Because of this common retracement pattern, stock traders use the Fibonacci Indicators as reference points to predict certain retracements levels as the stock moves back and forth in a trend during a retracement or “pullback”. You will find Fibonacci levels to be very accurate when analyzing chart pattern reversals. Fibonacci indicators also provide an excellent visual map and identify very accurate support and resistance levels. Some Stock trader’s will also combine Fibonacci Retracement levels  with common candlestick patterns to identify optimum entry and exit points.

An effective candlestick pattern trading method is to look for small double bottoms or double tops and individual doji or shooting star or hanging man type reversal candle patterns within these Fibonacci levels to identify trading opportunities.

Fibonacci levels are where price retracements or “congestion” often form. Just like moving averages, the Fibonacci levels work like price magnets to old highs or lows and can also form good support and resistance levels. For an even greater degree of accuracy they can be combined with the major candlestick patterns

The most common Fibonacci levels used in technical analysis for drawing Fibonacci lines are 62% (61.8% rounded up), 38%, 24% (23.6 rounded up) and 50%. For existing trends, the 24% level should be the minimum retracement but can go down as low as the 62% level. As price retraces, support and resistance occurs at a high rate near the Fibonacci levels. In an existing rising trend, the retracement lines move down or “retrace” from 100% to 0%. In an existing downtrend, the retracement lines move up or “retrace” from 0% to 100%

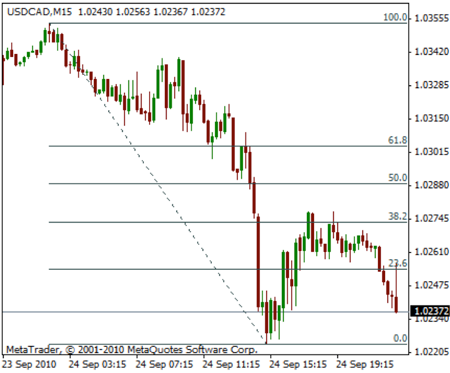
You can see in the USDCAD chart above that the retracement retraced to the 38.2% level before continuing the downward trend.

Technical Traders use these Fibonacci Indicators (Fib-lines or Fib-levels) to predict Price Targets and Support/Resistance Targets. To accurately draw the lines to identify these patterns you begin drawing from the lowest point (which equals your 0 percent line) to the highest point (which equals your 100% line). The 38%, 50%, and 62% lines will provide your reference point for targets.

While there is no “crystal ball” and nothing can predict the future with 100% accuracy, but using the Fib-levels can greatly enhance your ability to be in profitable trades. Adding the candlestick signals provide a great advantage for being able to immediately recognize what is going on with investor sentiment at these levels.

Traders Challenge:  Over the next few days, add Fibanacci levels to your stock charts and study the retracements, along with common candlestick price patterns to help identify support and resistance areas and potential entries.

Lazy Dollars & Flat Returns Kill Stock Market Trading Portfolios

I have been stock market trading for over 30 years; I opened my first stock market trading account on the next business day after I turned 18 years old.  I have made many observations about the market in general but one of them that to me is as important as any of them and may actually be one of the most important is the real impact of a flat market on our ability to increase our wealth over a long period of time.  The reason that this came up for me is because this past month is a perfect example of what a flat month can do to an investment portfolio.

The S&P 500 closed on October 31, 2012 at 1412.16, it closed one month later on November 30, 2012 at 1416.18.  Throughout the month the index created nearly a perfect V shape with a swing low occurring on 11/16.  If you had taken a long position at the beginning of November and held it for the entire month or if you took a short position at that same time and held for the entire month either way you were about even.  The only real way to have increased your wealth during this time was either to have sold at the beginning of the month and closed the short position in the middle of the month or to have bought in the middle of the month and rode the right half of the V back up.  Either way this would have been allot to ask for from the average investor though some may have achieved it.

Investors that are dollar cost averaging into some type of a longer term investment did not receive any benefit from the market in November either because the shares they purchased at the beginning of the month would be worth about the same at the end of the month and the new shares that they purchased at the beginning of December would still have about the same value.  If you were a long term buy and hold investor the impact of last month does not look that significant because it was a break even month but there is definitely a cost to a prolonged flat investing period.

The reason that a flat month like we had in November is devastating is because it robbed us of time.  Time is not a renewable resource, once it is spent it is impossible to regain.  Having a flat portfolio for a month does not sound that devastating but how many months does that actually happen and more importantly how many years does that happen.  Each month and each year we hope we get closer and closer to our financial goals, whatever they may be, but a flat return in our portfolio over an extended period of time not only robs us of wealth building time it may move the realization of the financial goals that we have out further and further into the future.

If you are investing for retirement, which may be a long term investment, and you will have to rely largely or solely on income from your investment dollars for survival during your retirement years if you have a flat time period during your saving and investing life it could actually move your retirement out at least a year and it could impact your standard of living during retirement.  Adding up all of the months and years of flat returns and negative returns and you will see that retirement may get pushed out further and further into the future.  This may not sound like that big of a thing right now but what happens when you review your portfolio a few years before you were hoping to retire and you realize that it will be impossible to meet your retirement goal on your projected retirement date?  How far out into the future are you willing to push your retirement and other financial goals due to a lack of solid investment returns and keeping lazy dollars on hand that are either non-performing or underperforming?

Do Emotions Play A Part In Trading Exchange Traded Funds?

I was working with some Exchange Traded Fund (ETF) traders today, and we had an interesting side conversation. We talked about how important of a role our emotions play when we trade. Not what we discussed is relevant for any kind of trading, stocks, ETFs, forex… you name it. No matter how you slice it, controlling your emotions will be crucial to your success. So, let’s discuss some of the problems that occur with our trading emotions.  Emotions are a natural part of us as humans so it is something that we all need to deal with.  Emotions are good but can cause us to act poorly when it comes to Forex trading.

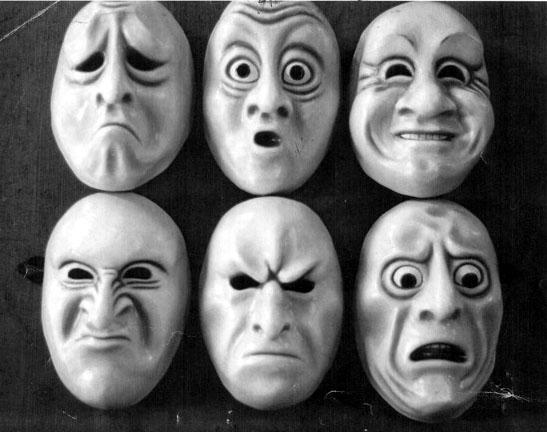
I don’t want to talk about specific types of emotions but rather the range of emotions that can occur when trading.  This range of motion is enhanced by the fact that we are dealing with our own hard earned money.  When we are dealing with the emotions of making or losing money this can push our emotions to the extreme levels.  These extreme levels can be the cause of poor decision making when trading.

The two extreme range that can happen with us as we are trading go from extreme happiness to extreme sadness.  These may not be the best way to describe it but hopefully you get the idea that our emotions can range from one extreme to the next.  This fluctuation in emotions can occur over a very short term or can take a long time to develop.

Let’s first describe what happens when the emotions go to the extreme on the happy side.  This might sound like a good thing but can become a negative issue.  As one experiences success or temporary profitable trades our emotions can move to the extreme of happiness causing us to think we are very good at trading.  This may be true but it also may be the result of a lucky or unplanned trade.  Sometimes when we are successful by chance we feel it is because we are trading well.  If our success is the result of trading well we will have long term success, not just temporary wins.  This false sense of happiness is because we got lucky it will cause us to make poor decisions going forward.  This is the type of trader that has a lucky trade, then goes around bragging about how much they made or how great a trader they are.  Sometimes even jumping up and down and singing a happy song.  If you see someone like this you know that it is likely that they are showing signs of the lucky trader.  If we begin to act like this we need to evaluate the reason why we are so happy to make sure it is because we are trading well and not just that we got lucky one time.

The second extreme is extreme sadness.  This is when we have taken loss after loss or when we have taken a loss that was more than we anticipated because we did not close the trade when we needed to.  By not following our rules we do things that make us unprofitable.  This profitability can lead to extreme unhappiness.  In addition, the poor trading leads to more poor trading and we loose confidence in our own abilities.  If we are sad in the end we will stop trading all together.

So, as our emotions go from extreme to extreme we experience a roller coaster ride of emotions.  These emotions usually  make us trade poorly.  But what may be even more damaging is simply swinging from one extreme to the other.  This can cause us to not enjoy our trading and ultimately, even if we are profitable, cause us to stop trading.

The solution to this roller coaster ride of emotions can be many but one thing that needs to be done regardless is to have our rules outlined and we need to follow the rules we are using.  If we can do this we will never be in a situation where we take huge winners and huge losers.  So if you’re trading ETFs, or anything else for that matter, we will be consistent in our trading and our emotions will stabilize so we can develop longer term success as a trader.  Have your plan and trade it!