Stock Market Trading Tips: Chart Analysis Basics.

Today, I want to give you some stock market trading tips. However, these tips will work with any kind of trading, Stocks, ETFs, or Forex. They work across the board because they’re all based on chart analysis which is ubiquitous no matter what you trade. Now, at the beginning of a new year I thought it would be appropriate to go back and take a look at some of the basic criteria we use when evaluating a chart.  Again, these basics can be applied to any chart, any time frame and can be use on stocks, options, futures, metals or forex.  So today we will look at some of these things using the chart of Silver.


Chart Type

The first thing we need to do when we evaluate a chart is to determine the  type of charts we are using.  Some might like the candlestick charts or line chart while others might like the bar chart.  It really does not matter which charts we use but what is important is that we are comfortable with the type we choose.  For our example we will use the candlestick chart.


Trends

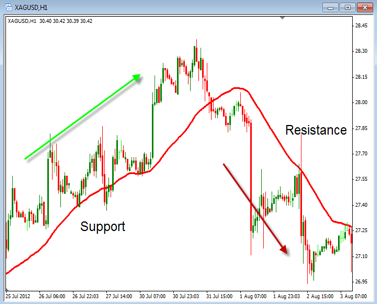
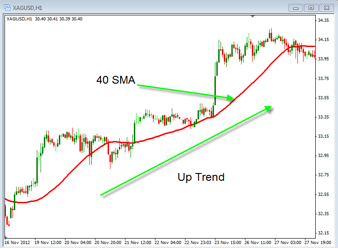
The next thing we need to do when evaluating a chart is to determine the trend.  The trend is something that every trader should know for the instrument that they are trading.  It doesn’t matter if you are trend trading or counter trend trading you need to know where the trend is headed.  You should have a simple way to identify the trend so you know if the momentum is moving up or down.  One way to do this is to use a simple moving average.  In the chart below you can see an example of how the Moving Average can show the direction that Silver is moving.  This chart is the 1 hour chart using the 40 period Simple Moving Average.  The trend is up when this line is going up and the trend is down when the line is going down.  Once you know this you can begin to identify when to entry based off of your rules for going long or short.


Support and Resistance

The next thing we need to evaluate is where the most recent levels of support or resistance are located on the chart.  The support is like the floor and the resistance is like the ceiling, areas where the price is likely to have a difficult time moving beyond.  When the trend is moving up we want to look to buy as the price is near support and when the price is trending down we want to sell as it nears resistance.  In the chart below you can see both areas of support and resistance and how to apply it to buying or selling.


The goal of evaluating charts is to find out areas to buy and sell.  Take some time to review how you determine the trend and support/resistance so when you look at a chart you can quickly analyze what is going on.  In the next couple of weeks we will spend some additional time looking further into each of these topics.

The Art of Trading/The Science of Trading

Whether traders really think much about it or not they must overcome the question, “Is trading an art or a science?”  Different traders will give you different answers with technical traders likely stating that it is a science and fundamental traders likely stating that it is more of an art.  I believe that if you do not look at trading as an art and a science at some point in your trading career you may hit a roadblock and you may even end up losing on some trades when you really should win.

I believe that traders that strictly view trading in one way may hurt themselves in the long run because not only is trading about how indicators line up and what the price action is doing relative to them it is also in part based on the experience and feel that the trader has for trading.  Trading is just like anything else; with experience you will know when it is likely that something will work out even though it may not look good on paper.  You will also know based on past experience which situations have worked for you and which have not regardless of what anyone or anything may say should or should not work.  The more you look at charts the more you will see because you will begin to recognize recurring situations.

Generally speaking trading is recognizing a move that is taking place in the market as early in its development as possible.  It may sound a little painful but studying charts will help you to recognize moves that are likely to take place so you can take advantage of them.  You will get a feel for the ebb and flow of the market or the specific issue that you are watching. 

I have always noticed that traders in general are habit forming in the respect that they seem to go back to the same issues that they have traded in the past looking to trade them again.  It seems as though once they have traded a security and have succeeded with it they get the feel for how it moves, they get to understand a little about the range it trades in and its tendencies and it seems as though it is a little easier to pull the trigger to trade an issue that they have traded in the past.  It seems as though traders almost believe that they have created a relationship with specific stocks or whatever security it is that they are trading.  This is definitely not a bad thing because if you believe that you are in tune with a security you may well be.

One my first lessons in trading stocks happened when I was in my late teens, I had a friend that was dating an older woman that was an experienced stockbroker so I mentioned to her a specific stock that I was interested in buying.  When she asked me why I wanted to buy it I couldn’t give her any other reason than because the way the price movement looked to me I believed that it looked like it would go up.  She told me that if you have a gut feeling about buying a stock that is strong enough for you to actually buy it more times than not you will probably be right; fortunately we were both right in that situation and the trade worked out well.  The point is that including your intuition into your trading can be just as important as any indicator or any trading tool that you will ever use.  I know there have been plenty of times when I have not traded a given issue because it didn’t feel right to me regardless of what the technical’s have told me to do and there have also been times when I jumped into the market when the technical’s were not very strong.  I’m not saying to constantly break your own trading rules but I am saying to pay attention to your gut and to the little voice in your head when it speaks to you.


Begin the year with a written set of Trading Resolutions!

The New Year is a great time to sit down and evaluate trading goals and objectives for the coming year.  It doesn’t matter whether we are trading Stocks, ETFs, or Forex, it is important to look at what has worked for us and maybe what hasn’t worked so well, and then incorporate those ideas into our trading plan for the 2013.

Even if we have a good trading plan, like anything important in life, we should set aside time periodically to evaluate that plan and refine it with our current and future goals in mind.  To evaluate our trading plan, we first must have a trading plan to evaluate, It is a little like reviewing your Will or whether you have enough Life insurance for your individual circumstances.  It is very difficult to evaluate something that is more concept than reality.  So if you don’t have a written trading plan, now is the time to get one now and make sure it is in writing.  I have heard it said: “A goal not written is only a wish.”  A Trading Plan not written down is only a dream, and dreams are good, but it is very difficult to execute a dream.

When thinking of a written trading plan for yourself, you should consider something akin to a personal trading Mission Statement. A Business would have a difficult time succeeding in the marketplace without clear goals and plans for the future including some details.  We as individual trader’s need to look at our trading activities more as a business or trading enterprise with clearly stated goals and resolutions and objectives. This written trading plan should be like a written trading constitution which defines our trading plan.

When we think of trading plans, sometimes we think our trading rules are our plan and therefore don’t need anything more comprehensive.  However, I am convinced and believe completely that we can have the best system available or the best trading rules, or the best indicators for our setups or our entries and exits, but without CONSISTANT application of that system or those rules we will have a difficult time being successful.   A system is NOT a trading plan it is only part of a trading plan.

We need to start to think of ourselves at a trading business not just a trader.  And a trading business would include an overall look at our trading goals and objective, our trading routine, our trading capital etc. Also, in our trading business we should be keeping appropriate records or a trade journal. In other words, I am speaking of what and why, not just the how.

And there is no time like the present to get going.  Sit down over a couple of “self-evaluation” sessions and ask yourself some tough questions about your trading and how you think you can become a better more consistent trader and be prepared to write down some honest answers to those questions.  When you identify areas where you can improve include them into your specific action plans as part of your 2013 Trading Plan and be prepared to review these periodically, say monthly or quarterly.

One last recommendation; share your plan with a trading friend or partner.  This will help to you become more accountable and give you more incentive to make the changes you would like to make and stick to those changes.  Just like other new year’s resolutions, if you involve others in your goals, you will find that you may have more support to improve your trading.

Trader’s Challenge:  Sit down and write out a personal trading plan including; a trading mission statement, your trading goals, and your trading routine. Then share it with a trading friend or mentor.


Here’s Some More Long Term Forex Charts

Yesterday I showed you two longer term forex charts for the Euro and the GBP. I want to continue with a few more charts so you can see first hand what kind of momentum we’ll be working with to start the year.


AUDUSD


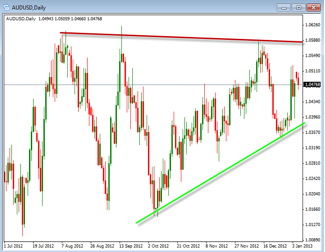
The AUDUSD is a bit more in consolidation and where we might look for some shorter term trades as the price moves between support and resistance.  This is also where we will be looking for a break out either above the resistance or below the support area.  On a break out we will look to trade in that direction as the new momentum is likely to continue moving the price for some time.

USDCAD


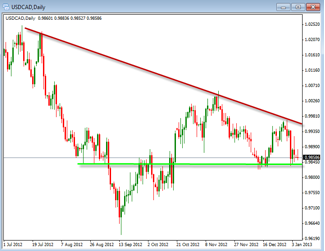
The USDCAD is really looking like it wants to break out as the converging of the support and resistance lines are becoming tighter and tighter.  On a break out of these two area look for a nice continuation move either higher or lower.  This type of pattern is nice to trade because it is simple to know when to look for entering into a position.

USDJPY


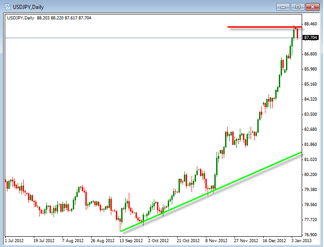
The USDJPY is a difficult one to trade right now as the momentum has been so strong to the upside.  After a big move like we have seen it is usual to see some type of pull back into the trend.  This will be one that we should look for a trade after the pair moves back down.  This may be several days or weeks before this happens so keep an eye out for this move.  Also, you may consider going to a shorter time frame in order to take advantage of this strong bullish momentum.

USDCHF

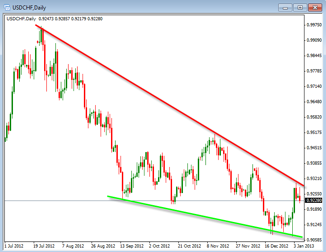
This pair is also forming a bit of a long term wedge as the support and resistance lines are converging on each other.  This tightening pattern is where we can also look for a breakout but is also good to look for a bounce down off of the resistance area where it is currently hitting.  Look to short this as it begins to move down from this point.  Should a break out occur, look to trade in the direction of the move.

In the end we want to be able to see the trends and support/resistance areas on the longer term charts in order to determine how and when we should be trading.  Take some time to do the same analysis on the weekly charts to see how they confirm the daily charts.  The goal is to find good places to enter the trade by using trends and support and resistance in our evaluation of the charts.

A Pair Of Long-Term Forex Trades: EUR/USD & GPB/USD

The year 2012 is now gone and 2013 is in full swing and with this we find it is a good time to take a look at the longer term trends on the daily charts of the various pairs.  Normally, I would not spend a lot of time looking at this time period but at the beginning of a new year I like to see where the “big” momentum is pushing the pairs I am trading.  So with that today I want to look at the 6 major currency pairs and where this momentum is heading.  This will not only give us a long term perspective of what might happen this upcoming year, but it can also give us insight into how we might approach the shorter term charts.


EURUSD

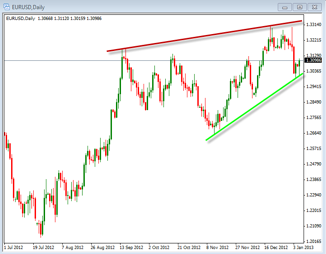
In the above chart of the EURUSD you can see that the overall movement has been to the upside while currently we are sitting near the area of support.  This situation is ideal for taking a long trade as the trend is helping the price move up and the buying pressure at support is favorable for the price moving higher.  In the next few weeks consider this as a bullish alignment for trading.

GBPUSD

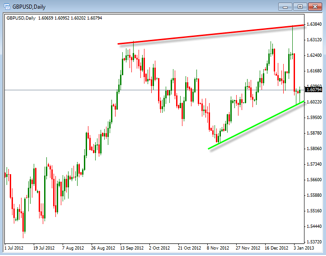
The GBPUSD has a very similar pattern to the EURUSD but just a little bit wider.  This will show as a bit more volatility so make sure you use appropriate stops and target to take these wider movements into consideration.  This is also in a bullish alignment so look for opportunities to go long on a bounce up off of support. I’ll have more long term trades for you soon, so stay tuned.

Fiscal Cliff? More Like “Washington Soap Opera”!

Hi everybody, I want to take a few minutes to talk to you today about the latest news on the fiscal cliff. Or as I like to call it: The latest in the Washington Soap Opera.

Ok, so a fiscal cliff deal was just approved in Washington and  I’ll discuss what that means to you as an investor, but before we do, I just want to revisit a few of the points I’ve made in the past that still hold true now more than ever.

First is the fact that your financial future is at risk, and that the post World War II era of investing, meaning principally buy and hold a diversified portfolio, is obsolete. So if you’re still in that mode with your IRA or 401k or your cash accounts, I believe that your financial future is at risk, that’s what I mean when I say that.

Now, why do I say that post World War II era of investing, buy and hold investing, is obsolete? It’s because — and here are the underlying causes of that — it’s because the developed countries, principally the United States, Europe and Japan, and others, are essentially broke, and they’re broke because they all have incurred massive debt that they can never pay back. It’s just a simple case of arithmetic, simple arithmetic. It’s a case of simple arithmetic.

Because of that, central banks are essentially printing money, led by the United States Federal Reserve, as well as to a certain extent, as well as to a lesser extent the ECB in Europe. They are printing money, and they’re doing that to prop up the massive debt of their respective governments.

This has the effect of debasing all of the currencies, not just the U.S. dollar, not just the Euro, but also the Japanese Yen. Also the Swiss Franc, also the British Pound.

It all falls under the heading of what I call the currencies are all on the race to oblivion. It’s just a matter of which one gets there first now.

So, when you consider the massive debts of the governments of the developed countries, the debasement of the currencies on a scale that has never occurred since World War II, it’s a complete game changer. So what would serve you well as an investor up until about the late 1990’s, it no longer does.

So we’re in an all new financial environment, and we will be for several years. You need three things for a flourishing economy. First, sound economic policy. Second, a strong currency. Third, a safe environment with minimal but effective regulation. Those are the three things that a government should provide, and as we’ve said before, none of those three are being provided by the leading governments in the world.

Great. So what do we do? Well, stay tuned, I’ll be back next week with some more tips for you to not only survive this “Washington Soap Opera” but I’ll give you ways to profit from it. Till then, ignore the hype in the media. Take control of your own financial destiny. Stop looking at long term buy and hold investing and learn to become a trader. Till next time… Good Trading.

Oil ETF & Natural Gas ETF Trading

Now I’ve been talking to you quite a bit lately about trading ETFs. About how they are much like mutual funds, but trade just like stocks, and how they can be a great way for a buy and hold investor to “dip his feet” into the world of trading. And with the economy the way it is right now, EVERYONE should be dipping their feet into trading, if not jumping in 100%!

Now there are literally thousands of ETFs out there. They can be based on anything. Indexes, collections of certain types and sizes of corporations. Tech. Banking… the list goes on and one. Today however, I’d like to just touch on the idea of adding a few energy based ETFs to your trading portfolio. With all of the turmoil with the fiscal cliff and the major breakdowns that Europe has been experiencing for years now, it’s safe to say the world economy is in the dumps. Things are obviously bad, and I believe they’re about to get worse. When times are bad, and there’s a lot of volitility, I like to start adding some asset based ETFs. Asset based meaning they’re based on a real asset. Assets like Pharmaceuticals, food, fertilizer,  gold, silver, platinum, paladium… and especially energy based ETFs. Oil and Natural Gas ETFs have been particularly interesting lately.

Natural Gas for example has peaked in 2008, and since then has been pretty, well, not very exciting.

Natural gas prices have fallen about 80% since then and the commodity remained under pressure as new supplies of the key fuel were continuously brought online, making the historic oversupply situation even more of an issue

Now, this situation seems to be turning around with the reversal of trends in gas prices, or at least a near term bottoming out. The remarkable run-up in prices is creating bullish sentiments for the commodity, suggesting that this market could begin to attract more attention in the future.
Same could be said for oil based ETF prices as well.
Long story short: Keep an eye on the oil and natural gas ETFs. If the prices continue to show improvement, you could do very well by adding them to your trading portfolio, especially as a way to offset some of the economic instability that we’re seeing at this very moment. I’ll go into more detail next week, but till then, do some research, I think you’ll like what you see.

Start The Year Right With ETF Securities

As the New Year is upon us, often we look for thing we can improve or change, I live by the age old adage; if it isn’t broken, don’t fix it. However, if you have a portfolio that is underperforming or just sitting in mutual funds not doing very well it may well be a time to make a change.  Taking more control of your portfolio by investing in ETF securities may be a great place to start.

While Exchange Traded Funds are not new (they have actually been around for about 20 years,) they’re certainly getting a lot of attention lately.  This is due to the ability for an individual investor to easily combine index investing with the convenience of the individual stock ownership, is a formula hard to resist. ETF’s are a collection of shares that follow a particular index, industry, or commodity, like a traditional mutual fund does, however, that is where the similarity ends.

There are several advantages ETF’s have over Mutual Funds for stock investors, because of the fundamental difference that ETF’s trade like individual exchange traded stocks.

The Differences vs. Mutual Funds:

  1. When a new investor buys shares in a mutual fund, he or she pays the end of day NAV (net asset value).  Since ETF’s are traded on the exchange,  they act just like any individual stock issue, and can be purchased any time at the current price during the market hours.


  1. When an investor purchases shares in ETS’s, unlike mutual funds, they may use pending limit orders, stop loss orders, and take profit limit orders just like stock trading.  Also with ETF’s, you may go long or short, just like stocks.


  1. With exchange traded funds an investor can also buy or sell any and number of shares that, she would like, even down to one share, if desired.    This is a real advantage for the investor with a small portfolio, as many mutual fund, have much higher minimum requirements.


  1. For investors with experience trading options, you can trade puts and calls on many ETF’s just like any other optionable stock.


  1. The management fees are generally smaller in the ETF world, as they just need to pick the basket of shares that follow their sector or specialty, and are much less likely to have highly paid fund managers (expensive stock picking gurus.)


These are the major differences between the two kinds of funds in a nutshell.   So, with ETF investing you can take more control of you investing decisions, take advantage of more active trading methods and stop paying the mutual fund managers to lose your money for you.