Price Patterns: Head & Shoulders

Today I want to discuss a commonly looked at and used price pattern called the head and shoulders pattern.  This price pattern falls into the category of a reversal pattern.  A reversal pattern is one in which the price action that has been occurring is likely to reverse the direction.  These reversal patterns typically occur after a larger move in one direction a happened.  Once these patterns have been formed you would look for a major change in the direction of the price. 

In order for the head and shoulder formation to occur you will see the price make a pattern that looks like a head with a shoulder on either side of the head.  In theory the price pattern should look something like this picture below.

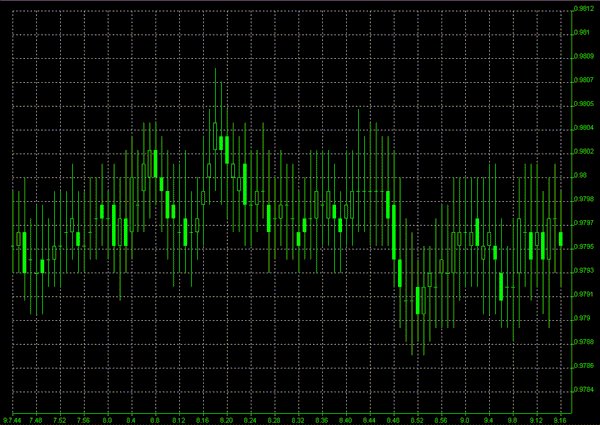
The first part of this pattern in created by making a swing high that creates the left shoulder followed by another higher swing high creating the head then ending with the lower swing high forming the right shoulder.  This is a textbook picture of the head and shoulders pattern but may not be what is seen normally in the real market.  Compare the picture above with the actual market below to compare what it might look like in reality.

So you can see that there is quite a bit of difference between the actual chart and the theoretical chart.  When you are looking for these you need to be able to pull the price pattern out of the chart.  Even though they may not look exactly like the drawn picture above, you will occasionally find some that look pretty close. Finally, in order to know when to enter a trade you would wait for the price break below what is called the “neckline”.  Notice that the picture below shows where this would be located. 

Once the neckline is broken you can set a target the is the distance between either the left shoulder and neckline or the head and neckline.  Remember, this is a price pattern that can give us an idea that a change may be coming.  But, we do not trade it until the neckline is broken to confirm the reversal is happening.  Take some time to review this pattern and see if it can help you better identify times when the market is likely to reverse.

The Next Self Made Crisis

We narrowly avoided falling over the so called fiscal cliff at the end of 2012 which would have increased everyone’s taxes.  The issue was coming at us like a freight train at the end of last year and of course our Congress with their crisis management approach to working for us only narrowly avoided the cancellation of the Bush era tax cuts.  In doing so it appeared as though many of the people that work for us in Congress were patting themselves on the back as though they thought that they had really done something special.  In reality they simply did the jobs that they were hired to do, barely, so they finally got to work and did something reasonably constructive.

Fast forward a few weeks into 2013 and we see the so called “new” Congress pretty much operating under the same crisis management style with the latest crisis which of course is the debt ceiling.  This is an issue that rears its ugly head now and again the last time being in 2011.  Back then we went through the fiscal gymnastics of reaching an agreement on raising our nation’s debt ceiling and naturally we have to do it again. 

This round of the fiscal debt ceiling feud has been talked about in the media over the past few months but not widely talked about because of the aforementioned fiscal cliff drama that Congress had created and here we go again.  The Senate has not passed a standard budget in four years but they are required to do so every year which leads to the logical question, “What are we paying them for?”  It is said that there is a plan that will be agreed upon to raise the debt ceiling for 3 months which will give the House and Senate the time it supposedly needs to agree upon a long term budget, if they fail to do so they will lose their pay.

If the part of the plan where “they may lose their pay” is actually agreed to I can hardly wait to see this one.  We may get to witness an even more disgruntled and dysfunctional congress that does allot of finger pointing and blaming each other while they are on the road to working for the amount that they typically deserve which is nothing.  My bet is that if this is a greed to we will see the most cooperative and fluid budget being passed as quickly as possible so they can continue to suck money off of the American taxpayer receiving their pay without interruption.  We would see the most sickeningly loving congress in history that results in the most amazing amount of bipartisanship and hand shaking that we have ever seen.

I’m a huge supporter of congressional term limits.  I wouldn’t even mind former congress people receiving a monthly stipend that is equal to their pay for six month or so after they have left office so they can acclimate themselves back into the work force.  I’m also up for continuing their medical benefits for the same six months.  This of course is versus today’s system where they have voted themselves the same salary upon retirement, for life, that they were receiving while they were in office while also continuing to receive better medical coverage than most of us could ever imagine, also for life, coverage that most of us couldn’t afford it were available to us. 

Maybe this will start a new trend where our politician employees will be paid based on performance.  If we did this it would at least make a small debt in our budget deficit because it is very likely that many of them would not get paid or at least not get paid that much.  The savings that we would receive very likely would show us how little return we are getting for the current dollars that we are spending for their lack of services

Stock Trading Training: Flag Patterns

Today I would like to give you a bit of stock trading training and discuss looking for clues to find good entries when trading with the trend.  A trend in the markets can be a very fickle; they go on runs then fizzle, start and stop, continue and reverse.  Once a trend forms is won’t go straight up or down but will have areas of retracement or pull back. The very nature of the market forces of supply and demand assures that there are natural levels of profit taking in most market moves.   One of the most important elements of successful trading is identifying these “resting” points and if they are just “resting places” or are they are actually a market reversal or a “change in direction.” This is where analysis of price action comes in.  We can use certain price patterns based on this price action to help determine if these pull backs are possible setups for an entry.

One type of price pattern we can use is a continuation pattern such as a Bull Flag or Bull Pennant for an uptrend continuation or Bear Flags and Bear Pennant for a downtrend continuation.  These patterns help us to identify areas of continuation, looking at a pull back or a consolidation and resumption of current trend after the pull back. Here are some examples of what these continuation patterns look like:

Flags and pennants can be generally categorized as continuation patterns. These price patterns usually show brief pauses in a strong trend.  They are usually seen right after a larger quick move. The market will often pick up again in the same direction. Over time these continuation price patterns are very good at identifying potential entry points.

Bull flags are characterized by lower tops and lower bottoms, with the pattern slanting against the trend. But unlike wedges of a Bull Pennant, their support and resistance lines run parallel.

Bear flags are comprised of higher tops and higher bottoms. “Bear” flags generally slope against a strong down sloping trend.

Pennants are similar to flags but are not parallel and look very much like symmetrical triangles. Pennants are also generally smaller in size or volatility and duration than Flag patterns.

Here is a recent example of a classic bull pennant and a bull flag in an Uptrend market for symbol PCL:

Note in the graph above that after a move up, the Bull Pennant is formed by the lower highs and lower lows in a triangle pattern and once it broke above the pennant it resumed the bullish uptrend and then a Bull Flag formed by more parallel lower highs and lower lows running against the uptrend, and once the pullback is “broken” the price breaks out and continues the previous up trend for a very positive gain.  The best way to take advantage of this pattern is to set a “buy stop” entry order close to the top of the pullback so that if the trend resumes to that level you would be triggered into the trade to take advantage of the continuation.  The same patterns apply to a bearish trend but in the reverse pattern and with a “sell stop” entry order.

Trader’s Challenge:   Look for these Flags and Pennant price patterns as a great way to identify entry points after they break out of the pullback.


Stock Trading Systems And Why They Often Use Stochastics

Hi everybody, Bill Poulos here about an indicator that many stock trading systems use, including many of my trading systems. Many trading systems often use many different indicators, but the one I’m talking about today is: Stochastics. Now in the financial world, Stochastics represent the seemingly random behavior of assets such as stock, ETF, or forex prices. Which is just a fancy phrase for it measures volatility. And when I say volatility, I don’t mean the bad type that we talked about last time. No matter what your stochastic information is telling you, if you see wild bars appearing and the market is moving in a helter skelter fashion: Stay out! Just wait for it to start trending in a more predictable fashion.

No, what stochastic indicators measure is the every day volatility that stocks, ETFs or forex go though on a regular basis. And it can help us determine if a certain security is moving in a tradable fashion. And what I like to use it for is as a marker for change. Take a look at this chart here:

What those circles represent is where a certain security was overbought or oversold, which let’s us know if we’re in an up or down market. In an upward-trending market, prices tend to close near their high, and during a downward-trending market, prices tend to close near their low.

So at the end of the day, at the very least, you can use the stochastic indicator to help you determine the direction of the market. And that’s what I want you to take away from all of this. Because knowing the direction of the market can make or break a trade.

That’s also why many trading systems use this indicator in their methods… it does a great job at what it was inteded to do. So go ahead, take a look at the stochastics next time you trade and see if it can help you get a better grasp on where the market is going.


Martin Luther King Day – A Lesson In Holiday Trading

Since today is a holiday in the US I thought I would discuss a little about holiday trading.  Although most forex brokers are still open on this day the stock market and banks will be closed.  Even though forext traders can still trade we need to remember that the banks and financial institutions create the majority of the forex volume.  Because of this, when banks are closed, the forex market is much less liquid than normal.  Also, individual traders become more of a force and can influence the market a bit more.  When this situation occurs we can see two things happen.  First, the market can become even more volatile than it may normally be or second, it can become very flat in the moves.  In either situation the markets become less deliberate than what we would like to see happen when we are trading.

If we are trading in a non-deliberate market we can be entering into trades that have a lower probability of success.  If we can focus our trading on higher probability and more deliberate markets we are going to find that our success levels increase.  So, if the market is less deliberate and therefore less reliable what can we do when the banks are closed and trading volume is less?  Well, let’s talk about some of the things we can do on holidays such as Martin Luther King Day. 

  1. Stop trading:  This might sound a bit drastic but it is an option for us when the markets are less deliberate.  When we stop trading we can observe the market to see what is happening so we can better understand the reasons why we might not want to trade on a holiday.
  2. Trade demo:  We can take our live trading and move it to a demo account.  This will allow us to continue to trade but without the risk of our live accounts.  We can continue to practice while we allow the markets to settle back into more normal trading.
  3. Analyze: We can take the time we would normally be trading and begin to analyze our trade, our strategy and our mental trading state.  It is good to do these things on a regular basis and during the market holiday is a great time to do this.
  4. Back test:  This is a prime time to test out strategies that you might be interested in trying out. Take this time to create your rules and go back in time to test out how they have worked in the past chart history.
  5. Read:  This is a great time to catch up on reading about the forex market.  Keeping fresh in our minds the things that are most important such as trading psychology and risk management.  Pull out that trading book you have been wanting to read and get to it.

Now these are not the only things you can do but are some suggestion of things to do when the markets are in holiday mode.  It is always better to exercise caution when trading and to try and trade when our probability of success is the greatest.  Avoiding holiday trading is one way to put the market in our favor when trying to trade successfully.

Get Your Charts Straight! (Chart Types 101)

Last week we introduced some of the basic concepts that are needed in order to properly analyze a chart.  Today we are going to look a bit further into the first topic which is that of chart types.  Chart types are important as they are what you are going to be looking at in order to determine if you are going to buy or sell.  Being comfortable with the type of chart can also make it more enjoyable to look at and trade.  There are several types of charts to choose from including bar charts, candlestick charts and line charts to name a few.  As a side to the chart types you will also want to determine the chart time frames that you will be trading.  Take a look at the chart types below to see what each one looks like.


A bar chart is one of the most commonly used types of charts.  Notice how it is formed with the open price as indicated by the left side hash mark while the close is the right side hash mark.  It is also a way to show the high and the low with the top and bottom of the vertical line.  With this chart type we can see where the price is moving and the momentum associated with each bar.


Another type of chart that can be used is the line chart.  This type of chart is limited in what it shows us  because it is only based on the closing price of the time period.  These charts can give us a good idea of the momentum in that it is bullish when the line is going up and the momentum is bearish when the line is going down.


The candlestick chart is another one of the most commonly used charts.  These are popular in part due to the fact that they are visually easy to see what the price movements have been.  Similar to the bar charts but easier to see what is happening with the price movement.

Regardless of the chart type you choose you can get valuable information about the price action by looking at the charts.  You need to become confident at looking at the charts and one of the first things to do is to pick which type of chart you will be using.  Once this is done you can move to the next layer of evaluation which is to identify trends and support or resistance.  Take some time to review what you are doing and make sure you can read your charts properly.

Short Term Stock Trading Discipline

I believe that one of the most common reasons for traders to fail in short term stock trading, or any trading for that matter is due to lack of discipline.  I also believe that many traders may not recognize that they are deficient in their discipline which in a way is self fulfilling, sort of a Catch 22.  We all know that “you don’t know what you don’t know” so if you don’t know I’m telling you right now, explore the possibility that one of the reasons that you may not be the type of trader that you want to be or think that you should be may be due to a lack of discipline.

Most people see themselves differently than how others see them so you may even want to present this question to the people around you that are the closest to you be because if there is a discipline deficiency in one area of your life it most likely will show up in other areas as well.  I would not suggest to ask an open ended question like “What is wrong with me?” because that can potentially lead to an answer that you do not want to hear and it could create huge problems and very long conversations but asking trusted and close people specifically about your discipline hopefully will not be a problem.

My experience from communicating with literally thousands of traders is that in general they are very smart people; they learn trading concepts and techniques quickly in most cases and many are very creative in their thought process coming up with new and innovative trading ideas.  Most traders that I communicate with are not full time traders; they actually have real full time jobs.  Those jobs range from manual laborers to engineers to doctors to entertainers and whole list of occupations.  The point being that if they are intelligent enough to function in their chosen profession they are very likely intelligent people, the question that I ask is if that is the case why do so many of them fail when it comes to trading.

Some very common things that I have observed about traders when it comes to trading is that in general they are emotional, untrusting, they lack confidence, some lack knowledge and many seem to always think that they may have a better way to trade today or right now which leads them to constantly change the way that they trade.  All of these things lead us to be undisciplined; they lead us to break our trading rules jumping into the market when our own rules may have told us to stay out and getting out of the market when our own rules told us to stay in.  It’s almost like we think that if success doesn’t happen quickly and in the specific way that we want it to happen we will force the market to bend to our will and what we want it to do, nothing could be further from the truth.   

If we could give up the notion that there are good trades and bad trades and see them all merely as trades it would free us up to trade with allot less stress and in a much more confident way.  Trading is a business nothing more or less, just like any business that we run there are constant business decisions that must be made.  Some of the business decisions that we make will be good for our business and some of them will be bad for our business but if a business owner can make good business decisions most of the time, may be 70% or 80% of the time, the higher the better, it is very likely that the business will succeed.  Trading is no different, if we look at our trading business as a business and realize that each trade that we decide to participate in or not participate in is just a business decision and nothing more we will be able to trade in a more unemotional way with much less attachment to the trades that we make.

Each trade is just a trade, no trade should be so dramatically important that it greatly impacts our ability to function or to trade going forward so we need to trust our trading method enough to blindly and consistently follow our rules, we need to trust our trading knowledge trusting that we are intelligent and we do actually know what we are doing and we need to remove the emotions or the judgment from trading.  Trading should be fun not stressful.  If we put ourselves in the best position possible to profit from the trades that we make there really isn’t much more that we can do.  We cannot control which way the market goes or what other traders do in fact all we can control is what we do and how we conduct ourselves.  If we conduct our trading business in a thoughtful intelligent and honest way leaving the emotions to our personal lives as much as possible and get ourselves out of our way we will have allot greater chance for success.  Being a full time trader would be a great position to be in because you could have unlimited wealth, unlimited cash flow and unlimited freedom in your life.  I believe that the only thing that is keeping most of us from experiencing this is us, when we learn to get “us” out of our way and when we learn to trust ourselves in our trading, success will quickly follow.

Three Rules to Trade by in 2013

Whether you are trading Stocks, ETF’s, or Forex, here are 3 simple but very important rules that you should make part of your 2013 trading plan!

While it is still early in the New Year it is important to set out clear objectives and goals for your trading plans.  Last week we spoke about the importance of committing your trading plan to writing.  Let’s discuss the 3 things that should be part of every successful traders plan.

First, when entering a new trade, ALWAYS use an initial stop loss order.  A good system should identify an appropriate level to set your initial stop loss just in case your trade goes against you.  While you may have a great system, no system is perfect and you need to plan the exit if your trade goes in the wrong direction.  I generally like to use an initial stop loss order that is based at least in part on a relevant price action.  Another good rule of thumb, is to use a 2 ATR (AVERAGE TRUE RANGE) as an initial stop.  Also, once you have identified a good initial stop loss level the other part to the rule is leave that stop loss order alone until the trade moves in you favor.  Don’t get in the habit of “widening” your stop loss to leave a losing trade in longer and potentially lose even more.  Give your trade enough room in the first place so you won’t get stopped out to quickly. Once the trade moves in  your favor, you can move the stop to break-even and start trailing the stop to start protecting your profit as it continues to move in a profitable direction.

Second, make sure that whatever trading system or method you are trading has good clear entry signals and then make sure you follow them.  One of the easy mistakes for traders to make, especially new traders, due to uncertainty or lack of confidence in a trade, is to hesitate to enter a trade at an entry signal. Then, once the trade starts to move in a favorable direction, to be tempted to enter the trade too late after much of the move has taken place.  Often, this is referred to as “chasing” a trade by entering after the best entry.  If you miss at trade simply wait for the next good one, don’t enter a trade late just to find yourself in a potentially losing position. So the key here is, if you miss an entry, let it go!

Third, control your risk by never allowing yourself to trade with more than 2% risk per trade.  It is important to justify you risk in real dollars for each trade, before you enter a trade. One way to do this is to make sure you calculate the dollar amount of risk that is appropriate for each trade.  For example, if you have a 10k account, you calculate that 2% of 10k is $200.  If the difference between your entry price and stop loss price is $2 than your appropriate position size would be 100 shares.  So, trading the correct position size based on your account size is the key to controlling risk.

If you follow these three trading rules, using initial and trailing stops, not “chasing” or forcing trades, and keeping your risk at 1-2% max risk per trade, you allow for a better chance of success in the long run.

Some Quick Stock & ETF Trading Q&As

Hi Everybody, Bill Poulos here and I wanted to talk to you about some interesting questions I received the other day. I often do special one on one coaching sessions with my students, or we have webinars where we field questions too. It’s all part of our commitment to making sure our students truly succeed. And I’ve found it’s also a great place to see what traders need help with.

The first question I want to go over is about shorting stocks. Can we short stocks? Should we short stocks? Is it smart to short stocks? These are all common questions. And for those of you who are just getting into trading, “shorting” a stock means to see a stock, as opposed to buying one. Short selling is the sale of a security that isn’t owned by the seller, but that is promised to be delivered as in they “borrow” it from their broker and then sell it at hopefully a profit. Now it sounds a little complicated, but once you short sell a few times, it really isn’t. 

My answer is, first off be careful. Shorting stocks is not something a beginner should get into, and in some cases, such as an IRA you can’t short securities. BUT, once you know the rules, and the market cooperates, then you can do very well shorting stocks. Again though, be careful: GOing short requries even more vigilance than going long as the markets can become very volatile very fast. Someone also asked when you have an opportunity to go long on a security, or short on another, what would you do? My answer is always go long if you can. It’s easier. Less complicated and often carries less risk.

The second question I wanted to over with you today is what to do in volatile and flat markets. I have many students ask me what to do when the market is moving sideways and not trending very well. They get antsy and they want to trade. Unfortunately, my answer is STAY OUT. Yes trading is fun and trading is exciting, but you need to stay disciplined. These flat markets are nothing but trouble. You might enter the market and just watch your trade sit there, doing nothing, or even losing. Just step aside and wait for the markets to move again. There’s no reason to trade these markets when there are so many others that cold be trending nicely. Wait. Be patient. And wait for a nice smooth deliberate trading market to appear before you jump back in.

Then I often get the opposite question: “What do I do if the markets are volatile ” Or “What do I do before a new event?” My answer is the same as trading flat markets: STAY OUT. There is no reason to trade these markets! They’re too risky. If your charts are looking like a mess with extra long bars and huge wicks, it’s too volatile. And I always give the same reason: there are so many markets and trading opportunities out there that it’s just plain irresponsible to trade less than desirable markets. Don’t do it. Stay in cash and wait for the market to come to you. Don’t force the market because you can’t, and if you try, you’ll nine times out of ten end up losing.

I’ll be sitting in on a few more coaching sessions next week so I’ll be back with more questions and answers, but until then, good trading!


ETF Database: How To Use Stop Losses

This is a concept that should be in any trader’s ETF Database: Professional traders use stop losses!  Why?  Well, because they know that protecting their money is the most important thing they need to do.  Today I want to spend a few minutes discussing some of the more important concepts in regards to Stop Losses.

Now that we know a stop loss is used to help protect our money and something that professional traders use, we need to define exactly what a stop loss is.  A stop loss is a tool that is use to limit the amount you are willing to loose with any trade you enter.  The stop loss is set at a point where you would not anticipate the price moving to, based off of your current entry signal.  If the price moves to this area you would want to exit the trade with the stop loss and incur your pre-determined loss amount.  Even though we do not like to take losses, it is important that you take them to protect the rest of your account.  Holding on to a loosing position can become very costly. 

There are several things to look for when trying to decide where to place a stop loss.  Take a look at these things to see if they can help you better identify where to place your stop loss.

1. Look at the Support or Resistance areas.  The stop loss should be place below the support level for a buy and above the resistance level for a sell.

In the chart above you can see that the trend is moving up and the stop would be placed just below the area of support.  This is critical because if you place the stop above support you have the possibility of getting stopped out before the support can be tested.

2. Look at trend lines.  Trend lines, like support and resistance, can give a good visual as to where to place the stop losses in both an up trend and down tend.

Here you can see that the tend line is moving down and the stop loss can be place just above this line.  This would be at an area where you would not anticipate the price going if you shorted the pair.

3. Moving Averages.  You can use a Moving Average to help you know where to place your stops in both an up and down trend.


Notice how the trend line and the 40 period Simple Moving Average are very similar in where you would place the stop loss.

Regardless of how you determine where to place a stop loss the most important thing is to actually have one.  Too many traders, both new and old, do not use a stop loss which can cause them to be placed in a large amount of risk.  This risk can cause the account to take huge losses if the stop in not used.  The goal is to keep our risk at appropriate levels and using a stop loss can help you be consistent with that.