Even The Best Gold ETF Traders Can Become “Myopic”

Today we are going to talk a bit about the idea of “Myopic” trading and what it means to Gold traders, or any trader for that matter.  You may ask yourself, “What is Myopic trading”?  Well, let’s first start by defining what the word myopic means.

MYPOIC = nearsighted, shortsighted, unwilling to act prudently, narrow-minded, lack of understanding.

This should give you an idea of what this word means.  We could probably add other terms to define this but I think these define it well enough for what we need.  As we add this word to “Trading” hopefully we can see some problems that might arise.  As traders, if we become “Myopic” in our trading or in other word shortsighted, we can run into many different problems.

It does not matter if you are trading Stocks, Options, Currencies or Forex, Futures or Gold and Silver this can be a problem for any trader.  As a trader looses sight of the “big” picture they can become near or shortsighted in their decision making process.  As we become so focused on one aspect of our trading we can miss seeing what is really happening.

For Example, some traders will want to be in a trade so bad that they will avoid seeing the obvious things that would keep them out of a trade and only see what they want to see to get the into the trade.  They may look only at a specific indicator, like the stochastic indicator, and see that it is moving up so they buy.  They won’t look at or the avoid looking at all the other things that might tell them to stay out.  So even though the trend is down and they are sitting at resistance and there is news coming out and it has just been downgraded they will still buy it because of one thing they see.

The other issue with being myopic in our trading is that we end up holding onto trades that we should be closing out.  Again, even if everything is telling us that we should close the trade we will find the one thing that tells us to stay in it.  This occurs often times when we enter a trade long and it move down and we are loosing money.  We don’t want to loose the money so we hunt and find the one small thing that says we should stay in it, even if we have 10 major things that tell us to get out.

This is where having your rules clearly outlined and defined can help you.  Understanding and knowing all your rules for entry can keep you from becoming a myopic trader.  Take time to review what you are currently doing to see if you have developed the bad habit of trading myopically.  If you have, go back and review your process for deciding when to take a trade and for getting out of a trade.  Make sure you are aware of the possibility of myopic trading and if you find yourself avoiding the obvious things, stop and reassess your decisions.  Looking at the big picture will help you to make the right decisions in your trades.

Learning Stock Trading? See How The Fiscal Cliff Affects You

Let me ask a question. Are you a stock trader who’s concerned about the fiscal cliff and the goings on in Washington now to address it? The way I look at it, the fiscal cliff is nothing more than a political and media drama foisted upon you day to day to keep you stressed out and distracted from what really is important to you, and that should be your own personal financial being. If you know how to take control and trade the markets, then you go from being a victim day to day listening to all this drama coming from the media and the politicians, to someone who is taking control and actually taking advantage of the drama that everyone else seems to be transfixed with.

Now in my view, the fiscal cliff is just a sideshow to keep you distracted from what’s really going on. The fiscal cliff is simply a law that Congress passed and the President signed several months back that said if the government doesn’t do something different to address the budget deficit by January 1st, certain budget cuts will automatically go into effect to the tune of about $600 Billion, and the so-called Bush tax cuts will expire. So taxes will go up on everybody.

So right now the two political parties are battling each other over this sideshow. The Republicans refuse to increase tax rates because their view is even if you increase them, the most you are going to collect is 50 to 60 billion dollars a year which is nothing compared to the one trillion dollar annual budget.

On the other hand, the Republicans want Draconian spending cuts to reduce the annual budget deficit of a trillion dollars. That’s not a good approach either because that will cause a recession. So what they really need to do is get on a glide path that reduces the deficit over several years to a point where they can get to a balanced budget without sending the economy into a deep recession.

But they will probably never be able to do that because they are so transfixed by these sideshows like the fiscal cliff. So regardless of what happens with the fiscal cliff, when the day is done the country is still going to be sitting there with this 16-plus trillion dollar deficit that can never be paid back. It will increase every year for the next several years as far as the eye can see. It will only make the matter worse.

So don’t get caught on being a cheerleader for one side or the other because neither side currently has the answer nor the desire to do anything constructive about the problem.

I’ll be picking this up next time when I go over the whole “Tax the rich” concept and what I think of that. Till then, just know if you’re a stock or ETF trader, know that if you’re trading the market with a sound trading system, you’re going to still end up on top no matter what the media hypes up this week, or a year for now.


How Stochastics Can Support Any Stock Trading Strategy

What are Stochastics and how can they be used with other stock trading strategies?

The Stochastic indicator is a great technical analysis tool, but what exactly are they and how can you use them in your trading?

The Stochastics indicator is a popular indicator in the “Oscillator” family of technical indicators. Back in the 1950’s Dr. George Lane created the Stochastics oscillator. The Stochastics indicator is said to be “leading” since it can generate signals before they appear in pricing behavior which indicates a potential change in direction of the trend or what we refer to as divergence. Traders also use the indicator to determine overbought and oversold conditions by identifying the tops and bottoms of price cycles in the markets, especially on short term charts.  Stochastics are used by traders of all markets including, Stocks, Futures, Forex, and Options.

The stochastic indicator shows the location of the closing price relative to the recent high-low range. While the stochastic indicator is helpful in identifying overbought and oversold levels, the primary use for which George Lane created this indicator was for spotting bullish and bearish divergences. Using Stochastics I will show you that momentum often shifts before price does, and spotting these instances can be a great method for entering your stock or Forex trades.

Using the stochastic indicator to recognize bullish and bearish divergences is my favorite use of the stochastic indicator. This is something I use frequently in my trading. The premise is that when a new high or low in a security occurs but is not confirmed by the stochastic indicator, it indicates a potential trend reversal. For example, bullish divergence occurs when price makes a LOWER low, but the stochastic indicator makes a HIGHER low. This shows that the downside momentum is slowing, even though prices are continuing to make new lows, and a trend reversal may be imminent.

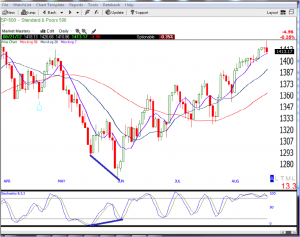
Note the bullish divergence in the chart below as the price action had continued lower at the same time the Stochastic indicator has started to move higher indicating a potential change in the price movement or trend before the price action shows any real sign of a reversal.  Notice the change in trend direction immediately after the bullish divergence is indicated.

Corporate Earnings As Stock Trading Tips?

Did you know that we can use corporate earnings information as more or less a stock trading tip? Longer term investors are typically very concerned about what effect corporate earnings will have on currently open positions that they may have in a company that is about to announce earnings.  Short term traders have similar concerns regarding short term trades they may be considering.  If you are making a short term trade in a company that is just about to announce their earnings it may be a good idea to pass on that particular opportunity until the earnings announcement has been made.  The reason for this of course is that analysts make their predictions about what corporate earnings will be for publicly traded companies so when those predictions are announced the market will immediately bake that information into the pricing of the company’s stock.  When the earnings announcement takes place if the actual earnings that are reported by the company are significantly different from the predictions that the analysts made the market will immediately bake the new information in the price sometimes making the price of the stock move quickly and erratically.

In reality this is not a bad thing it is just the market correcting the price based on the new information but when you are a shareholder, especially if you are short term trader and the price drops quickly, it can have a devastating effect.  Of course longer term investors are impacted by this to a much lesser degree because of the timeframe of their holding period but regardless of this both longer term and shorter term holders of the stock will be affected.  It can go the other way too where there is a good surprise and the stock value increases but it seems that typically the surprise will be to the down side.

The most obvious way to combat this situation is to make sure that you do not trade a stock when an earnings announcement is imminent.  To find out the earnings announcement schedule you can go to something like Yahoo Finance to get all of the information that you need.  The link to see the earnings reports that are scheduled to be released is as follows:

http://biz.yahoo.com/research/earncal/today.html

Just type in the information for the company you are interested in and everything you need to know will be presented.

A very commonly asked question around corporate earning and trading is how much emphasis should one place on earnings when making our trading decisions.  I would not let earnings announcements handicap your trading but I do believe that they are something to pay close attention to.  Longer term holders of stocks may be interested in corporate earnings if they are holding the stocks for their dividends but shorter term traders may want to avoid this situation altogether.  Often times when dividends are paid the stock price adjusts by approximately the same amount as the dividend so in many cases there is no clear reason to intentionally trade a stock when an earnings announcement is close.

I believe that if you are watching a stock and a good setup occurs that meets all of your trading criterion you should check that specific company’s earnings schedule before making the trade.  If the announcement is off into the future by a few weeks or at least out as far as your estimated trade horizon is make the trade.  The main time that an earnings report hurts is when it is under the analysts expectations but regardless of if they meet expectations or not it can still work out to be a good trade.  Allot of companies are very profitable but if their earnings fall short even by a little from what the market expectations are the stock price could get hurt in the short term however if it is a good and profitable company this should be of little consequence for longer term investors.

Stock Trading With the 40 Period Simple Moving Average

As you may know and as we have talked about in past articles the simple moving average is an indicator that is commonly used by many people who do stock trading for a living.  The one problem that many traders run into while using this indicator is that there are many different ways to use it and many different parameters that can be applied to it.  Not knowing which parameter to use can cause traders to try many different ones and often change between one period and another while trying to decide on placing a trade.  If we try hard enough we are likely to find a moving average period that will tell us what we want to see.  What I mean by this is that if we are using a 100 period simple moving average to look for entries but are not seeing any, we could simply just change to period to a 10 and find the entry we are looking for.  So the point is that we need to be careful about custom fitting the indicator to make our entries work.  What we need to do is find an indicator time period that works and then stick with it.  Waiting for the signal to arise is what we want to do, not go out and find the indicator to give us the signal.  This is because we can ultimately find what we want if we try hard enough.

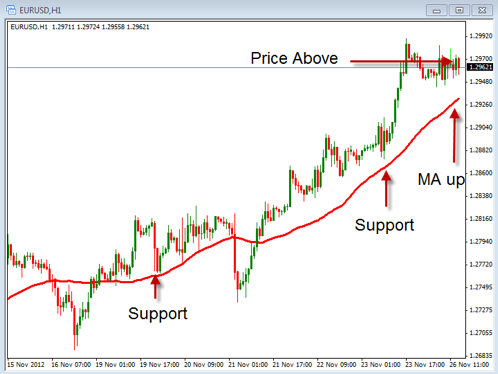
Because of this I want to suggest looking at a 40 period Simple Moving Average to help us identify possible entry points.  Although I won’t suggest specific entry points here I want to look at using this moving average to help us identify two very important parts of a trading method.  Those two parts are to identify the Trend and second to identify Support and Resistance.

Take a look at this chart.  It has the 40 period Simple Moving Average as the only indicator located on it.  Notice that the price is currently sitting above the moving average.  This is the first thing to look for as it tells us that the current momentum in more bullish than bearish.  If the price is strong enough to be above the moving average it has some upward strength being show.  The next thing is to look at the direction that the 40 period Simple Moving Average is heading.  In this case the line is pointing up which confirms the bullish nature of the current price action.  Finally, you can see the several areas as indicated with the up arrows where the 40 period Simple Moving Average is acting as an area of support.  By knowing where the trend of the price is and identifying the areas of support or resistance we can have a pretty good idea of where we may want to start looking for our entries into a pair.

Take some time to practice with this Simple Moving Average to see if it can help you in your trading.  You can also practice with other time periods to see if they might work better than the 40 for your trading method.  Either way it is important to find on moving average to help you identify these important parts of your stock trading methods.

What To Do When You See A Doji On Your Stock Chart

Hi Everybody,

If you’ve been following me for any length of time, then you know I’m a big fan of candlestick charts. I think they do the best job of visually showing you the price action of the market, and they make patterns really easy to see. Which in turn helps you identify trends, and any trader worth his salt knows that spotting a trend is CRUCIAL to successful online stock trading.

So this weekend I was going over some charts and I came across a few doji candlesticks.. Now these doji candlesticks are a little weird, but they’re easy to spot AND they can be very powerful indicators. So I’m going to go over a few for you right here.

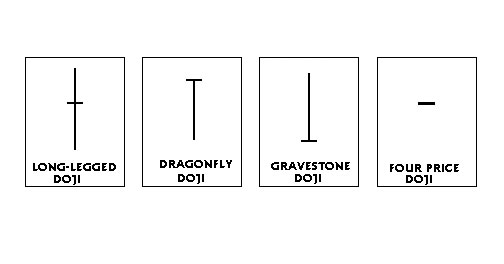
Example #1: The Long-Legged Doji. Long-legged doji formations happen when the stock opens at a certain level, trades in a wide trading range intra-day, and closes at the same level that it opened. These become better predictors when preceded by small candlesticks. Long-legged doji formations can imply a change in trend.

Example #2: Dragonfly doji: The dragonfly doji can usually be found at the market top or during an uptrend. This candlestick tells us the bulls may be losing their way and casts doubt on the market’s ability to keep climbing. Confirmation is essential. You can confirm with a gap down or a lower close on the following day. But once you get a confirmation, boy look out! It’s very likely to drop.

Example #3: Gravestone doji. Gravestones are the mirror image of a dragonfly doji, and indicate a reversal when confirmed with a bearish engulfing scenario.

Example #4: The 4 Price doji. This is an even weirder one and can indicate a few things. Since the price simply didn’t move, then you’re looking at either market indecision, or just low trading volume on that particular stock. Either way, I take this as a sign of “stay away.” The security simply isn’t moving, and it’s hard to trade stocks profitably if the stock isn’t moving. So move on. There’s always another opportunity around the corner, so don’t force it.

So that’s doji patterns in a nutshell. Take a look at some old charts and see if you can find any. And then see what happened after they popped up… I think you’ll see that can be indded very strong indicators.

Good Trading!

The “Fiscal Cliff” & What It Means To The ETF Markets

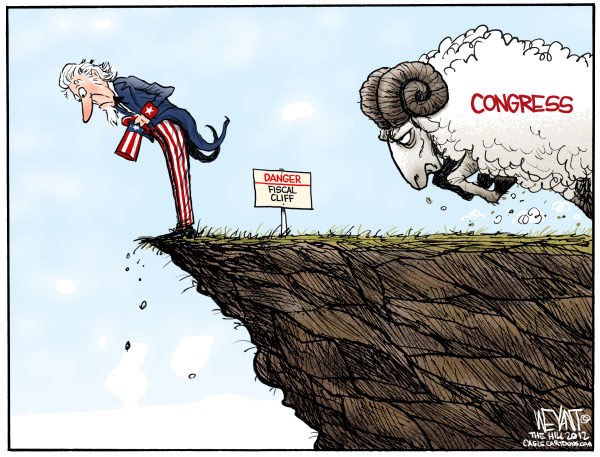
What is the fiscal cliff?  In the United States, the fiscal cliff is a term referring to the effect of a number of laws which (if unchanged) could result in tax increases, spending cuts, and a corresponding reduction in the budget deficit beginning in 2013. These laws include tax increases due to the expiration of the current tax rates and spending cuts under the Budget Control Act of 2011. Simply put, it is the set of tax increases and spending cuts that takes effect in January unless Congress passes a budget deal by then.

If nothing is done and the automatic tax increases and spending cuts take affect the AP reports: “Middle income families would have to pay an average of about $2,000 more next year, the nonpartisan Tax Policy Center has calculated.

But this tax hike is just the tip of the iceberg, If congress and the administration does not come together to solve this emergency problem and the economy is allowed to go over the “cliff,” than the overall impact to the economy, the markets and most citizens will be substantial.

Again the AP reports that according to the non-partisan Congressional Budget Office, they estimate that up to 3.4 million jobs would be lost and the unemployment rate would reach 9.1 percent from the current 7.9 percent.

Considering the markets, stocks could plunge. The nonpartisan CBO estimates the total cost of going over the cliff in 2013 alone would be about $671 billion.  This is a huge cost to the overall economy especially at a time of such slow economic growth.

The projected effects of these changes have led people both inside and outside of Congress to call for extending at least some or all of the tax cuts, and to replace the across-the-board reductions with more specific and targeted spending cuts.

Hopefully congress and the administration can get together and come up with a specific plan to balance the budget which might include a tax reform package to simplify the tax code and lower overall rates, but with fewer tax deductions might increase overall revenue like something similar to the president’s Simpson-Bowles Tax Commission recommendations and spending cuts implemented gradually to balance the federal budget deficit.

Is this likely?  I hope so, but it is anyone’s guess. Many people are holding out hope that the politicians can put aside their partisanship positions and work out what will be a pro-growth tax and deficit reduction plan that makes sense for the sake of our Nation, our citizens in the long run. Everybody is watching especially the online stock traders!

Online Forex Trading Going Mainstream?

I have to admit that I am a huge sports fan.  I don’t play sports much anymore but I really enjoy watching them on TV and going to games in person so it is very likely that at any given time when I am watching television I am either watching a sporting event or one of the sports news networks.  This past weekend I was doing my usual thing watching a football game on one of the sports networks and a commercial came on advertising one of the major Forex brokers.  I have heard local advertising for Forex brokers on radio stations when there are seminars or events in my area and I have seen Forex brokers advertise all over the internet when I go to different websites but I have never seen a commercial on television specifically advertising a Forex broker in this way.  The commercial appeared to me to be of the same quality as any other national commercial would be; it was not much different than commercials for discount stockbrokers which can be seen regularly on all channels.

There were several reasons that this caught my attention aside from the fact that I don’t remember ever seeing this before.  It made me wonder if the Forex market is going to develop into a mainstream type of investment category that will be commonly seen in the average person’s portfolio in the coming years.  In many ways the Forex market seems to have been off limits or almost taboo to an extent when it comes to portfolio planning which is probably due to its perceived risk and the speed at which it can sometimes move?  If it is the case that in the near future we see Forex trades, both long term and short term, in a typical portfolio does this mean that banks, stockbrokers and financial planners will be able to get additional licensing to place these trades for their clients?  If not will there be a massive push by the Forex brokers to educate the general population as to what the Forex market actually is, how it works and what benefit they can receive from understanding it and participating in it?

The thing that came to me next is how much new regulations there will be around the Forex market if something like this really does occur.  A few years ago there were regulations that were imposed by US regulators that restricted the amount of leverage that an American citizen can have in a Forex trading account.  The leverage on many accounts at the time was 100:1, some were 400:1 and I had heard of even greater leverage being offered by some brokers as high as 800:1.  The regulations reduced the maximum leverage to 50:1.  There were also regulations that eliminated hedging for US traders.  One of the more interesting things about these regulations to me at the time was that it seemed as though most Forex brokers and most Forex traders were not in favor of the new restricted regulations at all.  It was almost like the regulators had to justify their existence by doing something to a market that may have been less regulated than others possibly in an effort to bring the profit potential a little more in line with traditional types of trading or investing.  The reason for the regulations that I heard time and time again from the regulators is that they believed that they had to protect Forex traders.  In other words Forex traders are too stupid and careless to make their own rational decisions and will get themselves into trouble and lose all of their money due to their over aggressive trading, ignorance and generally unintelligent nature.  Thank you big brother but I am more than capable of making my own trading and investing decisions and either suffering with or enjoying the consequences.

The thing that I wonder about is what new and restrictive policies will be enacted to once again, over-regulate with further efforts to bring the potential profit in the Forex market down much closer to that of a stock market type investment.   Essentially the last round of regulations reduced the profit of Forex trades by 50% or greater, the reason of course is that now you need at least twice as much money to back the same trades as you did in the past.  A further reduction in leverage will bring the profit potential down again bringing it more in line with traditional or more mainstream types of investments.  If the regulators continue to regulate it is possible that the Forex market could look very different in the future than it does today which is already different than it looked a few years ago.

How Online Forex Traders Should Handle The Holidays

Well, the holiday season is fast approaching and we start with Thanksgiving here in the USA on Thursday.  This is followed by a month of holiday fun ending with Christmas and New Years at the end of December.  This is all good but how does it affect us as traders?  There are various ways that this holiday time can impact our online trading including our emotions and our risk.  These are two things I would like to discuss a bit today.

First, the holidays season seems to cause traders to leave.  They like to spend time with their family and friends and take time to relax.  This means that the markets can trade a bit light.  With this light trading come heavy volatility in the form of the market reacting strongly to somewhat small news announcements.  It can also do the opposite and cause the markets to remain a bit flat.  In either situation we need to be cautious of our trading.

So how can we protect ourselves when the markets are more volatile?  Well, we could simply not trade, although that is not what most traders would choose to do.  We could trade as usual but that might not protect us from the increase or decrease in volatility.  Most traders will choose to do something in between.  One suggestion would be to simply decrease the amount you are risking.  So if you normally risk 2% consider dropping it to 1%. Or if you risk 1% drop it to ½ %.  This way you are still trading while adjusting for the added risk that you might encounter over the holidays.

The other issue that many traders have to deal with is there emotional side of things.  The holidays can bring up emotions that don’t happen at other time during the year.  It could be that we need more money to buy gifts so we become more aggressive than we should or we “check out” because we want to relax over the holiday.  Whatever it may be, just make sure you check yourself before you begin trading to make sure you are emotionally read to deal with the holiday market.

So at the beginning of this holiday season, take some time to review how you will handle and trade a market that may be different than it has been the rest of the year.  By being aware of these possible conditions we can take steps to avoid the negative impact the could otherwise have on your trading.

One last word of advice.  With the markets trading with higher volatility and with emotions at higher levels take some time to relax and enjoy the things that are most important.  This will recharge you energy and help you to prepare yourself to become a better and more focused trader.

Candlesticks And Gold & Silver Trading Price Action

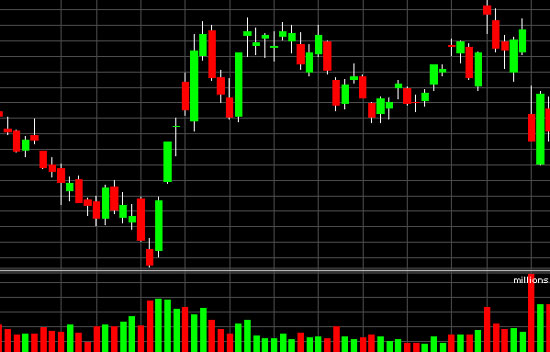
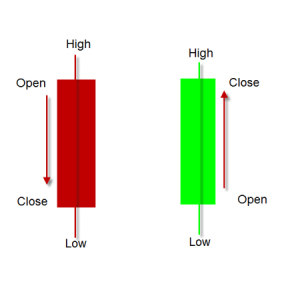
Today I want to spend a few minutes talking about candlestick charts and how it relates to the price action of Gold or Silver or any other thing we are trading.  Whenever we trade we will need to have something to identify the direction that the price is moving.  There are bar charts, line charts and candlestick charts to name a few.  Each of these can give us an idea of the trend and momentum that is happening on the charts.  The candlestick chart is one of the most commonly used charts as it give us a good visual as to what is happening with price.  Take a look at the illustration below that show the meanings of each candlestick.

The red candlestick tells us that the price opened high and dropped to close lower and the green candlestick tells us that the price opened lower and rose to close higher.  We can also see the thin vertical lines that extend above and below the body of the candlestick which show us the high and the low of the price action during the candlestick.

Each candlestick can represent anything from 1 minute to 1 month so you will get a different perspective on the price action with the various time frames.  Knowing the time period you are dealing with can help you know how strong a move is and how much momentum is behind the the move.  For example, if the candlestick is long, but only on a 1 min. time period is a lot different than a long candlestick on a 1 month time period.

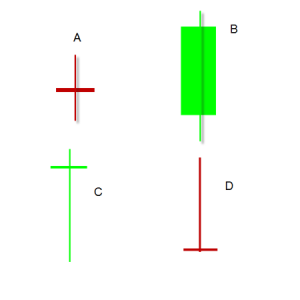
In addition, we can look at the size of the candlestick to understand when this momentum is beginning to slow down.  Take a look at the 4 candlesticks below and you can learn a lot about the price action that is occurring with them.


Candlestick A tells us that there is equilibrium between buyers and seller.  Neither one of them can push the price up or down.  Candlestick B tells us that the price movement is strong in the bullish direction.  This means that he buyers are in control.  If the candlestick was big and red it would indicate that the sellers are in control.  Candlestick C indicates that the price did not move but that it had dropped during the time period only to move all the way back up to where it started.  Again a sign that the bulls are keeping control.  The reverse is true for candlestick D where the price tried to move up but the sellers came in to push it back down.

As one looks at the chart for Gold or Silver you can start to look for the types of candlesticks that are showing up to give you an idea of what might be going on.  It can help you know if the momentum is strong or weak and if there may be some reversal in the price action getting ready to start.  Take some time to look at these so you can better understand this momentum.