Long-Term Chart Trading

Often times when talking about trading currencies, our thoughts turn to the shorter-term types of strategies. While this may be where many traders focus their attention, there are longer-term types of trades that can be looked at also.

Longer-term trades can be reached by either looking at longer-term time frames or by adjusting our indicators to longer parameters. By changing our time frame from the 1, 5 or 15 min charts to the 1, 4 hr. or daily charts, we are changing the time we are allowing the trade to work. Instead of minutes we begin to look at hours and day for the trade to develop and work out. By changing the parameters on our indicators we extend the distance between our entries and our exits. So instead of looking at a 5 or 10 period simple moving average we begin to use the 20 or 40 period simple moving average. This adjustment will make the entries and exits come further apart and give us a longer-term perspective on our trades.

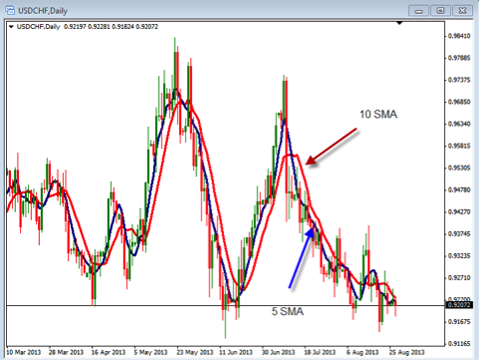
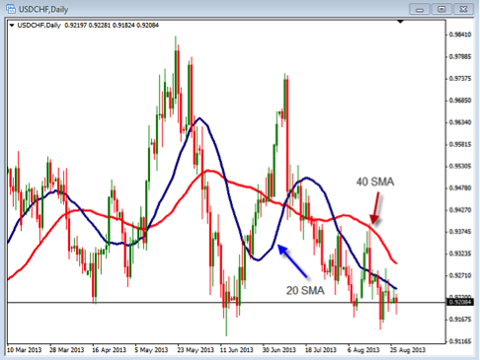
Take a look at the charts below. The first one shows the longer-term indicators while the second shows the shorter-term indicators using the same Daily chart. If we were looking to trade these by using the crossovers of the two moving average lines you will see quite a bit of difference.

On the top chart, you have a 20 and 40 period Simple Moving Average, while on the bottom you have the 5 and 10 period Simple Moving Average. As you look at these two charts you should be able to see that the longer-term one on the top gives fewer signals than the shorter-term one does on the bottom. Or, in other words, the crossovers happen more often on the shorter-term indicators.

The same would hold true if we looked at differences between the 5 min. chart and the hourly chart. You would get more trades by using the shorter time frame. This may be fine, but as a new trader or one learning a new way to trade, you may want to focus on taking trades using the longer-term charts. So instead of having to look at the chart every 5 min. for a possible setup, you are looking for setups on an hourly basis. This give us time to review the entry and to make sure it is meeting all the setup conditions necessary to take the trade.

So, if you are having difficulty finding and trading setups on your shorter-term charts, consider using a longer-term chart. Start by looking at the 4-hour chart and moving down from there. The 4-hour charts give plenty of time to see the setups and to allow you to make entry decisions while at the same time giving you plenty of pips to collect without the stress of having to babysit it minute by minute. You may find that the 4-hour charts fit perfectly into what you are trying to do.
Developing a Good Written Trading Plan

Trading without a specific trading plan can be a dangerous habit. Many traders don’t have a trading plan, or even a daily checklist, but trade on emotions with several different strategies and without any structure or written trading plan.

A good trading plan should include three important parts:

1. Specific Entry and Exit Rules
2. Risk Management Rules
3. Consistent Routine

First, the plan would naturally include a trading strategy or method. Any good strategy should include market entry/ exit strategies depending on the markets traded and current market conditions (stocks, options, Forex, etc.) and the various different market conditions.

Second, a trading plan should include specific risk management rules with clear and understandable risk levels including position size calculations in order to control the risk with each and every position entered.

Third, a good trading plan should include a regular and repeatable routine. The more consistently a trader follows a set routine the more consistent will be in the implementation of a good trading strategy. Several traders have told me recently their biggest problem is not finding a good strategy, but rather implementing a consistent routine. Once a routine is carried out consistently, trading success will become much more likely depending on the market strategy.

A routine is best written down as a checklist so that it is simple and repeatable. Each individual trader needs to adapt a checklist to their individual needs. The checklist below is a potential outline that will get a new trader started. Modifications should be made depending on the trader preferences, type of trading (day trading, swing trading, position trading) and trader experience.

1. Check/read newsletters from paid/unpaid subscriptions from signal service, news, analysis, etc.

2. Check the day’s economic calendar for any scheduled reports and announcements for the day– This part covers the fundamental analysis. Check the expected numbers against reports that will be published during the day

3. Check the charts for price action, this is mainly for a trader who trades using technical analysis. Normally you will check to see if the prices have violated any support/resistance areas. For technical trading, some the most popular indicators and tools used are:

– Support/Resistance Areas (daily, week, month)
– High/Low/Open/Close and Candlestick Patterns
– Indicators, such as Stochastics, MACD, RSI, Momentum, Volume, etc.
– Fibanacci Retracement Levels

4. Write down thoughts while going through a checklist– This step is for the trader to write out trading ideas for the day, how much to risk , where he’ll be taking the position and where he’ll exit, and how large the position size he’s going to take.

5. After the trading session is over or after the trading day is complete it is important to document or journal each trade, with entry, exit, profit, loss, risk in trade, justification for entering, and etc.

Once you have a good daily checklist that you are following, it is important to use it by following the plan every trading day. This will help you to be a much more consistent traders with hopefully more consistent results!

So, If you don’t have one already, make a written trading plan with a simple, easy to use daily checklist, and keep a daily journal of all trades.

Deliberate Price Action

One of the most difficult things with trading is to find price action that is moving in a deliberate fashion. A chart that shows price action that is moving deliberately is one in which you can have more confidence in taking the trade. On the other hand, if a chart is moving non-deliberate you will find it more difficult to identify trade setups which will cause you to be less confident in your trades. Any time you are not confident in you trading, you are likely to be less successful.

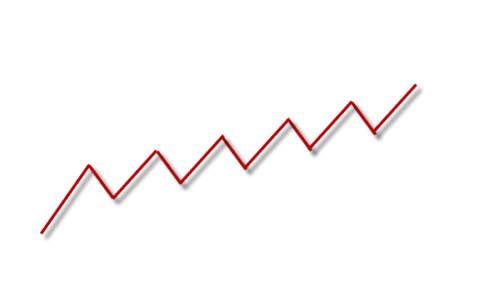
So today we are going to look at the difference between a non-deliberate price movement and one that is deliberate in how it moves. As we look at these we must remember that we can draw a perfectly deliberate price move but that may not be what it actually looks like in real life. For example, take a look at the graph below to see what a “perfect” and deliberate price action might look like.

With this price action you can see that the movement up and the movement back down is equal in their lengths. While this might be a perfectly deliberate example, in real life trading you will seldom find the nice of a move. Generally, you will find things that look similar to this but they won’t be so perfect.

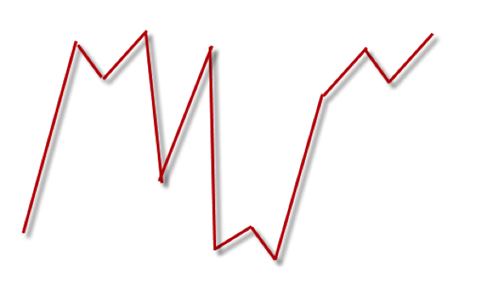
When identifying a non-deliberate movement we will look at two basic scenarios. The first is that the price action is too volatile and the movement too unpredictable. The second is where the price does not have much movement at all. Both situation are non-deliberate and difficult to trade. In the charts below you will see both of these price movements.

In the chart above you can see that the price action is very volatile and unpredictable in its movements. This type of movement makes it very difficult to know when to trade. If we see price action like this we are better off waiting until this non-deliberate movement is done.

Now in this chart above you can see that the “flatness” of the market has make the chart non-deliberate and pretty much untradeable. It is very difficult to trade in either of these situation as the price action is not deliberate in the moves.

Deliberate price action is one of the most important things we can look for when we are trading. It does not matter how good or strong our trading rules are if the market is not deliberate we will not find our trades working out like we want. Deliberate movements will allow us to have the confidence that our trading rules will work out the way we want them to. If we focus on identifying these types of markets we will be placing ourselves in the best possible place to be successful.

Take some time to review the types of price action you are seeing on your charts and begin to identify those that are deliberate vs. non-deliberate. As you do this and look for deliberate price action you should find greater opportunities to have more successful trades.

Forex Trading With 100% Success

I communicate with a lot of Forex traders on a regular basis and some of their biggest concerns center around their risk/reward ratio and also their ability to earn consistent profits. What if you could find a way to earn consistent profits in the Forex market while at the same being so accurate that the protective stop that you use is more of a formality in the respect that you almost don’t even need one? The protective stop is basically for disaster protection if something horrible happens somewhere in the world. How would you react if I went on further to suggest that most Forex traders that are decent traders only need to make one small adjustment to their trading and they could turn their trading life around almost instantaneously?

Several years ago I realized one of the most obvious things about the Forex market which is that it is largely unpredictable but like most traders I looked at Forex charts regularly trying out a multitude of indicators using them in both conventional and non-conventional ways. My conclusion back then is the same as my conclusion now which is also the biggest reason that I believe that Forex trading robots cannot work over an extended period of time. The reason is very basic it is simply that the way the price action of the pairs moves changes over time so what works today won’t necessarily work in the future at least to the same extent. Like any good risk taking Forex trader I persisted and developed a tremendous number of trading methods. Virtually all of the trading methods that I developed work great “until they didn’t”. After repeating this process many times I finally realized the one true consistency that is innate in the Forex market which was the “until they didn’t” part of the statement above. In a general business setting I have always believed that you can do business with any type of person as long as you understand what type of person it is that you are dealing with. Applying this to the Forex market forced me to believe that I can conduct business in the Forex market I just need to recognize what type of market it is. My conclusion was that the Forex market is the type of market that will stay the same for a period of time and then it will change sometimes quickly and sometimes gradually but it will change. It is how the actual price action of the pair’s moves, changes and morphs, often times making what worked last week not work this week and what works for trading some pairs does not work well at all on others.

That being said more proactive action and a little common sense is obviously necessary. Anytime any trade is entered into in the Forex market we have a 50/50 chance of winning on the trade because eventually there are only two choices of direction which are either up or down. If you add an indicator or two and a few rules to create a trading method you may be able to skew the odds of winning in your favor by X percent. All you really need to do at that point is to determine when applying the trading method does each trade go in the money before they go significantly out of the money and how far in each direction do they go. The better the method is the further the trades will typically go in the money before they go significantly out of the money so at that point all you need to do is to determine by what number of pips do all of the trades go in the money before they turn against you. The number of pips is largely irrelevant because at that point you have discovered how to win on virtually every trade that you participate in.

Place your profit objective comfortably under whatever number of pips it is that you can win on with a high degree of accuracy and you will rarely lose. The fallacy around this strategy is, for example, when traders have a 25 pip profit target and they see a market move of 150 pips they may feel like they have given up a lot of pips. In reality if they won a good amount of the 150 pips on that one trade they will likely give back most of it on the next trade or two so being somewhat conservative and consistently looking for a very achievable number of pips takes away a lot of the uncertainty of trading and largely takes the trader out of the management equation. The big wins and often times bigger losses along with the consecutive losses can create the need to constantly change or adjust the trading method used, all of this will go away for the most part. Consistently winning a smaller number of pips will allow you to confidently trade with a much bigger position size which using this strategy is what really controls the amount of money made on each transaction. Increasing the position size as the account grows will compound the account in a consistent way or it could create the steady income that many traders are looking for.

Exit Strategy

Before you enter a trade, do you think where you will exit?
When looking for good trading opportunities, many traders are so focused on the trade setups and making good entries for a trade and they don’t think about or exits and are not nearly as concerned about how they are going to close the trade. This is very short sighted on the part of many traders, because to a large measure, how and when the trade is closed will determine how much profit is in the trade. 

How to define your exit strategy
Traders who trade without good exit procedures in place are not really planning their trades but are really just hoping for a good outcome. Most successful traders plan out their exits by setting initial stop-loss and take-profit targets. Stop-loss and take-profit points represent two key ways in which you can plan your exits. On the other hand, unsuccessful traders often enter a trade without having a good idea of what points they will exit the trade at a profit or a loss. This is more like gamblers on a lucky or unlucky streak, emotions begin to take over and will dictate their trades. Losses often provoke people to hold on and hope to make their money back, while profits often entice traders to be greedy and hold-on for even more of a gain then is prudent. 

Planning exits with Initial Stop-Loss and Take-Profit Levels
An initial stop-loss point is the price at which a trader will close a position and take a loss on the trade. Often, this happens when a trade does not go the way you had hoped. The initial stop loss point is designed to prevent the “it will come back” mentality and will limit losses before they get overwhelming. For example, if you are long in a stock and it breaks below a key support level, it is often a good time to close the position.

On the other side of the table, a take-profit point is the price at which a trader will sell a stock and take a profit on the trade. Often times, this is when there is limited additional upside given the risks. For example, if a stock is approaching key resistance level after a large move upwards, traders may want to sell before a period of consolidation takes place. 

Where to Set Initial Stop-Loss Points
One good way to determine stop-loss or take-profit levels is based on support and resistance levels that can be drawn by connecting previous highs or lows that occurred on significant, above-average volume. A trader can also use longer term moving averages to help establish potential support and resistance levels. The key to determining the best initial stop loss is to determine solid support and resistance levels and to set them just outside these levels by ½%.

Conclusion
The important thing to remember is that you should never place a trade before you determine what your possible exits will be. Know in advance where you are going to place your initial stop loss to keep your losses to a minimum, if the trade goes against you. To keep from getting greedy always place your profit target where you are willing to take a profit when the trade goes in your favor.

Multiple Chart Analysis

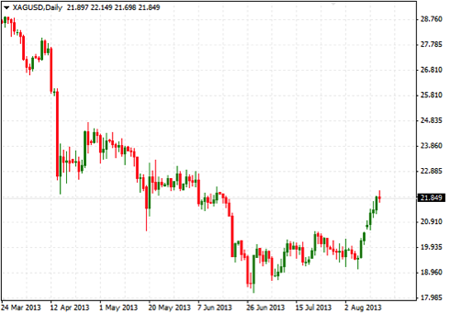
With the recent movements in Gold and Silver, today we are going to take a look at what is happening with them on various time frames, looking at their trend and areas of support and resistance. As we have discussed in the past, we need to make sure we know the direction that the momentum is going in order to place ourselves in the best possible position.

We will begin by looking at both the daily chart for Gold and Silver:

There are a couple of things we should notice on these charts. First, you should see that the prices are currently moving back up. This is significant because of the downtrend we have seen since last September.

The chart on the left is the daily chart of Gold. You should see that in addition to the current movement higher that we are sitting near some resistance. Not only is the price at the prior high point but it is running into prior support areas from the lows back in May. In order to trade this to the upside we would need to see this area broken and the price close above it.

The chart on the right is the daily chart of Silver. You should notice that unlike the chart of Gold that Silver has broken through the overhead resistance. This has led to a stronger up move over the last week or so. We will look for opportunities to take advantage of this bullish strength as new pull backs occur.

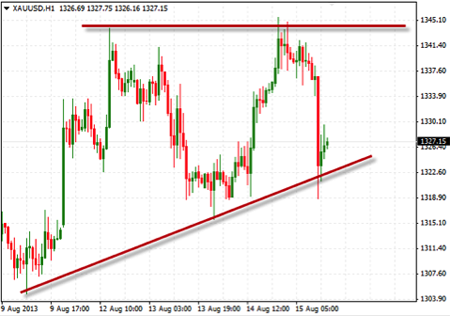
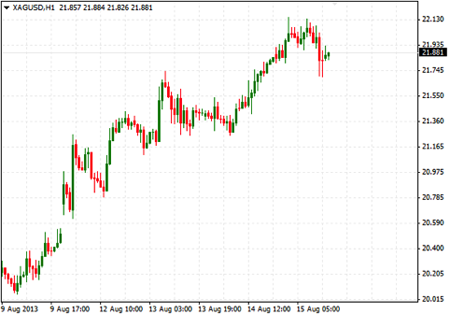
Now that we have looked at the longer-term view of things we can drop our time frame down so we are better able to see possible entry points. In the charts below we are looking at the hourly time frames:

On the left is the chart of Gold. Take a look at the lines drawn on the chart. The top line is the area of potential resistance that we saw on the daily charts. The bottom line is a shorter-term line of support. As we look to trade this we can use these area to help identify possible entries. The Silver chart on the right is showing that stronger trend that was seen on the daily charts. Currently it is pulling back to an area of support where we would look to enter into a long position.

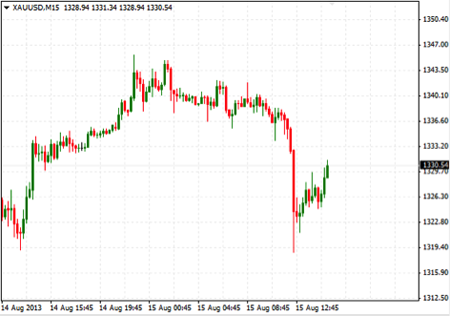
We can now drill down even further and look at the 15 min. charts for an even clear picture of what is going on:

Now that we are looking at the 15 min. charts we can see the potential entry point on the screen. If we are looking to take a long position, we would wait for the 15 min. to show a bullish trend where price is sitting near support. You can see this is similar to what is happening on the right chart of Silver. If we are looking to short, we would look for the trend to be down and the price sitting near resistance. Regardless of your entry rules, you can use longer-term charts to help you narrow down the decision making process. Know that you are trading along with the longer-term trends will also bring you more confidence in your trading.

Take some time to review your process for using longer-term charts.

More Important Than Finding The Best Trades…

Would you like to find the best trading system so that you have no risk? This desire starts with the notion that investing can be risk free. Most successful investors, at one time or another in their investing career have spent some time and some money searching for that “perfect” system. There are many advertisements claiming to have a “perfect” or near perfect system. The other day I got an email claiming to have a “no loss” system. There are many good systems out there, but let me be very clear: There is NO perfect system, period!

The hard reality is that there is no effortless way to make money in the market no matter the claims on radio, or infomercials or unsolicited emails. The truth is; and any longtime successful trader will tell you that there is one main key to trading success. Certainly a good system or trading method is important, and investor education is also essential, however, the key is more important than the system used.

The most important key to successful trading truly is risk management. How can I say this? How could risk management be more important than the method or the system you use to trade? If these are questions you are asking yourself, and then ask this one as well; even if you have a good system that works very well most of the time, what system removes all market risk? The answer is NONE, there is no such system. Since such a system does not exist, the only way to be successful in the long run is to manage the risk we take with each and every trade. Said another way, the very best of systems can only put the probabilities in our favor, or minimize losses not eliminate then. With each trade we take we should be able at know how much of our account is at risk if the market moves against us, due to anything that we could not predict. My rule is to always use a stop loss and never risk more than 2 percent maximum of your total account on any one trade. Nobody likes to take a loss, and I am no different, however, by managing my risk per trade I adhere to the “slow and steady wins the race.” theory of investing and never go for the “home run” trade because there are no “sure” deals in life only the possibility of success if we manage our risk and therefore, protect our trading accounts. Risk management will help us to save our accounts from fear and greed, so that even in uncertain times like we are currently in we can trade and get a good night’s sleep!

So the important key to trading is to implement strict Risk Management Rules in you trading plan. My simple recommendation is to limit your maximum risk per trade of no more than 2% of your account (New traders should target 1% to start with) and don’t go against your risk rules.

Long-term vs. Short-term Investing

It seems as though every time that there is a market correction or what appears to be the potential for a market correction the question comes up about whether it is better to be a longer term or a shorter term investor. The question probably comes up because of what is going on in the market “right now”, at any given time, which can make people a little uneasy. When we are experiencing market conditions that are generally trending in an upward fashion generally speaking most people seem to feel good about things. The average or less interested or less sophisticated trader or investor is not likely to take a short position so they will only feel profitable when the market is rising. When the first day occurs that has a downward gap or when we see consecutive downward day’s investors with long positions can get trigger-happy. The shorter term an investor’s position is, the more trigger happy the investor is likely to be.

If we have a very long time horizon for our investments like the old “buy and hope” strategy had we wouldn’t even notice a major bump in the price action of our position in fact in a lot of cases very long-term investors won’t even notice a major downturn or a major upturn. Oddly enough, to an extent, this is a function of how closely they follow their account balances and performance. Very long-term investors that look at the balances of their accounts once a year or a few times each year may see that the values of their investments are up but what they may not see is that they may have been substantially up at one point and then fell back to current levels. Conversely it is also possible that the balances had gone substantially down at one point and recovered just enough to be ahead of where they were the last time they looked at them. In both cases even though their current balances are up from they were the last time they looked at them they can still be down for the year or for some other period while still showing positive results to them. The point is that in both of these situations the longer term investor is very likely to be satisfied with their performance due to their being oblivious to the reality of the market volatility.

Since an investors time horizon is relative the same or similar things can be said about traders that trade based on daily charts and hold positions for a few days or a few weeks. There is a lot of two way action that occurs in the price action of securities throughout any given day that an end of day trader will not even notice. One of the best examples of this is when there is an economic news report that is published which on occasions can make the market gyrate wildly showing tremendous short-term volatility. These moves can make a short-term investor a lot of money quickly or it could destroy their position just as quickly but the end of day trader will likely not even notice that most of this has occurred.

Regardless of if you are very long-term investor, like you may be when making investment selections in a retirement account such as a 401k, 403b or any type of IRA, or if you are a shorter-term investor, make sure that you have the right investment vehicle for the type and duration of the investment it is that you are making. Be sure to match up long-term investment horizons with the proper type of long-term investments and likewise with shorter-term investments match up the proper short investment vehicles with a short-term time horizon. Be sure to select the proper investments for short-term positions regardless of if the position will last minutes or hours or a few days or weeks. Just like anything else, be sure to do the proper research so you are using the proper tools for the job that you are performing.

What is Support and Resistance?

Today we are going to look a little deeper into what support and resistance is all about. As you know when evaluating charts we first look to identify the trend that is currently happening followed by where support and resistance are located. Support and resistance are the areas on the chart where the price will encounter difficulty in moving any further. This difficulty can be the result of various factors but regardless of why it is finding difficulty we need to know that it is there. The purpose of finding support and resistance is to help us to know if we should be looking to buy or short the trade, or when we are in the trade we should look to close them.

When we find support and resistance we can then look to go long when the price is at support and short when the price is at resistance.

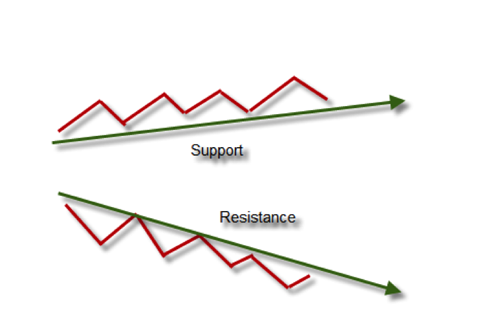
Take a look at the chart below to see how this might look:

The top line represents a chart that is in an uptrend and the bottom line represents a downtrend. The green lines are showing the support area on the top line while the green line is showing the resistance area on the bottom line. When trading these areas we will look to buy at support and short at resistance.

So the question now is what causes these particular areas to actually act as support or resistance. It is not any magical number but rather an area where buyers and sellers are seeing good opportunities to trade.

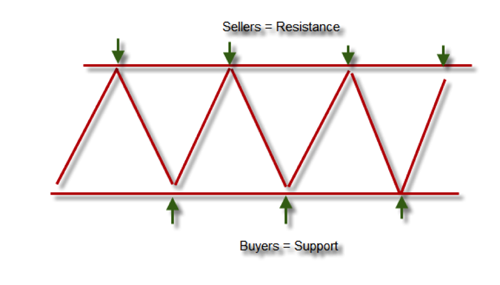
Take a look at the chart below:

In this chart you can see that the support area is the place where buyers are attracted to the price of the currency pair. As they are buying, they are causing the price to increase as the demand for the pair increases. The reverse is true for the sellers at resistance, they find that the price is advantageous to sell their position. This lack of demand will then cause the price to decrease. As long as these areas are consistent, the price will continue to bounce up off of support or down from the resistance areas.

When the buyers and sellers are in equilibrium you will see that the overall price movements will tend to move sideways. Once the buyers become stronger than the seller you will see the price begin to trend up as the demand remains stronger than the supply. This is where we get the price trending up. Once the sellers become stronger than the buyers you will see the trend begin to move down.

Knowing how to find support and resistance and understanding why it is there can help us become better traders. This is one of the reasons we focus on trend and support and resistance. It is because it shows us the reason behind the price action on the charts.

Take some time to review how you draw support and resistance on your charts. This will help you better see where you should be buying and selling. In addition, we can know the reasons why these areas are so important.

How Can You Determine the Strength of a Trend?

If we could determine the direction of the trend, we have a direction to trade. However, the strength of the trend is also very important. One very good technical tool to help determine the trend’s strength is the Average Directional Index (ADX). The ADX indicator measures the strength of a trend and can help determine if a trend is strong or weak. If the ADX numbers are higher it indicates a stronger trend and lower numbers which indicate a weaker trend.

If the ADX indicator is showing a lower number, the trend is weaker and a range or channel is likely to develop. Since we are always looking for good trends to trade, it is best to avoid trading stock, ETF’s or Forex Pairs with low ADX numbers. You would rather look for investments that have higher readings thus indicating a stronger trend.

Some charting packages may have two other lines on the chart, +DI and -DI (the DI part stands for Directional Indicator). I don’t pay any attention to these additional lines, when determining the strength of a trend, for this purpose we are only concerned with the main ADX number.

It should be noted that the ADX indicator measures the strength of a trend not the direction of the trend either bullish or bearish. Therefore, a high ADX number could indicate either a strong uptrend or a strong downtrend. It does not tell you if the trend is up or down, it just indicates to you how strong the current trend is.

How to interpret the ADX Scale:

If the ADX indicator is between 0 and 20 then the stock is generally in a trading range. It is likely just chopping around sideways.

Once the ADX indicator gets above 20 then you will often to see the beginning of a good trend. Big moves tend to start at about 25.

When the ADX indicator gets above 25 then you have at a stock that is in a strong trend (up or down).

If you have lower numbers, you have a trading range or the beginning of a trend.

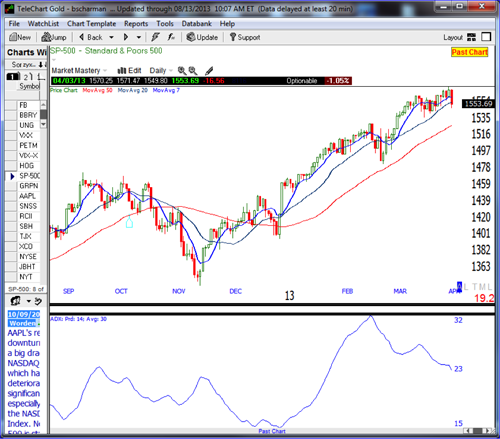
Here is an example of the ADX indicator on an S&P 500 chart:

In the S&P 500 chart above, notice the ADX indicator is the blue line at the bottom of the chart. Notice when the ADX is showing a low reading the price is moving more in a sideways channel. Notice what happens when the indicator gets into higher territory (over 20) the S&P500 is in an uptrend. These are the trends (either up or down) that are the best to trade!

So how do most traders use the ADX indicator? Traders often will look for ADX values of 25 or greater to help determine a strong trend for trading. The ADX indicator is not used to give buy or sell signals. Therefore, it is generally used along with other indicators for entry and exit signals. It does, however, give you great perspective on the trend of a stock, ETF or Forex Pair.