Start 2014 Right With Trading Resolutions!

The new year is a great time to sit down and set trading goals and objectives for the coming year. Whether you are trading Stocks, ETFs, or Forex, it is important to look at what has worked for you this last year and maybe what hasn’t worked so well. Then incorporate those ideas into your trading plan for the 2014.

Like anything important in life, we should set aside time periodically to evaluate our plan and refine it with our goals in mind. It is like reviewing your Will or Life Insurance Policy for your current circumstances. It is very difficult to evaluate something that is more concept than reality. So if you don’t have a written trading plan, now is the time to get one and make sure it is in writing. It has been said, “A goal not written is only a wish.” A trading plan not written down is only a dream, and dreams are good, but it is very difficult to trade on a dream.

When thinking of a written trading plan for yourself, you should consider something akin to a personal trading Mission Statement. Any business has a difficult time succeeding in the marketplace without clear goals and plans for the future, including some details. As an individual trader you need to look at your trading activities more like a business with clearly stated goals and objectives.

When we think of trading plans, sometimes we think our trading rules are our plan and, therefore, don’t need anything more comprehensive. However, I am convinced that you can have the best system available, the best trading rules, or the best indicators for your entries or exits, but, without consistent application of these rules, you will have a difficult time being successful. A system is not a trading plan; it is only a part of a trading plan.

You need to think of yourself as a trading business, not just a trader. And a trading business would include an overall look at your trading goals and objectives, trading routine, trading capital, etc. Also, in your trading business, you should be keeping appropriate records or a trade journal. In other words, I am referring to what and why, not just the how.

With the new year upon us, now is a great time to get started. Sit down and ask yourself some tough questions about your trading and how you think you can become a better, more consistent, trader and be prepared to write down some honest answers to those questions. When you identify areas where you can improve, include them into your specific action plans as part of your 2014 Trading Plan and be prepared to review these periodically.

One last idea is to share your plan with a trading friend or partner. This will help you become more accountable and give you more incentive to make the changes you would like to make and stick to those changes. Just like other new year’s resolutions, if you involve others in your goals, you will find that you may have more support to improve your trading.

So, in conclusion, sit down and write out a personal trading plan, including a mission statement, your trading goals, and your trading routine. Then share it with a trading friend, or mentor, and, most importantly, follow through and work your plan!

Trading Well

In preparation for the end of 2013 and the beginning of 2014, I want to address the topic of trading well. You may ask yourself, what exactly does this mean? You may think, at first, that this means we are making money. Trading well is more than just the process of being profitable, although this is the result of trading well. Profitability does not mean that someone is trading well; it just means that the trades they have taken have turned out to make them money. The process of trading well goes beyond simply making money, it entails all the things that will help you be successful (and profitable) consistently over the long run. Anyone can get lucky and make money in a trade, but the truly successful trader can do it over and over again by using their trading plan. So the process of trading well includes many things, but we will focus on the concept of having this trading plan that will bring us longer-term success, not just being lucky in our trading.

Too many traders make the mistake of thinking they are successful just because they made a profitable trade. They even may do well for a time but in the end, if they don’t have a well-defined trading plan, they will end up losing when all is said and done. The question we all need to ask ourselves is, “Am I successful because I am getting lucky or because I have my plan in place?” If you cannot say you have a well-defined trading plan, you are not going to trade well.

So, what is a well-defined trading plan? Well, it is something that you have written down that will tell you two basic things. First, when do you enter a trade? And, second, when do you exit the trade? If you know these two things you will be able to develop your well-defined plan. These sets of rules will be the basis for you getting into and out of a trade. If you don’t have these things, take some time to think about them so you can begin developing confidence in them.

Once you have a well-defined set of rules for entering and exiting, you need to develop your rules surrounding them. You need to have your money and risk management rules, time management rules, and provisional rules for your trading. This will come as you practice and develop your entry and exit rules. Once you have these things down you will want to start trading them so you can get a good feel for how they work and what things you might need to adjust.

This is just the beginning of trading well, but a key part of it. If you don’t have these rules in place, you will likely never learn how to trade well. Trading well then becomes how you implement your trading rules. You will then begin developing the discipline you need, which brings the consistency and confidence needed to trade well. Take some time to work on this through the end of this year.

The VIX and Last Week’s FOMC Announcement

Prior to last week’s FOMC announcement, there was much anxiety in the market. The anxiety was mainly caused by the uncertainty of how much the FED would “taper” the current stimulus program, commonly referred to as QE3. This is where we can use the ADX indicator to look at what volatility the market perceives. Let’s take a look at how the VIX is constructed and how investors can use it to evaluate the U.S. equity markets.

First of all, what is the VIX? VIX is the ticker symbol for the Chicago Board Options Exchange Market Volatility Index and it is a general measure of the implied volatility of the S&P 500 index.

Where did the VIX come from? The VIX was first introduced by the CBOE in 1993 and was a weighted measure of the implied volatility of eight S&P 100 at-the-money put and call options. Ten years later, it expanded to use options, based on a broader index, the S&P 500, which allows for a more accurate view of investors’ expectations on future market volatility. Higher VIX values are generally associated with a large amount of volatility as a result of investor fear or uncertainty, while lower values generally correspond to less stressful, even complacent, times in the markets.

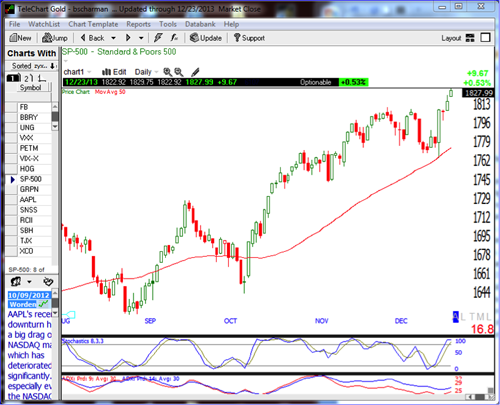
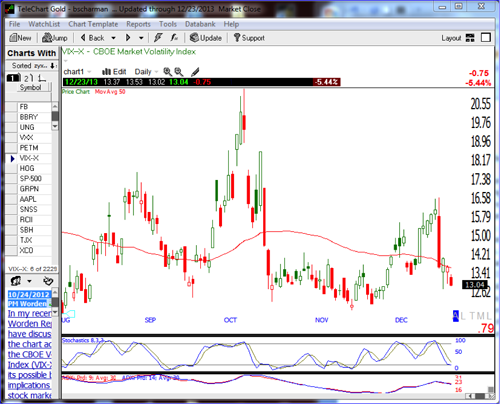
During periods of market uncertainty, the VIX often spikes higher because there is a panic demand for OEX puts as a hedge against further declines in the overall stock market. During more bullish periods, there is less fear and, therefore, less need for stock investors and portfolio managers to purchase puts. The VIX is often referred to as the “fear index” or sometimes the “fear gauge” because, at times, when the index rises due to market volatility increases, the market tends to be in more of a panic and often the panic leads to a market sell-off. Conversely, during times when the market is calmer, either ranging or a steady trend, the VIX is lower, as the volatility is lower. This inverse relationship in the market is illustrated by the S&P and VIX charts in Figure 1 and 2 below.

Figure 1: Current S&P Index Chart

Figure 2: Current VIX Volatility Index Chart

Notice that after the FOMC announcement last week, the VIX spikes down showing that some of the market fear that had been anticipated was relaxed and also note that the S&P index moved sharply higher to new, all-time highs. One saying that is often used when referring to the VIX is: “When the VIX is high, be ready to buy.” Generally speaking, when the markets are in a panic, the VIX is higher. After a sell-off or panic is over, the market has generally moved down and maybe in a good place to rebound or move higher. This is exactly what happened last week after the FOMC announcement.

So understanding the emotions in the market, or what is often referred to as market sentiment or “fear”, is very important, and using the VIX index is a valuable tool for investors looking for some clarity about the market direction.

Plans for Next Year

If you haven’t already started planning your trading business strategy for next year it may not be too late, but it’s really close. Today is December 23 and I have stated in the past that if you do not have your first quarter planned out by the middle of the fourth quarter, you may as well forget the first quarter and start to look at the second quarter of the New Year. While I still believe this to be the case, if you already know what it is that you want to achieve in the New Year but just haven’t written it down in a usable easy-to-follow format, you still may have time to do so. But you are quickly running out of time!

Going into the New Year with no plan at all just about assures that you’ll flounder around for at least a good part of it until you solidify your goals and how you are going to reach them. Planning your goals for the New Year as early as possible in the fourth quarter of the current year provides a nice road map for exactly what needs to be done from the first business day of January, going forward, so your business flows seamlessly from one year to the next. If you go into the first business day of the New Year with no goals and no road map at all, you may soon find that you are wasting days, and then weeks, and maybe even months, deciding what it is that you want to accomplish for the year. The longer this process takes, the more and more time is burned, leaving less and less time to achieve your annual goals.

Looking at the current year-end results can reveal exactly what happened this year, leading you to see if any adjustments that were made to your plan throughout the year were warranted or if you somehow had gotten off track. Generally speaking, some of what has happened in the current year will almost always be considered good or bad based on how close you were to achieving your goals. The end of the year provides a good time to look back to see what has worked and what has not worked, which can allow you to be realistic about what you may be able to accomplish in the New Year. Some goals, though they are very good, may have to go in the long-term goal category, which may be one to five years out, or more in some cases.

Having short-term goals will likely lead to the development of long-term goals – just make sure that any goal that you set is realistic. Having a five-year goal to be the first trader that trades from Mars may not be as realistic as having a given amount of assets for retirement at the end of five years. Throughout the year, having regular meetings with yourself to determine if you are on track to reach your goals and to see how you are progressing will lead you to be able to determine if any adjustments need to be made. If you are constantly working toward your goals, not accomplishing them may become unacceptable because, on some level, it can be considered a failure. So making sure that they are achievable is very important, almost more form a psychological standpoint than for any other reason.

Sometimes I hate admitting this because it can really get annoying, but listening to the wisdom of old adages and sayings and paying attention to their advice can make allot of sense. With that being said, I have to use this one, “One of the best ways to be successful is to plan your work and to work your plan.”

What’s Up With Gold?

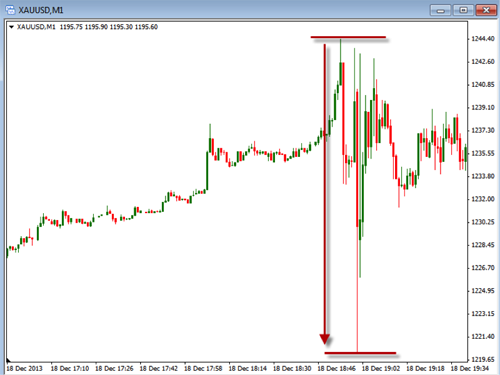
In today’s article we are going to look at the more recent movements happening with gold. After yesterday’s FOMC announcement that they are going to reduce the bond buying by $10 Billion, we saw some fairly big reactions in the stock, option, forex and metals markets. This movement drove the price of gold down to some of the more recent lows. Take a look at the chart below to see how it reacted right after the announcement came out.

In this chart you can see the amount of volatility that occurred on the 1 min. chart of gold. This reaction can be very difficult to trade and can cause our emotions to become very high. If our emotions are high, we tend to make poor decisions in our trading. The interesting thing is that after all the ups and downs, it ended about where it started. In the next chart you can see a bit of a longer view of the reaction to the news.

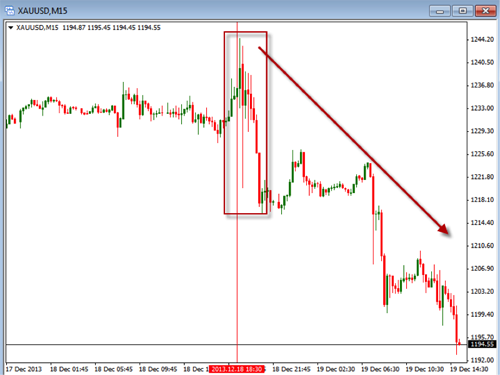
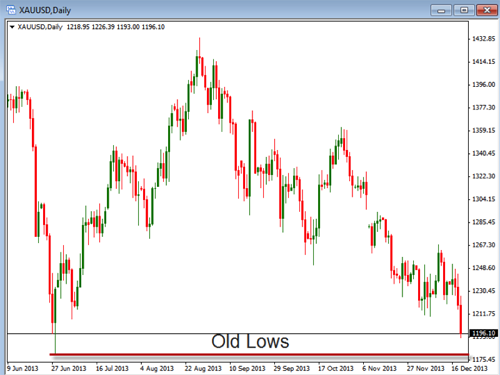
This chart is the 15 min. chart of gold. You can see the outlined area that shows the initial reaction to the news followed by an extreme move down. The question is – how far down will it move before it hits support? In the next chart we can see where this support may be located.

As we approach this level of possible support, we will be watching for a couple of things to happen. First, we will see if the price is supported at this level. If there is support, we will be looking to take a long trade, as our indicators give us the trigger to enter the trade long. Second, if the price breaks below this old low, we will look for opportunities to short this on further weakness.

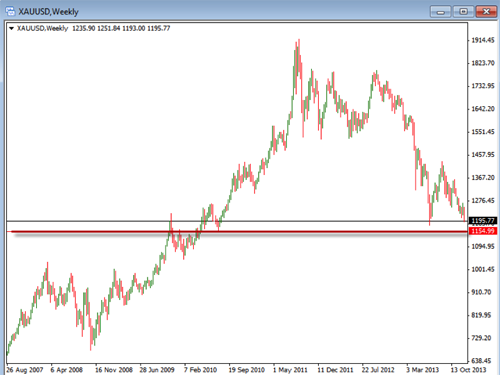
In the last chart above, we can see the next level of possible support. This would be where we would anticipate price to move if it breaks this next old low. After that, we could see a more significant drop into multi-year lows.

Regardless of what happens, we need to be prepared to trade the move either way. We should not care so much as to which direction it goes but whether or not we are prepared to take a trade on confirmation of a move up or down.

The important thing we need to do now is to look for the evidence needed to go long or short gold. If you have specific indicators to tell you when to go long or short, it will make your job much easier. There are many things you can use from moving averages to stochastics or any other number of indicators. The key to successfully using them is to first understand what the price is doing, then confirm the price action with the indicator you are using. By waiting until the evidence confirms our entry, we will be trading based on the facts of the chart, not on the hope that it will move in our favor. Take some time to review gold to see if it give you some opportunities to trade it.

What’s Included in a Good Trading Plan?

Have specific trading goals.
Before you enter a trade, set realistic profit targets and understand your risk and exposure to the market. What is the minimum risk/reward you will accept? Many traders will not take a trade unless the potential profit is at least two to three times greater than the risk. For example, if your stop loss is a dollar loss per share, your goal should be around $2 to $3 profit. Establish weekly, monthly and annual profit goals as a percentage of your portfolio, and be willing to re-assess them regularly to adjust to the market conditions.

Determine a good practical trading ROUTINE!
Following a consistent routine is one of the most important elements of successful trading, no matter what you trade and what style of trader you are. For example, you should have a simple checklist of things you do before, during, and after you trade. If you are trading in the morning, you need to know what is going on before the market opens, what is going on in overnight markets, or other relevant markets. You may want to put a list of these items in front of you and decide whether you want to trade ahead of an important economic report. For most traders, it is better to wait until the report is released than take unnecessary risk trading just before the report is released. Other things on your check list should include: before you start your trading day, no matter what trading system or program you use, label major and minor support and resistance levels, set alerts for entry and exit signals, etc. Your trading area should not offer distractions. Remember, this is a business, and distractions can be costly.

Use specific Entry and Exit Rules.
If you have specific, back-tested entry and exit rules and follow them, you will have a much better chance controlling your trading emotions and being more systematic. Once you’re in a trade, often times, the exits are the most important part of the trade. Knowing when to exit a trade is even more important than when to enter the trade. Part of your exit strategy should include the placement of stop losses; that way, if a trade goes against you, there is an automatic plan to exit so that you are not left to your own guesswork as when to exit.

Keep a trade journal and reports.
Successful businesses generally keep good records. Successful traders should also be good record keepers. If you win a trade, you want to know exactly why and how. Write down details, such as justification for entry and targets, the entry and exit of each trade, the time, and record comments about why you made the trade and lessons learned. Remember, trading is best treated like a business and successful businesses keep accurate records. Write a daily or weekly summary report depending on how active your trading system. After each trading day or week, prepare a summary report adding up the profits or losses and, just as important, write down your conclusions in your trading journal so that you can reference them again later.

4 Hour AUD/USD

In my last article we discussed some ideas about reading charts. Today we are going to look at some additional ideas that we may be able to use when it comes to our chart analysis. Below are three charts and on each of these charts are different things we can use individually or in combination to look for some trading opportunities. You will want to make the determination yourself as to how much or how little you use to decide when and what to trade.

Chart #1

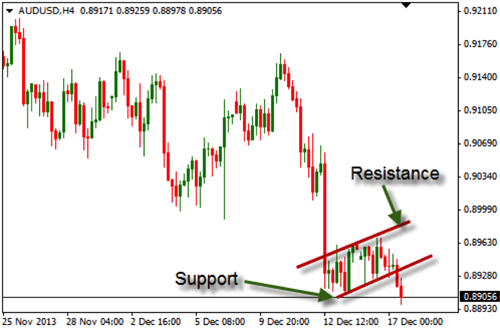
In this first chart you can see we are looking at the AUD/USD on a 4-hour time frame. Each one of the candles on this chart represents a 4-hour block of time. Many traders prefer this time frame as it gives them time to really evaluate what is going on and then make the decision as to buy or sell without the time crunch they may feel on short time frame charts.

Notice on the chart we have outlined an area with two red lines – the top line representing resistance and the bottom line representing support. This is a commonly seen price pattern and can be called several things, including: consolidation, bear flag, rectangle. The reason why we want to point this out is that it can give us a good visual location as to where we might enter the trade. The entry point would occur on a break out of these two levels. In this chart you can see that the candle has broken below the support, which would indicate a shorting opportunity.

Chart #2

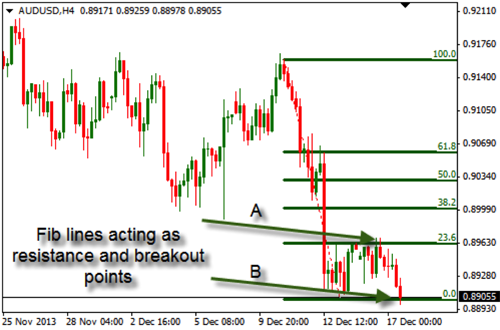
In this chart below we have placed a Fibonacci retracement line to identify some potential areas where the price might be experiencing some difficulty moving. Line A represents the 23.6 fib level where the price ran into resistance. After hitting this level, the price dropped down and is currently showing a break below the 0 fib level. A break of this level would suggest that the price might continue to move lower.

Chart #3

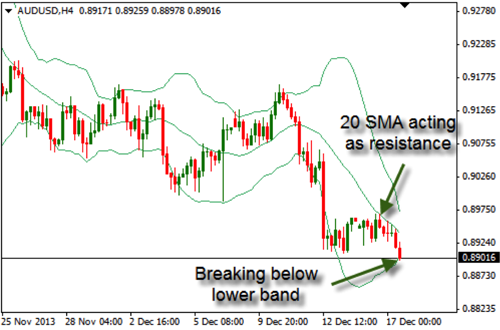
In this last chart we have placed a standard Bollinger Band indicator. In this, you will also notice that the price ran up to the 20 period Simple Moving Average where it experienced some resistance. This resistance caused some selling pressure to be placed on the price, causing it to drop back down. You will also see that it is currently dropping below the lower band which would indicate some continued weakness.

As you look at these charts with the various indicators on them, you will notice some similar information given. In each case the price is moving down and through areas where you would be looking to short the pair. They also show areas where there has been some resistance in place. Whether you are using one of these, all of these, or something completely different, you will want to have some way of identifying and analyzing what is happening on the charts you are trading. Some traders want to keep it very simple and only use one method while others will use multiple tools to help them confirm what they are seeing. The key is to be consistent and confident in your abilities to analyze your charts.

Trading Psychology: Keys to Controlling Your Emotions

One of the hardest things traders need to overcome is themselves! Why do I say that? Because it is often our your own emotions that sabotage your trading. There are a couple of keys that can help you to control your emotions and find more success in your trading.

  1. Find a good basic system and stick with it (notice, I said a “good” system, not a “perfect” system). Traders are often looking for the next best or greatest thing and are hoping for that “Holy Grail” system of trading. This is an easy trap to fall into because of all the marketing hype out there. Even the very best systems are not perfect and are going to have periods of losses. This is just a fact of life. But, if your system has been back-tested and works relatively well in a variety of market conditions, one of the best things you can do is to stick with it! Don’t fall for the system that promises “easy money”, because, over time, that system is just an illusion. We can often get into the mindset of always looking for the best system and ignoring the fundamental trading rules that will give us good results over time.
  2. Get a good routine and follow it. Consistency is the key here. What I mean by that is that you should treat trading as a profession, not just a hobby. In order to have a good routine, you should understand and decide what you are going to trade. In other words, specialize in a few things and get very good at those and leave the rest for someone else to do. Also, when you trade is very important and is also heavily influenced by the markets you trade. For example, if you trade Forex you may have more flexibility to trade at different times than if you trade stocks or options, which have specific exchange trading times. Also, where you trade is important – you should set up a place to trade, be organized, and free from distractions that might inhibit your trading. The overall message here is to take your routine seriously like if it was your only source of income and be very consistent with what, when, and where you trade.
  3. The last key to controlling your emotions is to use good, consistent risk management. If we risk too much on any one trade or if we risk too much of our account on too many trades, it is easy to let our emotions get the better of us because we will have too much anxiety sometimes to make rational decisions. That will bring fear of losing into your trading and can cause you to make significant trading errors. The way to control this is to make sure that you use stop loss orders and that you make sure that your position sizing is appropriate to the size of account you have. I limit my risk to 1 percent per trade and no more that 3 percent overall at any one given time. This allows me to sleep good at night even if my trades go against me.

Being a successful trader largely comes down to controlling our emotions by being more disciplined – follow a good system, a good routine, and good risk management!

Can You Hear Them Crying?

Last week there was an announcement that was made that a bi-partisan agreement had been reached on the budget that may keep the government from shutting down in the first quarter of next year, as it did earlier this year. Since no one from either party, except the people that crafted it, seems particularly happy with it, I believe that this is a clear indication that this may be a good one. I don’t need to know what’s in it, I just need to know that many people in Congress don’t like it, which tells me it didn’t go far enough to meet whatever agenda each side has. Let’s be honest, for the most part, our representatives in Congress are more interested in what will serve them the best and the longest, which is really focused around getting them re-elected. Because there is so much complaining, I believe that it could be a very good sign that something may actually be getting done that’s in the best interest of the country.

The potential for another government shutdown was created with the most recent temporary agreement that was to be revisited in the first quarter of next year; the thinking was that this would give them time to come up with a solution. Since the likelihood of any logical solution or agreement coming out of Congress seems like a long shot at best, this new agreement may be about all we can hope for.

It will be interesting to see the way that the markets react to this agreement going forward because another shutdown was weighing on the minds of traders and investors; it was another thing that could slow the economic recovery setting us back for a time as it did the last time. Since this may be one obstacle that is no longer in our way, will this lead us to extend the markets rally that we have seen over the past year? Understanding, of course, that the rally is more the result of government intervention in the economy, which leads directly to them manipulating the markets, keeping it fictitiously high. Will the removal of the threat of a government shutdown pave the way for extended stock gains?

One thing that I find particularly interesting about the stock market right now is that when the end of the government manipulation is mentioned, it no longer shocks the markets into a downward spiral. In fact, there was a report that came out a week or two ago that stated that the government may be willing to begin to reduce the amount that they are manipulating the markets and the market was actually up on that day. Of course their manipulation is in the form of the $85 billion dollars per month that they are pumping into our financial system, which makes people feel good about the economy, but it is something that really isn’t there. In the past, when the Fed mentioned tapering off and reducing the amount that they pump into the economy, the markets were rocked and spiraled downward. But since this has not been the case recently, is this an indication that we are now okay with the government letting the so-called “free markets” be “free” to act how they are designed to act? Will this newfound confidence that we have in ourselves, in addition to the roadblock being removed around another potential shutdown, continue the current market rally well into next year? At this point, is there actually a reason to believe that anything could derail the market from moving forward?

We can analyze the markets all we want and come with as many opinions about what is going on as we can, but the bottom line is still that a large part of what the markets are based on is the emotions of it participants. When traders and investors feel good about the economy and generally what is going on in the world around them, the truth really doesn’t matter. All that matters is that they feel good so as long you can make enough people believe one thing, since perception is reality, the markets will react in the way that its participants generally feel about the world around them. At some point reality may set in. So while we should participate in as much of the rally as we are comfortable being in, we also need to be very mindful that it is fragile and could turn at any time. We need to be nimble and ready to move into cash at a moments notice.

Reading Charts

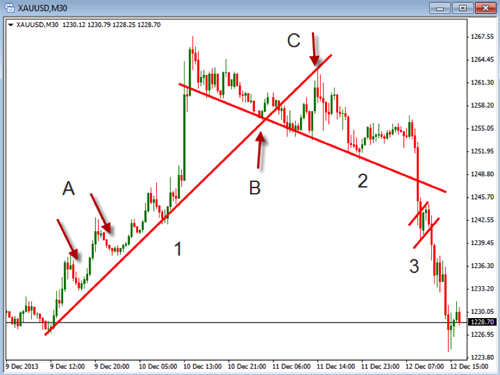
One of the most important things we need to learn to do is read the charts. Becoming a good chart reader means you can look at any chart and see some specific things. These things include seeing the trend, support and resistance, and price patterns. By knowing these things on the chart, we can be prepared to identify some trading opportunities. This does not mean we know for sure what will happen, but it does give us an idea of what may be happening. If we know what might happen, we can be prepared to take advantage of it when confirmation is made.

In the chart above, there are several things we will point out:

  1. At the letter “A” there are 2 arrows pointing downward. These two arrows are showing places on the chart where the price has experience a pull back. This type of price action happens all the time and is where the price movement is taking a break. This break in momentum will allow for good opportunities to enter a trade prior to the trend resuming. If we can identify this, we will be prepared for trading.
  2. At point “B” you can see where price is being supported by the line “2” and line “1”. Line “1” is an upward moving support line where price has been bounce up off of. Knowing where support is located will give us opportunities to enter on the bounce up off this area. Line “2” is also showing this type of support.
  3. At point “C” you can see where the old support line “1” acted as a new resistance line at point “C”. By identifying this as a resistance point ,we can look to sell our open trade or look to enter into short positions.
  4. Point “3” shows a flag type of pattern where we would look to short after the bearish trend resumes. A bear flag like this is commonly seen along a longer trend and one where lots of traders will look for entries, so the patterns tend to work out well.

Obviously we are not illustrating all of the things that are happening on this chart, but we do want to point out the importance of being able to look at a chart and quickly place on it some of the most important information. If you can get good at this, you can take any chart and any time frame and quickly know the areas where you may be looking to trade. This doesn’t mean that you cannot, or should not, use technical indicators, it just means you need to realize the importance of reading the price action on the charts. If you can, first and foremost, trade the price movement, you can then add indicators to help you confirm what you are seeing on the charts.

Take some time to practice looking for the trends and support or resistance by drawing lines on the charts. As you become more proficient at this, you will become a better trader.