Today we are going to look at how we can use the stochastic indicator to help us better identify potential entry points. Stochastics can give us both buy and sell signal by looking at the actual line as well as it can show us potential divergence on the chart. When a chart has moved up or down a significant amount you will often times see it move into an overbought or oversold area. These areas are where we can look to buy or sell as the price begins to reverse the direction.
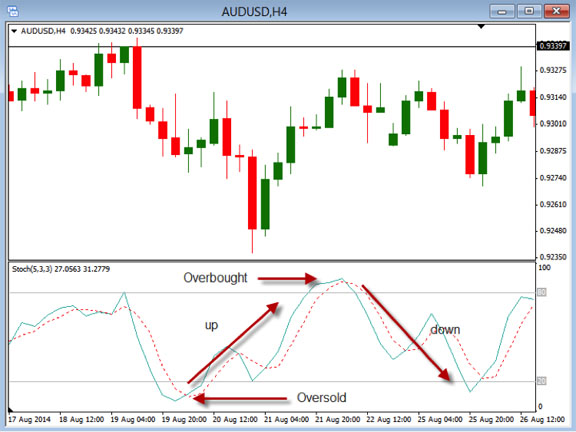
Take a look at the chart below to see how overbought and oversold conditions might give us times to buy or sell.

In this chart you can see that the stochastic indicator has moved into the areas above 80 and below 20. Then it is below 20 it is considered oversold and when it is above 80 it is considered overbought. As the stochastic indicator begins to move up this is suggesting that the price should begin to show some bullish strength and when the stochastic line begins to move down the price should show some bearish movements. Of course there is not guarantee that the price will move in the desired direction but it can give us a heads up that price may begin to move.
When trading the stochastic line you will want to make sure price confirms the movements that you are anticipating. Just because the line is above 80 doesn’t mean that it can’t stay above it and the price continue to move higher. Use this to give you a warning of a possible price direction change.
The other help we can get when using the stochastic line is to look for divergence. This simply means that the price and the stochastic line with be showing strength or weakness in the opposite directions. Take a look at the chart below to see both bullish and bearish divergence.

Here you can see the bearish divergence on the left where the price made higher highs while the stochastic indicator made lower highs. This would suggest that the price is getting weaker and to look for a bearish move in the price. On the right you can see the bullish divergence which the price is making lower lows while the stochastic indicator is making higher lows.
As you look at using the stochastic indicator for both over bought and oversold entries as well as finding divergences, you will see that this tool can give you a good ideas that the price is ready to move. The final piece using the stochastic indicator is to make sure you rely on the price action to confirm the movement is going to happen.
Take some time to practice using this indicator to see how it can help you improve your trading. As you get more acquainted with how this indicator works you will find that you will be able to read the charts a bit better. Don’t rely on it solely but use it as a tool to help you confirm your entries.