How to Choose a Broker

Choosing a broker is one of the most important decisions you will make as a trader. Without a broker, you will not be able to trade; therefore, this decision should not be made lightly. There are many good brokers available, so you will need to take the time to identify which of these will be best for you. The best broker for you is the one that gives you all the tools you need to trade successfully. Don’t rely on other traders to tell you which one to use, as they may have other trading needs than what you have. Take the time now to choose the correct one for you and you will be happy in the long run.

So what makes a broker a good one? Well, most brokers will have all the basics you need in order to place a trade. You will likely find they are similar in entry and exit orders, as well as placing a basic stop loss. The important thing for you to look at is what they have beyond these basic and common features. You will want to look at your trading methods to make sure you can place a trade based off your rules. If they do not have your needed features, you will want to pass on them as your broker.

With this in mind, let’s discuss some of the more important points to consider when deciding on a broker.

1. Are they regulated?
This is an important place to start, as you will want to avoid brokers who are not regulated. There are enough risks associated with trading that we do not want to add more by trading with unregulated brokers.

2. Commissions
How much are you going to pay when you place a trade? This is an important point because it can directly impact your bottom line. The more we pay for commissions, the less we will make.

3. Executions
You will want to make sure your trades get executed fast. If they are slow, you will likely get a poor fill and will not be happy with the entry price. It may be worth paying a little more in commissions if you are getting better fills. You can test how fast your broker fills are by practicing in their demo account.

4. Support
You will want to test out their support help. Call them and ask questions. If you speak to them and they are unfriendly or just don’t seem to care, you will want to cross them off your list. Good customer service is critical when it comes to helping you resolve issues you might have.

5. Trading Platform
Do you like the charts and are they easy to use? Can you easily access the area where you will be placing a trade? Do the charts have all the tools and indicators that you will need to use to trade your method?

6. Order Executions
Can you place the types of trades you will be using? If you need conditional orders, you will need to make sure they have the capability to do so. If you need trailing stops, are they available and do they work?

7. Funding
How are you able to fund your account? Do you need to do a wire transfer or send a check? You will want to make sure you can add or withdraw funds simply and quickly.

8. Demo Account
You will want to be able to practice in a demo account. This is a great way to test out the broker and to practice new methods as you expand your trading strategies.

9. Other Markets
Will you be able to trade other markets like stocks, options, forex, futures, bonds or ETFs? You might not need these now but you may in the future.

10. Appearance
How does the platform look and do you like to look at it? This might seem insignificant, but if you have to look at it every day, you will want to make sure you like it.

As you begin to look for a broker, make sure you take the time to evaluate each one in detail. Doing this at first will save you the frustration of having to change at a later time. Remember, what works for another trader might not work best for you. Take the time to review these things and use them to help you in identifying the best broker for you.

Successful Traders Avoid These Emotions

To be a successful trader one of the most difficult things to overcome is yourself. Why do I say that? Because no matter what rules you use and how good they may be, if you do not control your emotions, you will short-circuit or derail your trading success. Having confidence in your rules and having the discipline to follow them is the key to you controlling your emotions. Here are the three most significant emotions to be careful of: fear, greed, and hope.

Fear
Let’s start with Fear. Fear can be broken into two categories: fear of losing and fear of missing a gain. First let’s discuss fear of loss. Nobel Prize winners have shown that the loss of a single dollar is more painful than the joy or happiness of gaining three dollars. Therefore, the pain of a loss can drive even the best trader to abandon the rules of their system to avoid further pain. The key to this is to follow the rules, especially after a loss or two. The second effect of fear, which is not discussed as much, is the fear of missing out on profits and can be just as strong as the fear of losing. This often results in forcing a trade, like window shopping and not finding anything you like. You should not force the situation when a good trade setup is not there. Also, if you missed an entry, and it starts to move in your favor, jumping in late or chasing the trade, fearing the loss of a good opportunity, will often lead to a negative outcome. Don’t chase a trade. If you miss a trade, let it go and be patient to wait for another good opportunity.

Greed
Greed can be very powerful. In fact, it can be just as strong as fear. Greed is one of the emotions that can easily lead to a trader’s downfall. Greed can drive a trader to abandon his or her rules for the desire to get more profit and can lead to staying in a position past what is reasonable for the current market conditions. Often a trader will enter a position with unreasonable expectations. It is important to evaluate the current situation and not stay in a trade trying to get more or entering a trade late trying to catch more profits than your rules call for.

Hope
Hope is an emotion that comes into play when we break the rules and we hope that the trade will “just work out”. An example is when we get into a trade on a whim and the setup rules were not clearly met. Another example is when we enter a position with too large of a position for our account size, hoping for a bigger profit (this could also fall into the greed category). Also, staying in a position too long with a loss, hoping that the market will move back in our favor and “save” us.

In the end, it is critical that you learn from your mistakes and identify where we are weak and work on controlling our emotions. If you can understand and control these emotions, you will be able to trade much more effectively.

Know When NOT to Trade

This might not sound like an interesting topic to discuss, but it may be one of the most important topics you can learn. If you know when not to trade, then it would make sense that you would know when to trade. Sometimes we feel like we should be able to trade anytime and anywhere, but that is not always the best approach to take. Trading just to trade will, often times, put us in a situation where we are at a disadvantage and that is not a good idea. Being able to know when not to trade can be a very valuable tool, as it will keep us trading during the best times.

So in this article we will discuss some of the times when we might decide not to trade. This does not mean we cannot trade during these times, but you should consider the wisdom in trading during these times.

  1. Trading after hours or when the major markets are not active. When trading the stock market you may have the opportunity to place after hour trades. This can be dangerous as the market becomes very illiquid and can become very volatile. When trading the forex market, even though you can trade 24 hours a day, the times when the major markets are not open can cause a similar non-deliberate movement to occur. Trading when there is the most activity will typically give you the best opportunity to see deliberately moving price action on the charts. These times are going to give you the best opportunity to find good trade setups.
  1. Holiday times. As we approach the end of the year we find ourselves in time when there are some major holidays. These holidays not only cause the market to close but cause traders to focus less on trading and more on the time of the year. As trader become more engaged in the holiday season the take more time off. As the markets become less liquid they become less deliberate in how they move. It is important to keep this in mind as we come to the end of the trading year.
  1. End of the week. The end of the week might be a time when we decide not to trade. In both the stock and forex markets we close down for the weekend which can cause potential for big moves during the closed times. With all the potential for news that can come out over the weekend we can also see some big movements as they reopen at the beginning of the week. These possible movements can be a reason to avoid trades as the week comes to an end.
  1. Major news announcements. During times when major news or economic reports are released the market can become more volatile. Avoiding these times will keep us from trading when the market is less deliberate. Although we cannot totally avoid news we can avoid those that are likely to cause the markets to become more volatile. Some common news events that are considered big are the FOMC, Employment numbers and news dealing with interest rates. Take some time to look at an economic calendar on a weekly basis to make sure you avoid these volatile times.
  1. Earnings release. This is the time that companies release how well or poorly their company has done over the past quarter. Trading before the release of these numbers can cause significant movement on the charts.

Of course these are not all the reasons why we might not trade, but these are some common times that we might consider not trading. Take some time to make sure you know the best times to trade and the best times to avoid trading.

Market Cycles and How to Trade Them

Today I will discuss how the market cycles from consolidation to breakout and back to consolidation. Sometimes traders refer to these breakouts as market expansions. These expansions or breakouts can be either long (going up) or short (going down). Often once a market expansion or breakout is ended the market will slide into a consolidation mode or ranging type of market movement. These consolidations often come just after a strong move in either direction are the aftermath of the market when the price action starts to slow down and moves more sideways in a generally tight range. Some of the best trading comes just after a consolidation as the market is starting to breakout either long or short.

Let’s look at how to identify these breakout and how best to trade them. There are several patterns that can help us identify the consolidation patterns. These consolidations patterns fall into several different price patterns. First, you have a ranging pattern that is like a rectangle, second, a triangle, and third a flag pattern or a rectangle that is angled slightly against the trend. In each of these cases, there is a prevailing trend of movement in one direction or another and the consolidation pattern is almost a market “resting” or waiting for the market momentum to pick back up and take off. These consolidation patterns are sometimes referred to as continuation patterns. The tops and bottoms of the range of these consolidation patterns can be identified as a short term support level at the bottom of the pattern, and a resistance level at the top of the consolation pattern.

In order to trade a breakout, we first need to identify the tops and bottoms of the consolidation zones with a support and resistance level. This can be done by simply drawing a box or rectangle around the consolidations market with the tops and bottoms clearly marked. If the market trades or “breaks out” of the box either higher or lower then you can put in an order to go either long or short, depending on the price action. So, if the price goes up in a nice up trend and then consolidates in a trading range, you draw your rectangle and wait for the market to move out of that trading range. Once the market moves out of the trading range if the trend is significant the “breakout” will occur and the trade opportunity is present. So the trade setup can us a pending order. You can use a “Stop Entry” to set up the trade in advance. Once you have the consolidation zone identified, place a “buy stop” entry order at the top of the box and a “sell stop” entry at the bottom of the box and let the trade enter automatically once the price moves.

Of course there are no guarantees that the price will continue to breakout; however, many times the momentum will carry it on in the direction of the trend. You will want to place a stop loss order on the other side of the box just in case the move goes in the opposite direction. These can be very good trades when the momentum takes off after the consolidation. Look for some trade opportunities and put some practice trades on a paper trading account at first and give them a try, you will like them once you get the hang of it!

Stocks vs. ETFs

Is there a clear advantage to trading individual stocks versus ETFs or are you just as likely to end up with the same result regardless of which one you trade; are the two different types of securities interchangeable? They can be looked at as interchangeable in certain ways but there are striking differences between the two of them.

ETFs, Exchange Traded Funds, are comprised of a portfolio or a pool of individual stocks. The individual stocks that comprise an ETF may be from a specific industry, they may be from a specific geographic location or region, they could be constructed to mimic one of the major market indices, they could be constructed to mimic the movement of various types of precious metals or a specific precious metal, they could be created to follow a given foreign currency or foreign stock market index among other things. When you purchase a share of an ETF you are purchasing into the portfolio that the holding company has created however when you purchase a share of stock it is a piece of a corporation, you actually own part of the company that issued the stock, it would likely be a very small part of the company but regardless of the size of ownership owning a share of stock is still an ownership interest in the company.

The difference between the two is a little obvious; when you have ownership in a specific company through the purchase of shares of stock of the company you incur allot of different types of risks with a big one being the company risk. The company risk is the inherent risk that you accept simply by owning shares of a specific company’s stock. This type of risk includes the quality of the CEO and the upper level management team, the quality of the product or products that the company produces and/or sells and of course one of the biggest risks of all is how much money will the company make or lose. Corporate earnings are one of the biggest considerations there is when purchasing a stock because making money is the whole point of buying a stock, if the company that issued the stock does not perform well the share value will suffer, the dividend payout will be affected and in some cases the longevity of the company may be impacted. If we have all of these types of risks when buying an individual stock doesn’t it make sense that we will have the same risks if we buy into a portfolio of individual stocks except that the risks will be multiplied by the number of individual stocks that are in the portfolio?

This is true but by owing a portfolio of stocks we dilute the risk that any one of them or a few of them will perform badly over a given period of time by owning others that will likely perform well during that same period offsetting the bad behavior of the others. The risk also exists that all or most of the companies that are in the sector or industry that the ETF holds stock in will perfume badly all at the same time. If the specific industry or the specific reason that the stocks in an ETF are linked together has difficulty the share value of the ETF is likely to suffer because the shares of all of the individual stocks may be suffering leading to a drop on the ETF share price. This can be seen very clearly when we look an ETF that is designed to mimic a specific index, as the index rises and falls the ETF share price rises and falls with it.

My opinion is that it isn’t better or worse to trade either individual stocks or ETFs, since they are not mutually exclusive there isn’t any reason that I can find not to trade both. This means that not only do we have the opportunity to purchase individual shares of stock of a company in a given sector we also have the opportunity to trade the entire sector when the opportunity arises. In many ways it is much easier to pick specific sectors that may or may not perform well out into the future rather than trying to pick a specific company that may perform well.

What is Gold Doing?

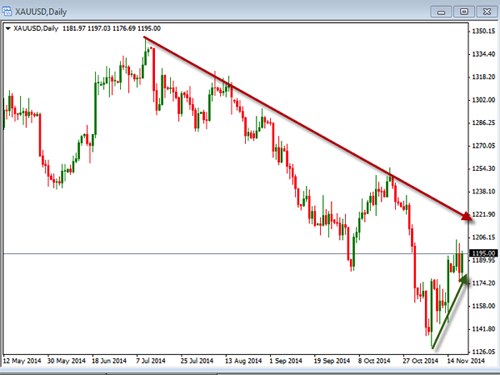
Today we are going to look at what gold has been doing and what it might be doing in the near future. As you know, gold had hit a high of just over 1900 three years ago and then has continued to drop down to the present time. This drop down has given many opportunities over that time to look to short gold. In the chart below you can see the daily chart of Gold.

In this chart you can see the red arrow with show the current down trend that is happening on the daily chart. There is also a green arrow which shows the current momentum of gold. Here we are seeing the trend, which is the longer term direction of the chart as well as the current momentum which is the short term movement that is happening.

When looking for a good opportunity to enter a trade we will want to look at these two things to identify the point of entry. In this case when the trend is moving down we want to look to short gold. The old saying, “The trend is your friend” can be used with this chart as taking trades in the direction of the trend will help us enter in the correct direction. The correct time to enter is just as important as the correct direction. In this chart you can see the price moving up toward an area of resistance. This area is the correct time to enter as well as the correct direction.

So the question now is what will happen to gold next? Of course we don’t know for sure but we can use the information we see on a chart to come up with a reasonable answer. With the trend currently down and the momentum currently up we will look at this as a reasonable area to go short. This means that it looks like the price is sitting at a resistance area and will want to drop back in the direction of the overall down trend.

What we need to have now is the actual trigger that tells us when to go short. Again, the direction is correct, the time is correct, now we need the trigger to be correct in order to enter a short trade. We could use an indicator like the stochastic to show us when price is falling again or some other similar indicator. The best trigger is usually to look at what the price is doing and enter as it begins to break down below some support or prior low candle. In this case we could look at the low of the last couple of days and enter a short position if it begins to move below it. This can be done with a market order by watching when this happens or a sell stop order place and waiting to get filled on a move down.

Regardless of what we use as our trigger, we will want to have our stop losses in place so we don’t take too big of risk in our trade. Take some time to review this chart to see if you can find an opportunity to take advantage of the next move.

What are Oscillating Indicators?

When trading the market using technical analysis, you will use the indicators on the charts to help identify trends, support and resistance and good opportunities to enter and exit the market profitably.  There are two main categories of technical indicator families, these are trending indicators and oscillating indicators.  Today I am going to focus on the Oscillating Indicators and how they work.  The main indicators in the oscillating family are the Stochastics, MACD, and Relative Strength Index.

Stochastics

Stochastics are one of the most common oscillating indicators.  This is because the Stochastics measure the swings in the market up and down as it moves between resistance and support. The Stochastic Oscillator measures the magnitude and momentum of price movements. The momentum is the rate of the rise or fall in price.  The Stochastic indicator is measured on a scale from 0 to 100, with high and low (overbought and oversold) levels marked generally at 80 and 20, percent levels.  When the indicator moves up above the 80 percent line and then “hooks” back below the 80 line towards the middle is a good indication that the price momentum is moving down.  The opposite is true, if the indicator is below the 20 percent line and “hooks” up above the 20 percent line towards the middle shows upward momentum.  Also the stochastics are helpful to identify potential changes in direction by showing momentum weakness sometimes before the price action changes.  This is referred to as Divergence between the price action and the indicator.

MACD (Moving Average Convergence/Divergence)

The MACD as this indicator is commonly referred to, is also an oscillating indicator which is really easy to use.  The MACD is and indicator that shows momentum positive or negative momentum as the MACD line moves above or below the middle 0 percent line. When the MACD is above the zero line, the short-term average is above the long-term average, which also signals upward momentum. The opposite is true when the MACD is below the zero line. As you can see from the chart above, When the MACD line crosses the zero line we see significant momentum in the price chart above it.  Like the Stochastic Oscillator, Traders may use the MACD to identify areas of divergence with the potential of a market shift in the opposite direction.

Relative Strength Index

The Relative Strength Index (RSI) is another technical indicator in the oscillator family of indicators.  The RSI measures the velocity and magnitude of price movements in a range. The RSI computes momentum as the ratio of higher closes to lower closes: in other words stocks which have had more positive changes have a higher RSI than stocks which have had more negative changes.

The RSI is most typically used on a 14 day timeframe, measured on a scale from 0 to 100, with high and low levels marked at 70 and 30, percent levels. Shorter or longer timeframes maybe used for alternately shorter or longer outlooks.

The RSI shows that tops and bottoms are often reached when RSI goes above 70 or drops below 30. Usually, RSI readings that are greater than the 70 level are considered to be in overbought territory, and RSI readings lower than the 30 level are considered to be in oversold territory. In between the 30 and 70 level is considered neutral, with the 50 level a sign of no trend.

Conclusion

To better understand the momentum of the market especially within a trading range, these oscillators can give any trader a better idea of the momentum of the market, which can be very helpful for trading especially when the momentum is the same direction as the trending indictors.

Trading Stocks vs. Trading Options

When it comes to trading stocks versus trading options one isn’t necessarily better than the other and they are not mutually exclusive. If you’re a stock trader or a wannabe stock trader there probably isn’t any reason for you to trade stocks versus the options on the stocks other than fear, lack of knowledge or possibly the belief that trading options is inherently complicated and very risky. While all of the above listed reasons are good reasons for not trading a given security they probably apply to trading options a lot less than most people believe. Trading any type of security is risky and a good way to partially deal with the risk is through education. The more you understand a given type of security the less daunting and scary it will become and the better equipped you will be to protect yourself when trading it.

A simple and basic stock trade can be very scary for people that do not normally trade stocks but after you trade for a time and get accustomed to how trading works it is much less scary. Trading in the Forex market has this effect on people because it is the biggest, fastest and some may say the most ridiculous market we have created but I love it, I’m a very active Forex trader. I understand the Forex market so it’s not scary to me at all. The more you know about something the more normal it seems, trading options is no different.

If you start to think about trading options from a business standpoint and even from a common sense standpoint you will likely see that there are tremendous advantages around trading stock options versus trading the actual shares of stock. One objection that I have heard around trading stock options is that you do not own the actual shares of stock when you trade the options but a basic business reality is that who owns something is often times far less important than who controls it so having control without ownership can be very advantageous.

The business part and maybe the common sense part of trading options comes in when you look at how much it costs to purchase 100 shares of a given stock versus purchasing an option to control 100 shares of the same stock. It will typically take a fraction of the money to buy an option than it will take to buy the actual shares leaving you with more capital to make work for you elsewhere. It can also be an advantage for people with smaller accounts that may not be able to afford to purchase 100 shares of stock, buying an option is typically much more affordable. Purchasing 100 shares of a $150.00 per share stock would cost $15,000.00 plus transaction fees but buying an option on that same stock would likely cost about $1,000.00 and maybe less. When you buy a stock the entire amount of your purchase is at risk and when you buy an option the entire amount is also at risk, the obvious difference is the smaller amount of cash that is used and at risk for the option purchase.

If you are not currently trading options and you have a good method for picking which stocks to trade I believe that it may be a very good idea to continue doing exactly what you are doing but when you make a stock purchase look at the available options. Look at the price of one of them that is a few strikes in the money and that has a few months until it expires. Follow the price movement of the stock and the option and when your stock trade ends compare the results to an options trade over that same period of time to see which one provides a better return. If it is a winning trade the options trade would almost always provide a far superior return with less risk. If you are successfully trading stocks there is no reason to change anything but it may be a good idea to look at the advantages of options trading possibly including it with what you are already doing. Having a few small options positions in conjunction with your typical stock positions may be a very good way for you to participate in more trades while enhancing your total return.

What is a Successful Trader?

Having been a trader and worked with traders for over 20 years, I have some insights into what it takes to be a good trader. Some of the elements might surprise you. The first thing to do is look at your trading from a holistic approach.

Routine
Your routine is as important as what your system is; you need to be consistent with your trading. It is generally best to look at your trading as a business. As with any business, is important to outline your process and plan. This includes what you trade (stocks, forex, commodities, options). Once you decide what you trade, this will help understand the best times to trade. For example if you are going to trade Stocks of ETFs, you will be trading during the market hours for the exchanges you trade. With Forex, you can actually trade day or night, five days a week. If you trade Forex, you still need to decide what times you want to trade, because you just can’t trade all hours day and night.

In addition, to what and when you trade, you need to decide where and how you trade. Make sure that your trading desk/office is organized in a positive way for your purposes. Now once you have decided what, when and where you are going to trade, make sure these things fit into your circumstances so that you can be consistent over time.

Trading Method
Most people feel that to be a good trader they must have the best trading system of trading method that they can get there hands on. This is why so many trading systems are purchased just to find that it is not the Holy Grail that was promised. There are many good trading systems; however there is no perfect system that will trade without losses in all market conditions, such trading system DOES NOT EXIST!!!! So what do we do, give up on trading? Now it is important to determine a trading method with a specific set of rules that will fit into you daily routine. Whatever method you work with you should spend a good deal of time back testing the rules. The more back testing you do, the more confidence you will have in the rules. Your method should include very specific entry rules, and exit rules so that it can be followed systematically. Risk management is one of the most crucial components to any trading method. I recommend, regardless of method that you limit your risk to no more than 1 or 2 percent of your trading account.

Discipline
The final element to successful trading is not complicated, but it is simple having the disciple to follow through on the previous items, the routine and the rules and the risk management. The simple truth is, once you have your routine and rules back tested, it is important to follow those rules systematically which will allow you to control your emotions and allow you to become a more disciplined trader.

Conclusion
In conclusion, it is important to have a good routine, and good method with back tested rules and good risk management. Once you get this worked out, the final key it to follow through and have disciple to avoid the emotions that short circuit the trading of many traders.

Looking for Trend Change

In today’s article we are going to look at some of the most important things in regards to the trend. As you have heard many time, the trend is one of the most important things we need to evaluate when analyzing a chart. By knowing the direction or trend a chart is moving we can know the type of trade we should be taking. If the trend is up then we will be buying and if the trend is down we will be looking to short or sell.

Being able to identify a trend on a chart is relatively easy when looking at the past history of price action. In fact almost everyone can look at a chart and see if it is moving up or down. Someone who has never even traded before can identify this. It can be a bit more complicated if the trend is not moving up or down and is stuck in a sideway range but that can even be identified fairly easy by looking at the charts.

What sometimes is more difficult to identify is when this up or down trend is beginning to change directions. Often times by the time we can clearly identify the trend as up or down on the chart, it is too late to take the trade. In other words, by the time we can see the chart trending up or down on the chart it may be too late to take the trade and in fact, it may be the wrong time to enter the trade. Traders will become frustrated because they think they are trading with the trend and then get caught right as it begins to reverse.

Being able to identify not only the trend, but when this trend is ending can be the more important part of chart evaluation. Knowing when it is changing will help us know when to get into the trend at the beginning of the trend, not the end of it.

So what can we use to help us identify possible trend change? There are a couple of things you can look at to help show when this is happening. The first and most important thing is to look at the price. Typically, when price is trending up it is making higher highs and higher lows, so if this changes then you know a possible trend change is getting ready to happen. The reverse is true also. As these actions in price change we need to look for the establishment of the new trend by confirming the correct price action such as lower lows and lower highs for the new down trend.

Another tool that is commonly used is the moving averages. For example, you could use a 40 period SMA to see the direction it is moving and when it changes you know there is a possible trend change. Last but not least is to use channel lines to identify trend change and look for the time that the price move out of the up or down channel.

Regardless of what you use or how you do it, take some time to determine how you are going to identify these changes in trend. As you do this you will find that you are getting in at earlier times in the new trends.